

Managing port projects is a complex task that involves large budgets, multiple contractors, strict timelines, regulatory compliance, and high operational risks. Port authorities and logistics organizations must continuously track cost, progress, performance, and delays to avoid financial losses and operational disruptions. However, when project data is scattered across spreadsheets and manual reports, visibility decreases and decision-making becomes slow and reactive.
That is exactly why the Port Project Management Dashboard in Power BI becomes a powerful and essential solution.
This ready-to-use Power BI dashboard provides a centralized, visual, and interactive platform to monitor all port projects in one place. It transforms raw project data into actionable insights, allowing managers to track performance, control costs, identify risks, and improve overall project execution. With real-time visuals and drill-down capabilities, this dashboard supports faster, smarter, and more confident decision-making.
✨ Key Features of the Port Project Management Dashboard in Power BI
📊 Centralized Project Monitoring
View all projects, budgets, costs, and profits in a single interactive dashboard without switching between multiple files.
💰 Financial Performance Tracking
Monitor budgeted cost, actual cost, revenue, and profit to ensure projects stay financially healthy.
⏱️ Schedule & Delay Analysis
Identify delays early and analyze project timelines to avoid schedule overruns.
⚠️ Risk & SLA Monitoring
Track project risk levels and SLA performance to minimize operational and financial exposure.
📈 Interactive Power BI Visuals
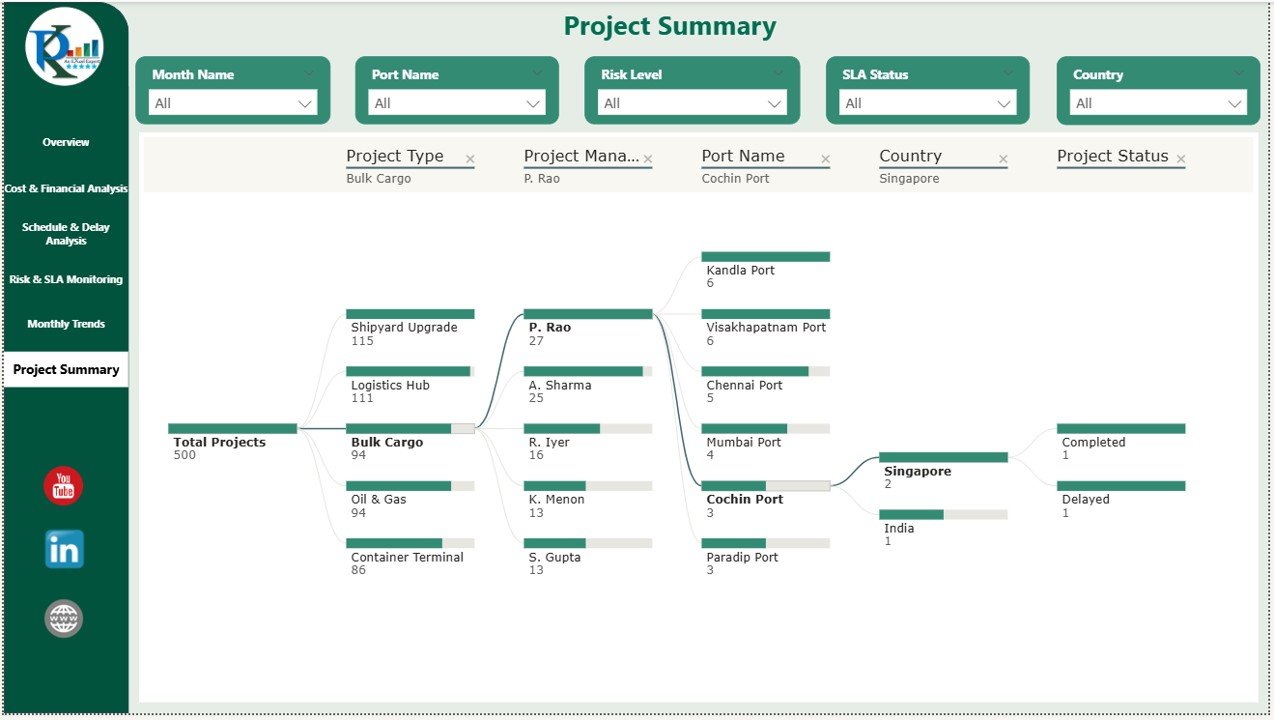
Use slicers, filters, and drill-downs to explore data by port, country, project type, or manager.
📦 What’s Inside the Port Project Management Dashboard in Power BI
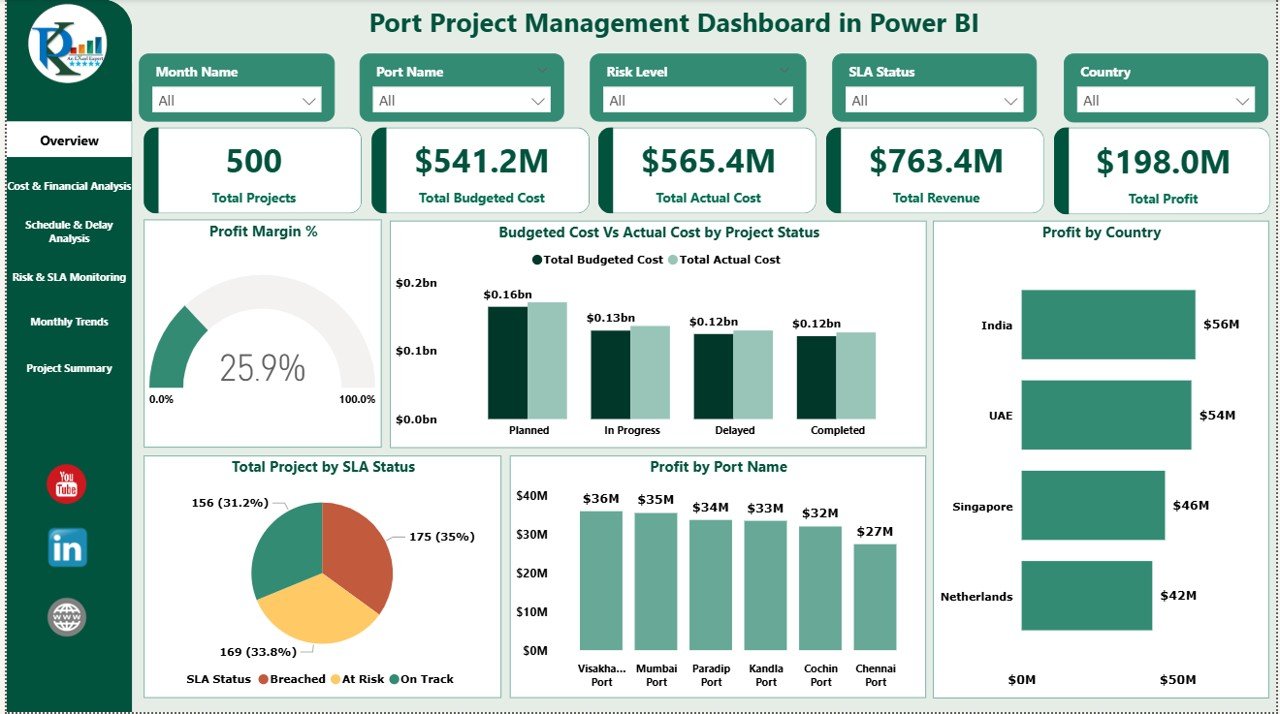
🖥️ Overview Sheet – Executive Summary
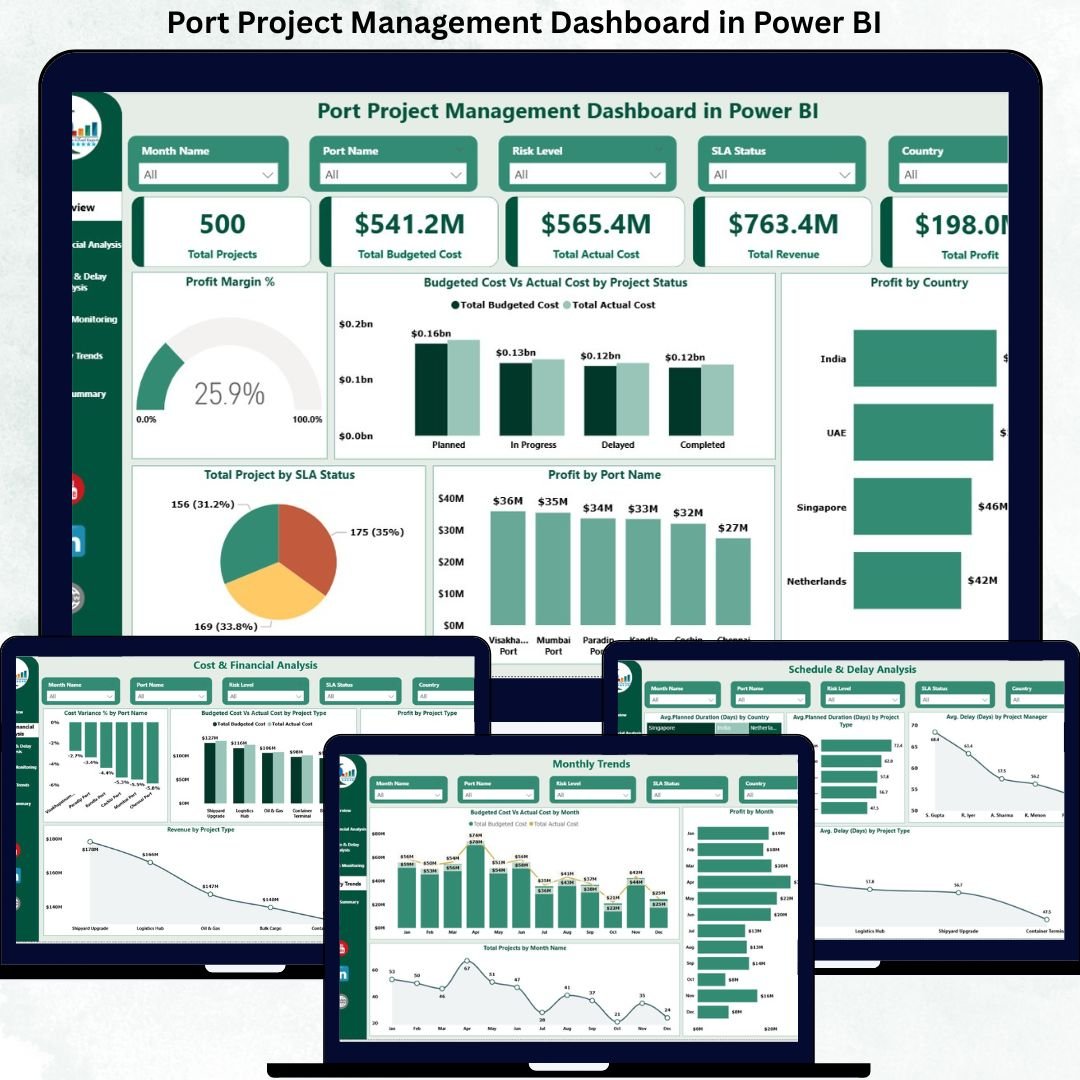
The Overview page provides a high-level snapshot of overall project performance.
KPI Cards
Total Projects – Number of active projects
Total Budgeted Cost – Planned project budget
Total Actual Cost – Cost incurred to date
Revenue – Revenue generated
Profit – Net profit across projects
These KPIs help leadership instantly assess financial and operational health.
Overview Charts
Profit Margin % – Shows profitability efficiency
Budgeted Cost vs Actual Cost by Project Status – Highlights cost overruns
Profit by Country – Displays country-wise profitability
Profit by Port Name – Identifies high-performing ports
💰 Cost & Financial Analysis
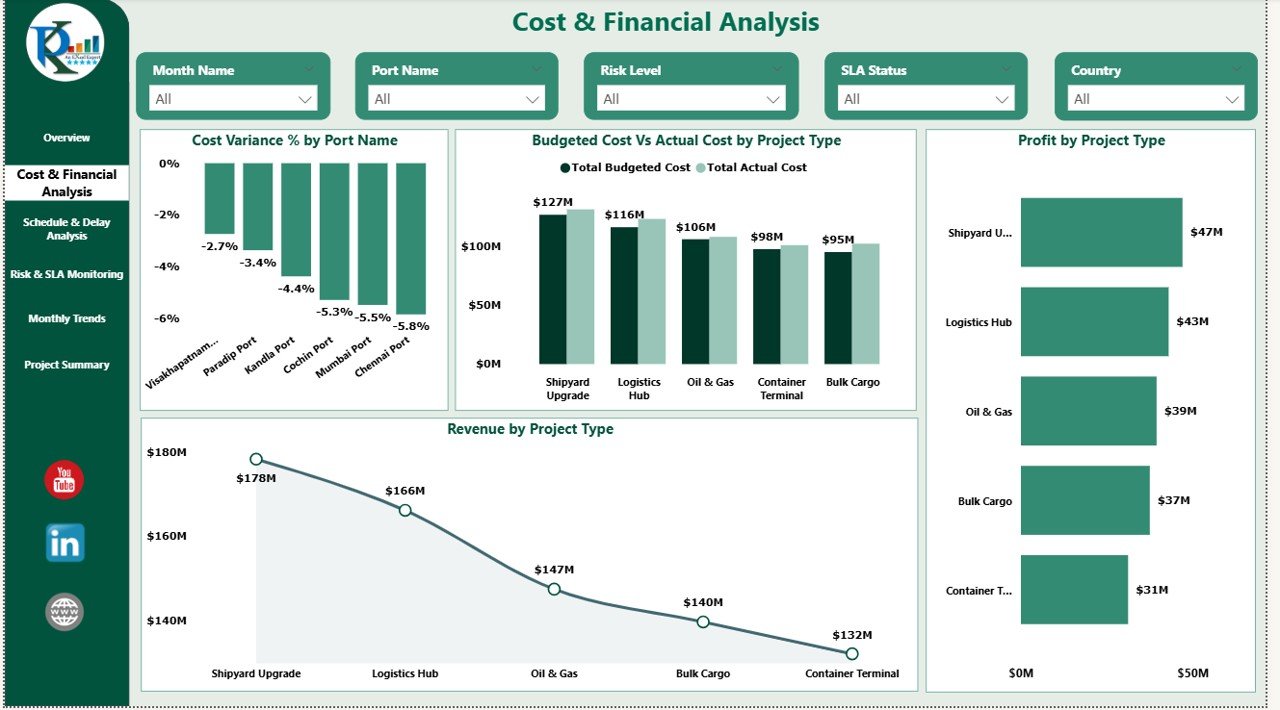
This section focuses on cost control and financial performance.
Charts Included
Cost Variance % by Port Name – Identifies budget deviation
Budgeted Cost vs Actual Cost by Project Type – Highlights cost efficiency
Profit by Project Type – Shows high-margin projects
This analysis enables finance teams to control expenses and optimize budgets.
⏱️ Schedule & Delay Analysis
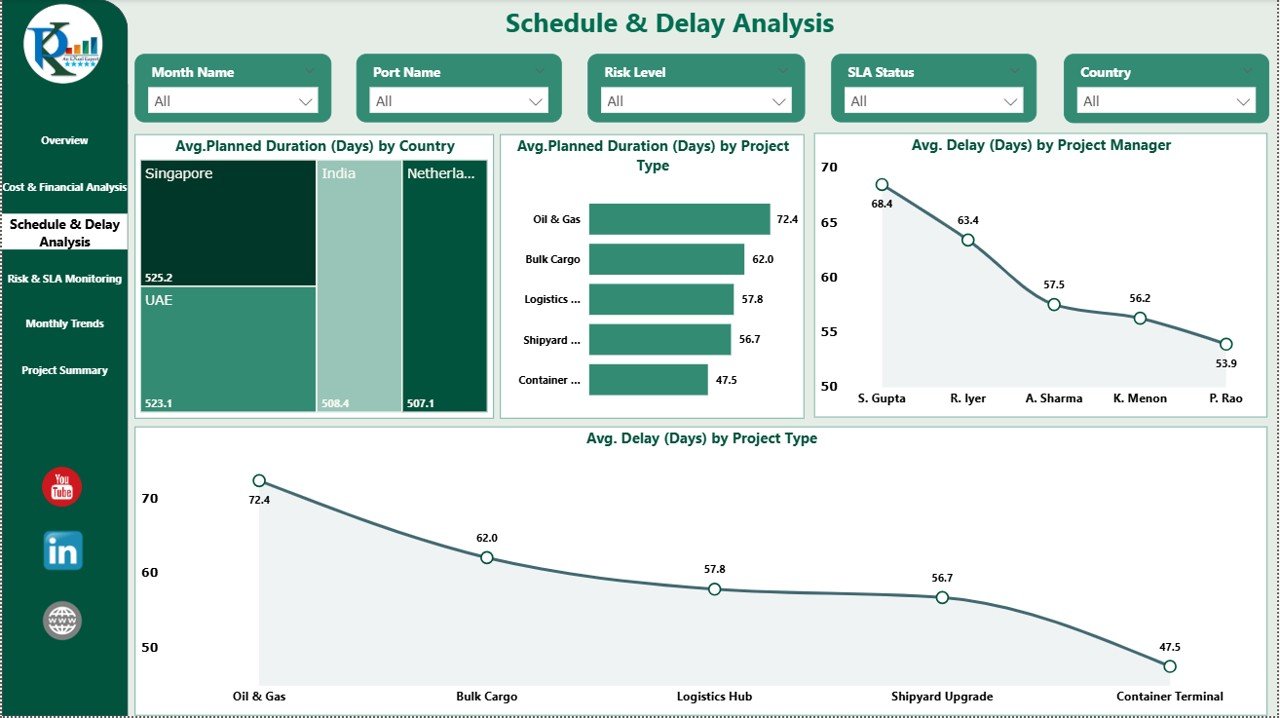
Delays significantly impact port operations. This section helps identify and reduce delays.
Charts Included
Average Planned Duration (Days) by Country
Average Planned Duration (Days) by Project Type
Average Delay (Days) by Project Manager
Average Delay (Days) by Project Type
These visuals help management improve planning accuracy and accountability.
⚠️ Risk & SLA Monitoring
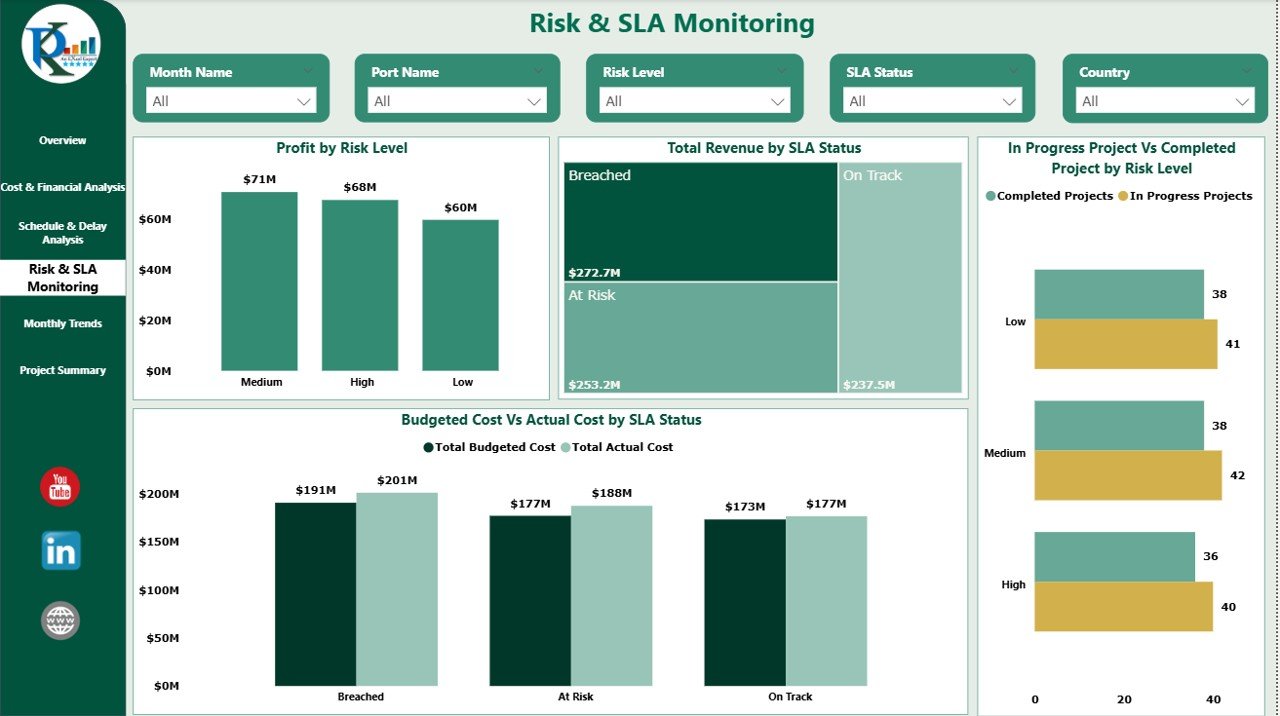
This section focuses on project risk and service-level performance.
Charts Included
Profit by Risk Level – Measures financial exposure
Total Revenue by SLA Status – Tracks SLA impact
In-Progress vs Completed Projects by Risk Level
Budgeted Cost vs Actual Cost by SLA Status
This ensures proactive risk management and better SLA compliance.
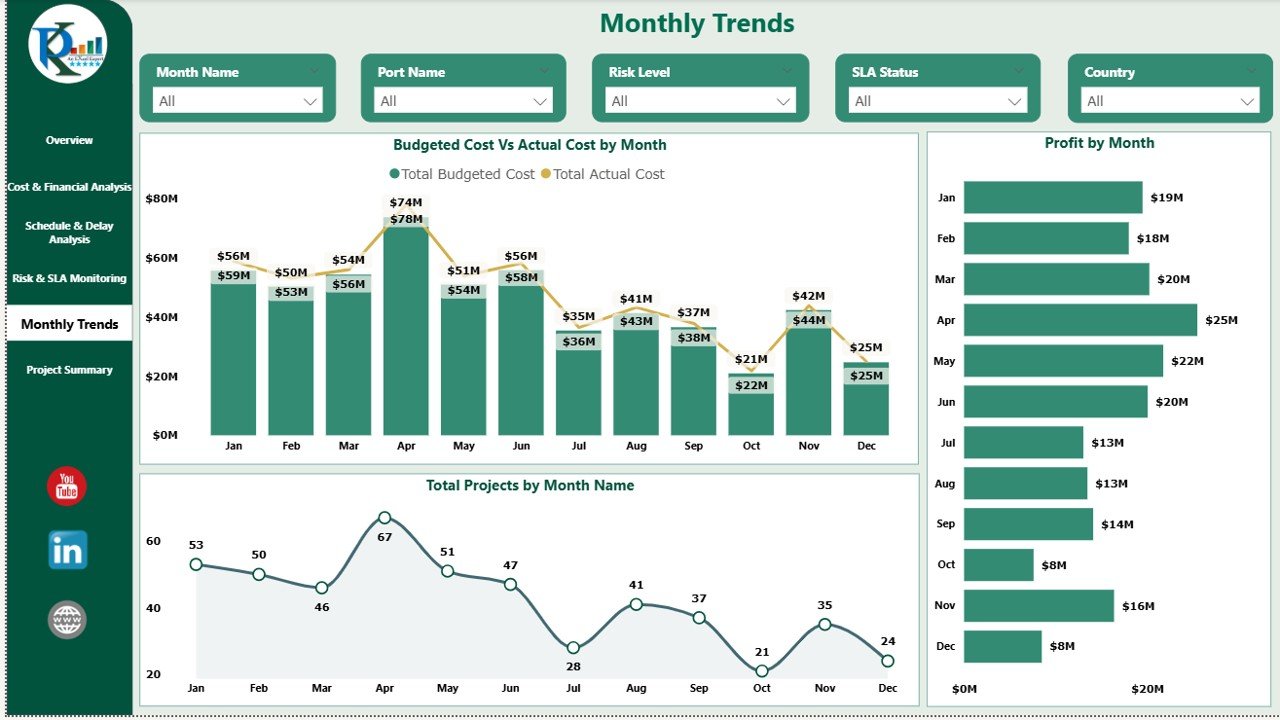
📆 Monthly Trends Analysis
Monthly trend analysis helps organizations understand performance patterns.
Charts Included
Budgeted Cost vs Actual Cost by Month
Total Projects by Month
Profit by Month
These insights support forecasting, budgeting, and resource planning.
🎯 Who Can Use This Dashboard?
⚓ Port Authorities
🏗️ Project & Contract Managers
📊 Finance & Cost Control Teams
🚢 Logistics & Operations Teams
💼 Senior Management & Executives






























Reviews
There are no reviews yet.