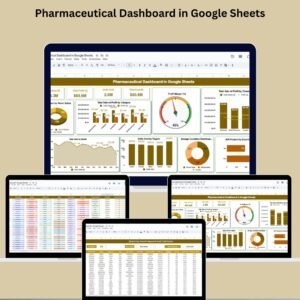
Managing pharmaceutical data has never been easier! The Pharmaceutical Dashboard in Google Sheets is a ready-to-use tool tailored for pharmaceutical businesses, distributors, and analysts to track sales, profit, inventory status, and much more—all from one visual, interactive dashboard. 🚀
Whether you’re running a small pharmacy chain or managing regional distribution across multiple channels, this dashboard helps you stay ahead with real-time insights and zero coding required.

✨ Key Features of the Pharmaceutical Dashboard
📈 Real-Time Metrics at a Glance
Monitor key indicators with KPI cards:
💰 Total Revenue ($)
📊 Total Profit ($)
📦 Units Sold
💸 Total Cost ($)
📉 Profit Margin (%)
These give you an instant understanding of your financial performance.
📊 Dynamic Charts for Deep Analysis
📦 # of Products by Stock Status
🏷️ Total Sales & Profit by Category
🧮 Profit Margin (%) Distribution
🛍️ Total Sales & Profit by Channel
📅 Monthly Sales Trends
🌍 Units Sold by Region
❄️ Storage Condition Breakdown
⏳ Products Expiring Soon
These charts uncover trends and help make data-driven decisions.
🔍 Powerful Search Functionality
Use the Search Sheet Tab to:
Filter by any field (e.g., Category, Stock Status, Region)
Instantly count matched records
Get quick answers without digging through raw data
🧾 Comprehensive Data Entry Sheet
Track it all from the Data Sheet Tab:
Product name, category, dosage form
Sales channel, region, unit price, and cost
Expiry dates and “Expiring Soon” flags
Monthly sales, batch ID, and profit calculations
Your raw data becomes a goldmine when managed correctly!
📦 What’s Inside the Pharmaceutical Dashboard
✅ Dashboard Sheet Tab – KPI cards + 8 interactive charts
🔍 Search Sheet Tab – Fast filtering by keyword and field
📋 Data Sheet Tab – Raw data input structured for analysis
🎯 Auto-calculated totals and profit logic built-in
🛠️ Customizable columns for flexible reporting needs
Everything is designed with clarity, speed, and usability in mind.
🛠️ How to Use the Pharmaceutical Dashboard
Input Data – Enter sales and inventory data in the Data Sheet
Search Data – Use the Search Sheet to filter by any field
View Dashboard – The Dashboard Sheet auto-updates your metrics
Analyze Trends – Use visuals to spot opportunities or issues
Share & Collaborate – Invite your team with Google Sheets sharing
No complex software. No expensive setup. Just powerful insights in minutes.
👩⚕️ Who Can Benefit from This Dashboard?
🧪 Pharmaceutical Manufacturers
💊 Retail Pharmacies & Chain Owners
📦 Wholesalers & Distributors
🧮 Sales Analysts & Inventory Managers
🧑⚕️ Healthcare Product Teams
📈 Medical Supply Chain Managers
🔍 Pharma Research & Marketing Analysts
If you’re handling pharma data—this tool is made for you!