

Business growth never happens by accident. It comes from consistent tracking, smart analysis, and timely decisions. However, many businesses still depend on scattered spreadsheets, delayed reports, and manual calculations. As a result, leaders struggle to understand what truly drives revenue, profit, and scalability.
That is where the Business Growth Dashboard in Google Sheets becomes a powerful game-changer.
This ready-to-use dashboard converts raw business data into clear KPIs, visual insights, and interactive trends. Instead of switching between multiple files, you get a single, centralized dashboard to monitor revenue, costs, profit, units sold, sales channels, customer behavior, and growth patterns—all in real time.
Because it is built in Google Sheets, the dashboard is cloud-based, collaborative, cost-effective, and easy to customize, without requiring any advanced BI tools or technical expertise.
📊 Key Features of the Business Growth Dashboard
🚀 All-in-One Growth Monitoring
Track revenue, profit, costs, and volume from a single dashboard.
📍 Multi-Dimensional Analysis
Analyze performance by region, category, sales channel, customer type, and time.
📈 Trend-Based Insights
Identify monthly growth patterns, seasonality, and emerging risks early.
🎯 Decision-Ready KPIs
Focus on profit drivers instead of just topline revenue.
🤝 Real-Time Collaboration
Share insights instantly with leadership and teams using Google Sheets.
📦 What’s Inside the Business Growth Dashboard
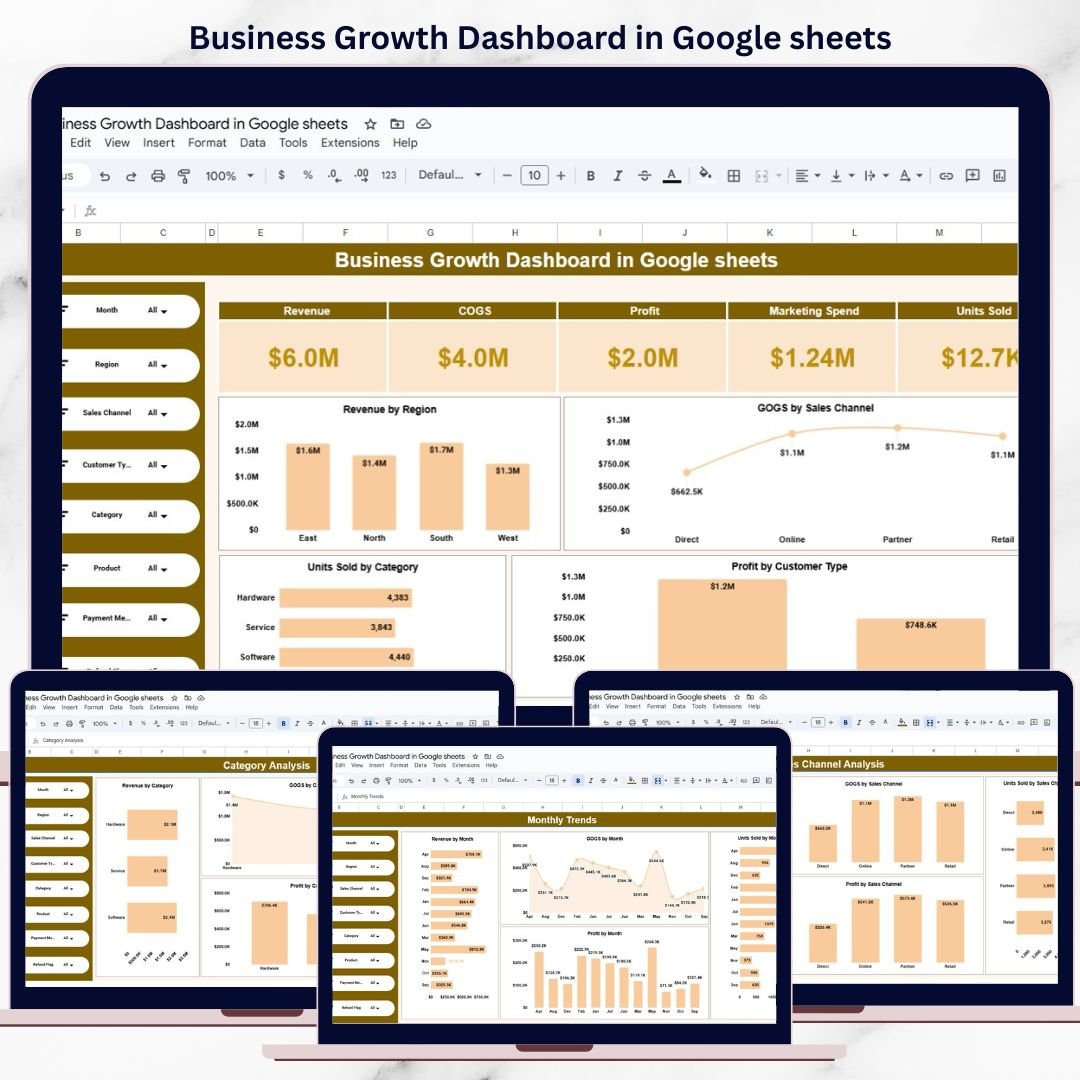
🧭 Overview Sheet – Growth Control Center
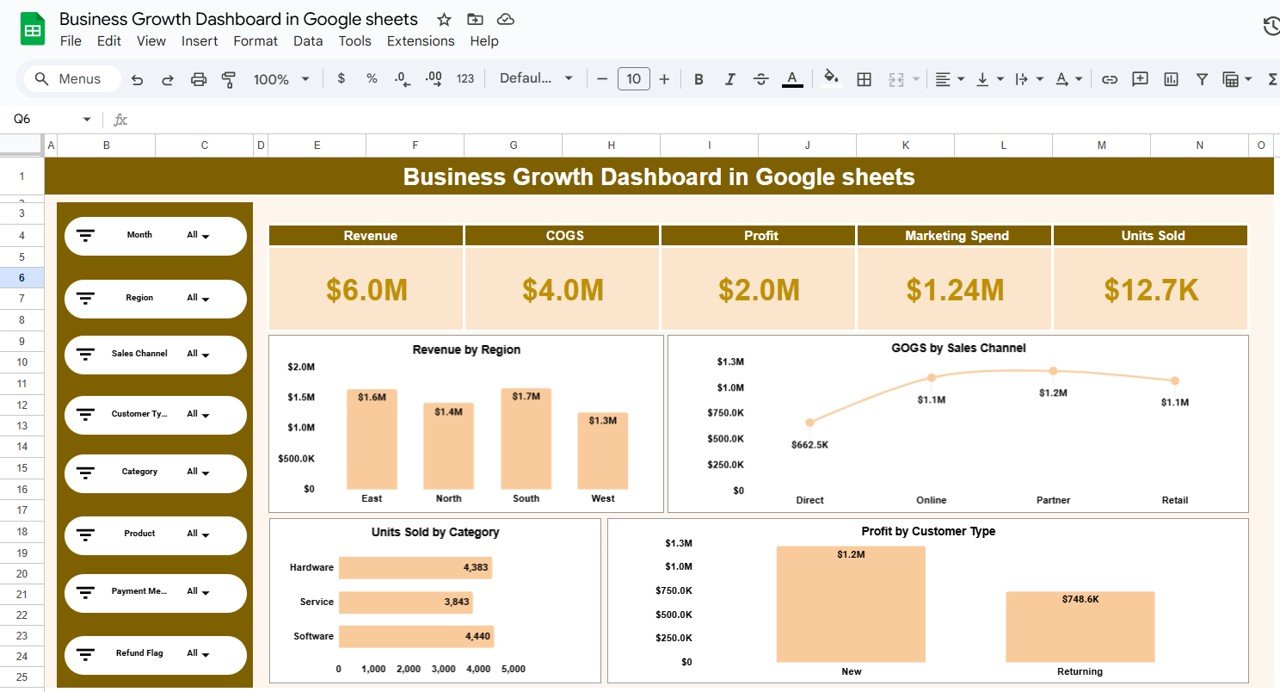
The Overview Sheet gives a snapshot of overall business performance.
KPI Cards Display:
Revenue
COGS (Cost of Goods Sold)
Profit
Marketing Spend
Units Sold
All KPIs update automatically using filters.
Key Charts Include:
📍 Revenue by Region
🛒 COGS by Sales Channel
📦 Units Sold by Category
👥 Profit by Customer Type
Advanced filters allow analysis by:
Month, Region, Sales Channel, Customer Type, Category, Product, Payment Method, and Refund Flag.
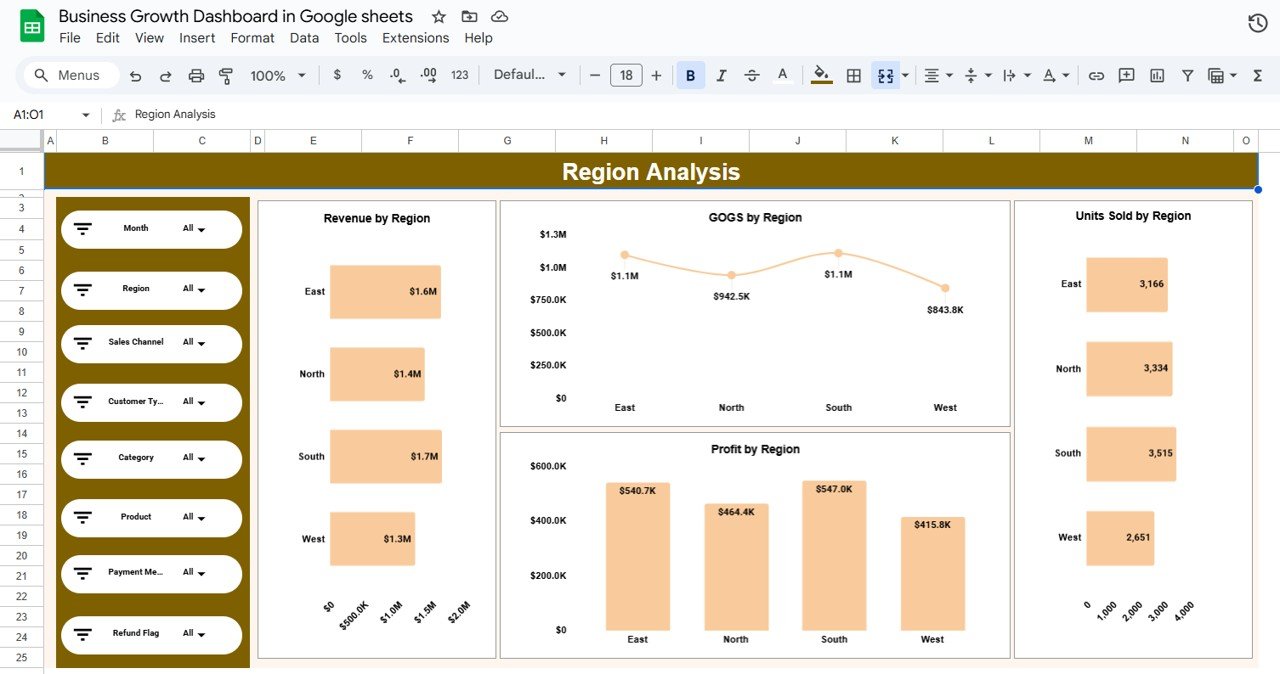
🌍 Region Analysis – Geographic Performance
This sheet helps compare performance across regions.
Charts Included:
Revenue by Region
COGS by Region
Profit by Region
Units Sold by Region
This analysis supports market expansion planning and cost optimization.
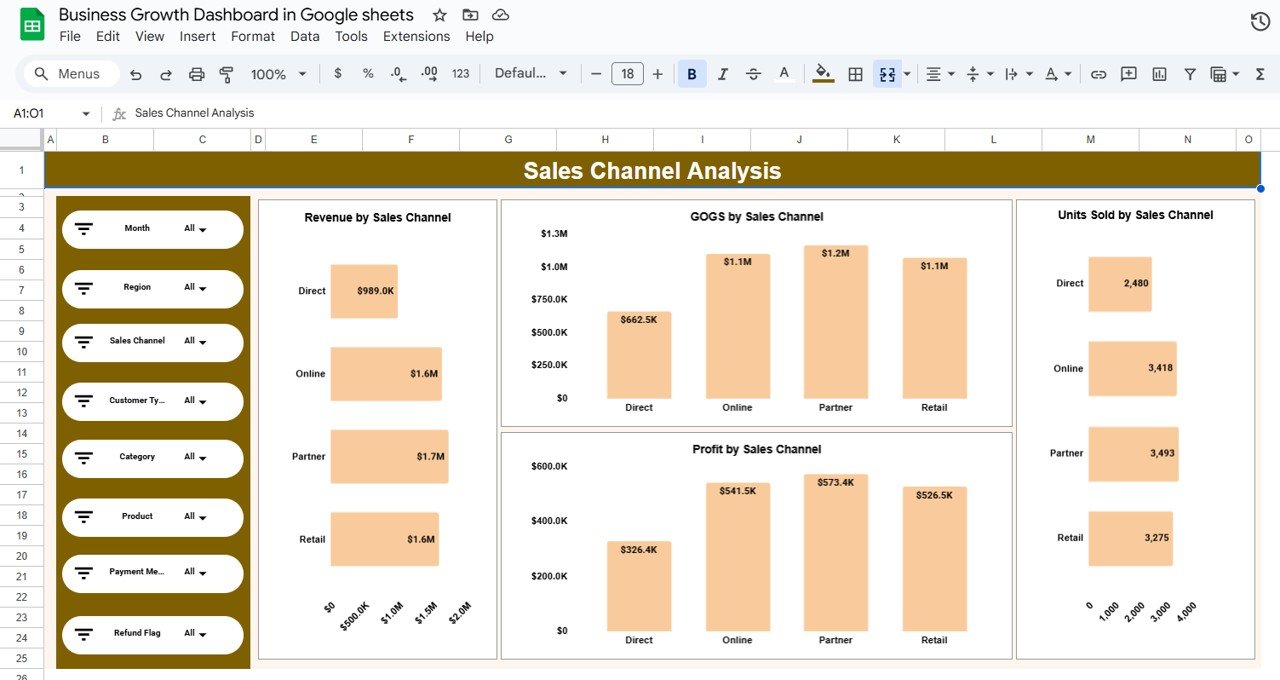
🛍️ Sales Channel Analysis – Channel Profitability
Understand which channels actually drive growth.
Charts Included:
Revenue by Sales Channel
COGS by Sales Channel
Profit by Sales Channel
Units Sold by Sales Channel
This sheet helps identify high-margin and low-efficiency channels.
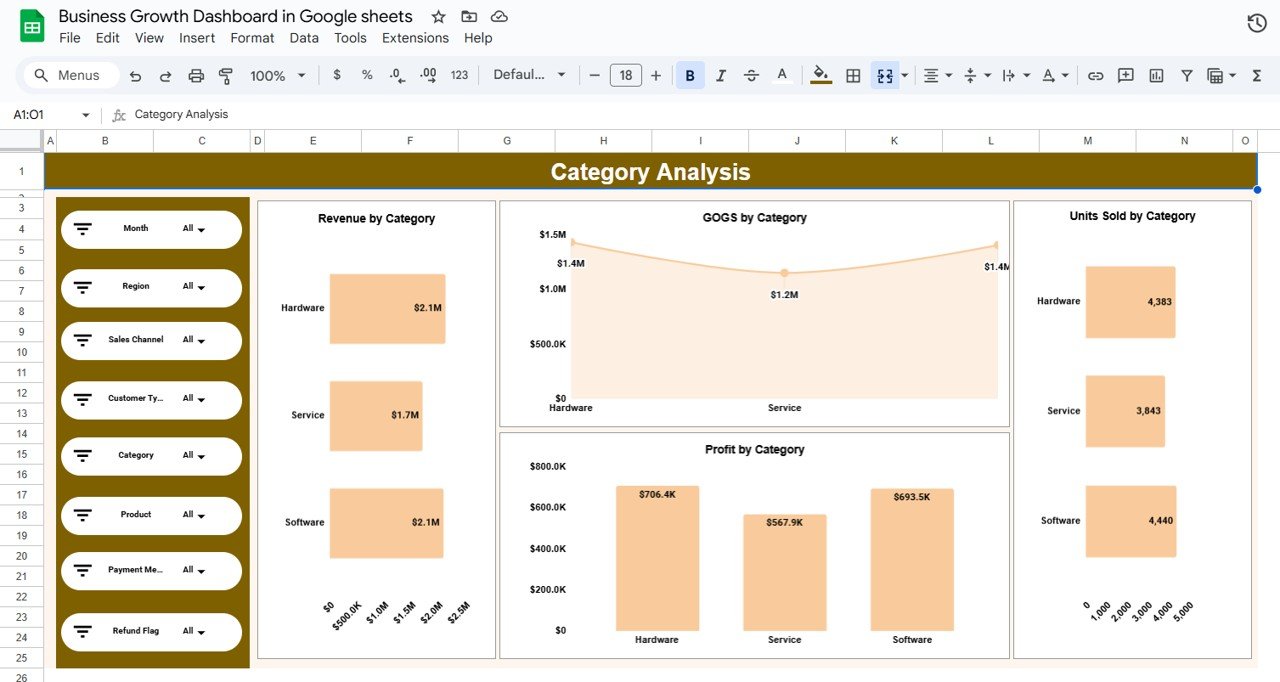
🧩 Category Analysis – Product & Service Insights
Analyze performance by product or service category.
Charts Included:
Revenue by Category
COGS by Category
Profit by Category
Units Sold by Category
Perfect for product mix optimization and portfolio decisions.
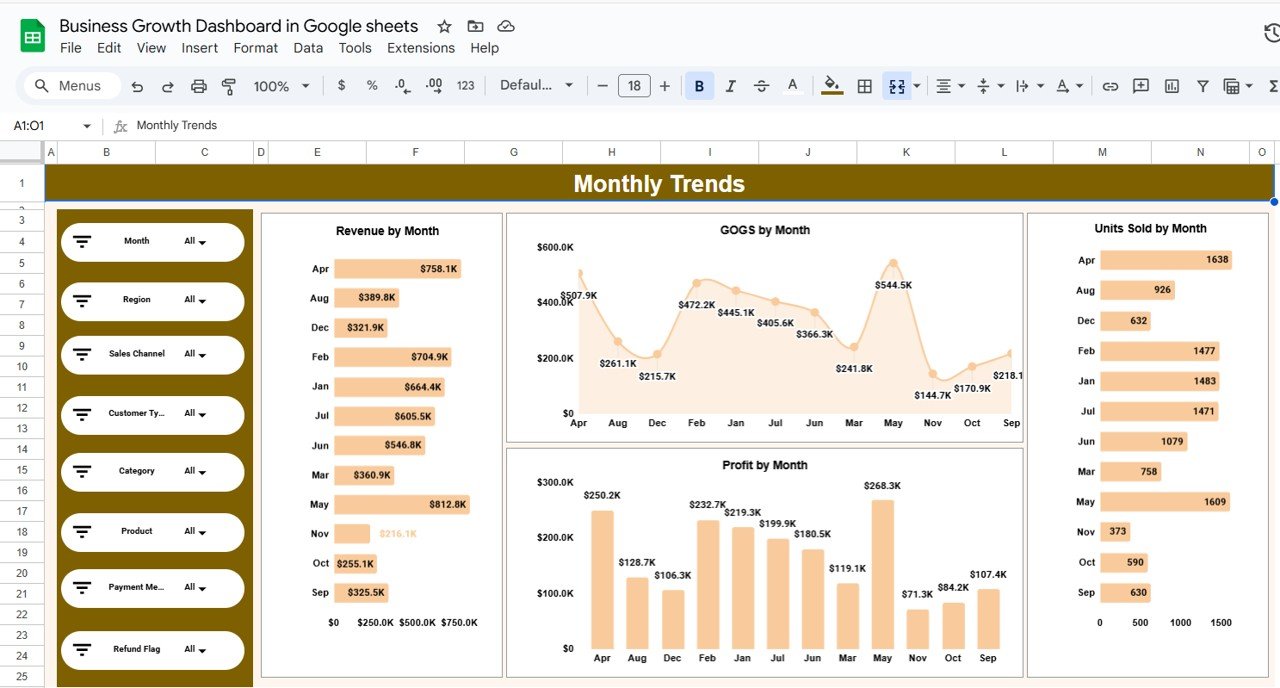
📅 Monthly Trends – Growth Over Time
Track performance trends month by month.
Trend Charts Include:
Revenue by Month
COGS by Month
Profit by Month
Units Sold by Month
This view helps detect seasonality, growth acceleration, or early slowdowns.
👥 Who Can Benefit from This Dashboard
Business owners & founders
Startups & growing companies
Finance & operations teams
Sales & marketing managers
Business analysts & consultants
⚙️ How to Use the Business Growth Dashboard
Paste or connect your business data
Use filters to slice performance instantly
Review profit trends, not just revenue
Identify growth drivers and bottlenecks
Share insights with stakeholders
No advanced skills required—100% beginner-friendly.
### Click here to read the Detailed blog post
Watch the step-by-step video tutorial:































Reviews
There are no reviews yet.