

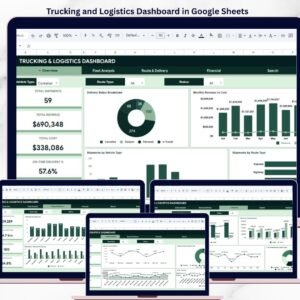
Transportation Operations Dashboard in Google Sheets is a ready-to-use reporting template for logistics teams, dispatch managers, fleet coordinators, and transportation business owners who want clear visibility into shipment volume, delivery performance, route activity, driver output, operating cost, and revenue performance.
This Google Sheets dashboard helps you monitor transportation operations from one organized workbook. Instead of switching between raw shipment logs and separate reports, you can review high-level KPIs, fleet performance, route trends, financial outcomes, shipment lookup details, and the source data structure in a connected dashboard format.
Transportation Operations Dashboard Features
- Built in Google Sheets for easy access, sharing, and editing.
- Six organized tabs: Overview, Fleet Analysis, Route & Delivery, Financial, Search, and Data.
- Interactive slicers for fast filtering by vehicle type, route type, and delivery status.
- Transportation KPI cards for shipments, revenue, cost, on-time delivery, distance, delivery time, and profit.
- Visual charts for monthly trends, vehicle performance, route activity, destination analysis, and cost breakdowns.
- Shipment lookup page for instantly reviewing a single shipment record by Shipment ID.
- Structured data sheet so you can replace the sample records with your own transportation data.
Dashboard Pages Included
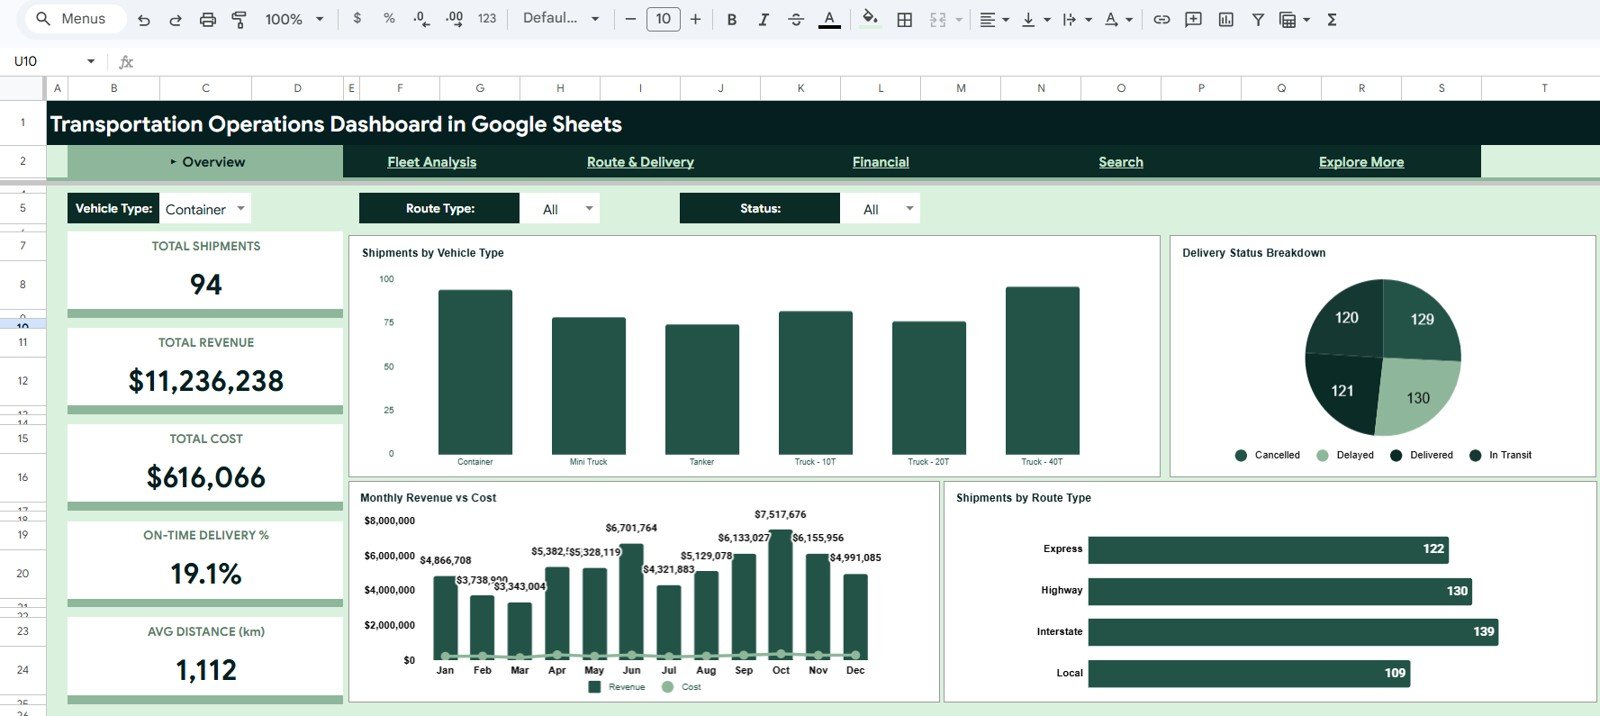
1. Overview Page
The Overview page gives a quick executive view of transportation performance. It includes KPI cards for Total Shipments, Total Revenue, Total Cost, On-Time Delivery %, and Avg Distance (km).
The page also includes charts for Shipments by Vehicle Type, Delivery Status Breakdown, Monthly Revenue vs Cost, and Shipments by Route Type. These visuals make it easier to compare shipment volume, revenue movement, cost patterns, and operational mix at a glance.
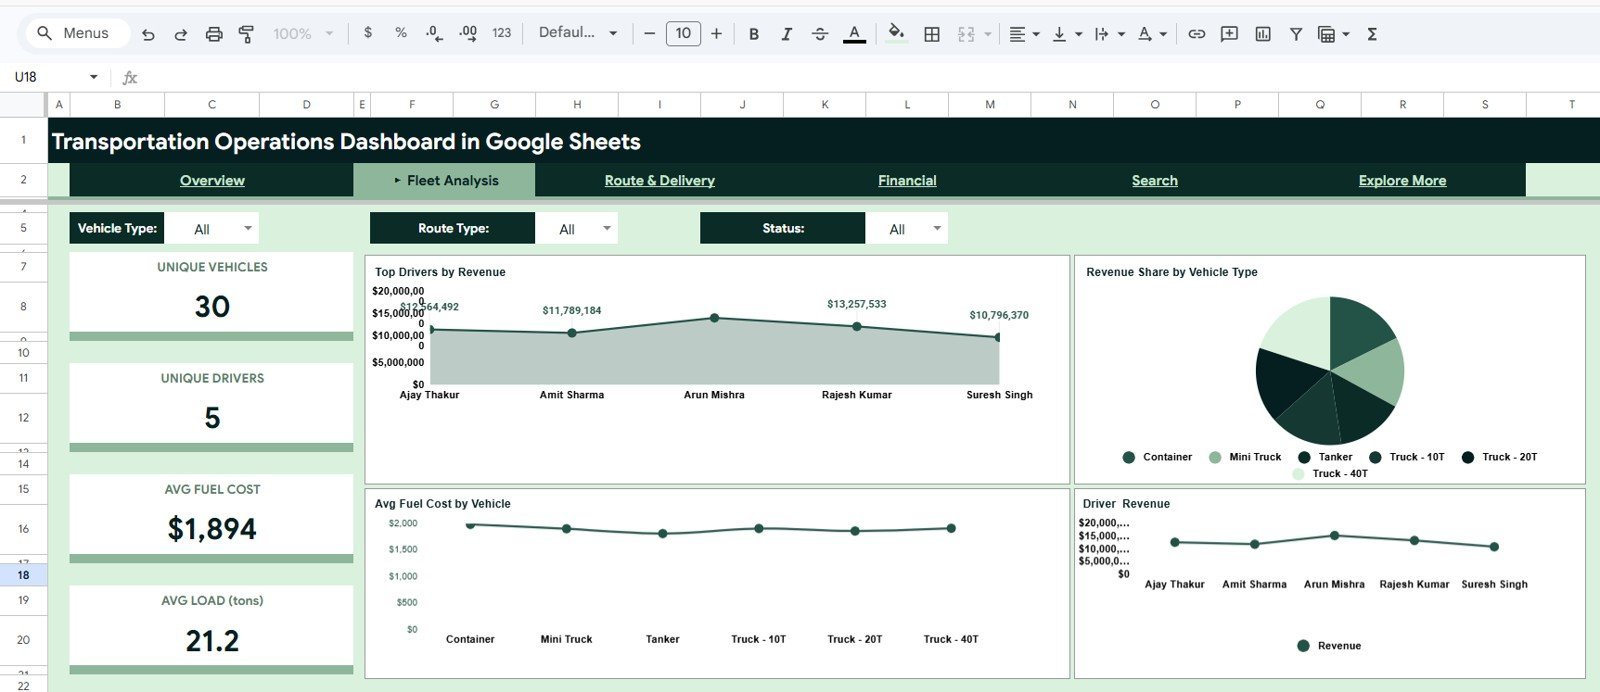
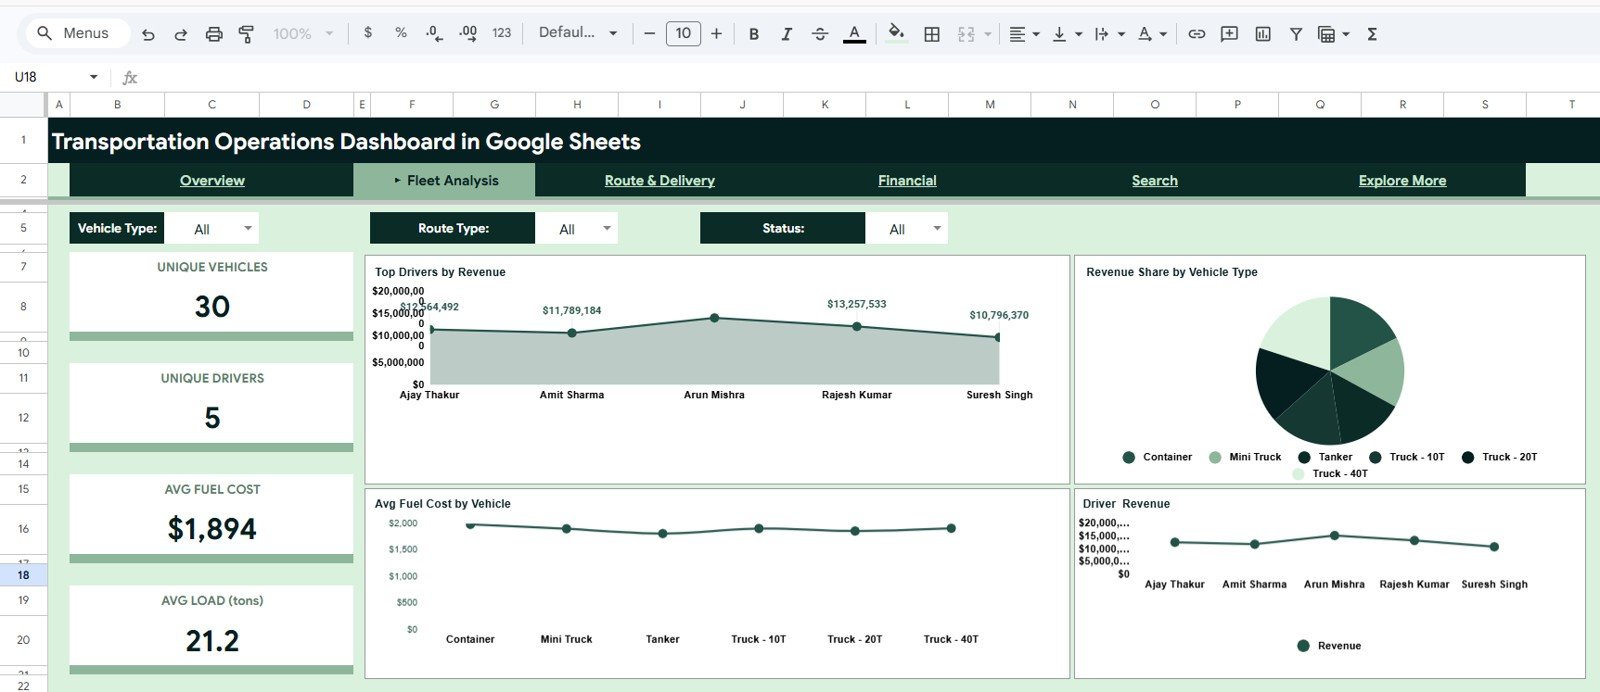
2. Fleet Analysis Page
The Fleet Analysis page focuses on vehicle and driver performance. It tracks Unique Vehicles, Unique Drivers, Avg Fuel Cost, and Avg Load (tons), helping managers understand how fleet resources are being used.
Charts such as Top Drivers by Revenue, Revenue Share by Vehicle Type, Avg Fuel Cost by Vehicle, and Driver Revenue help identify high-performing drivers, profitable vehicle categories, and cost-heavy fleet assets.
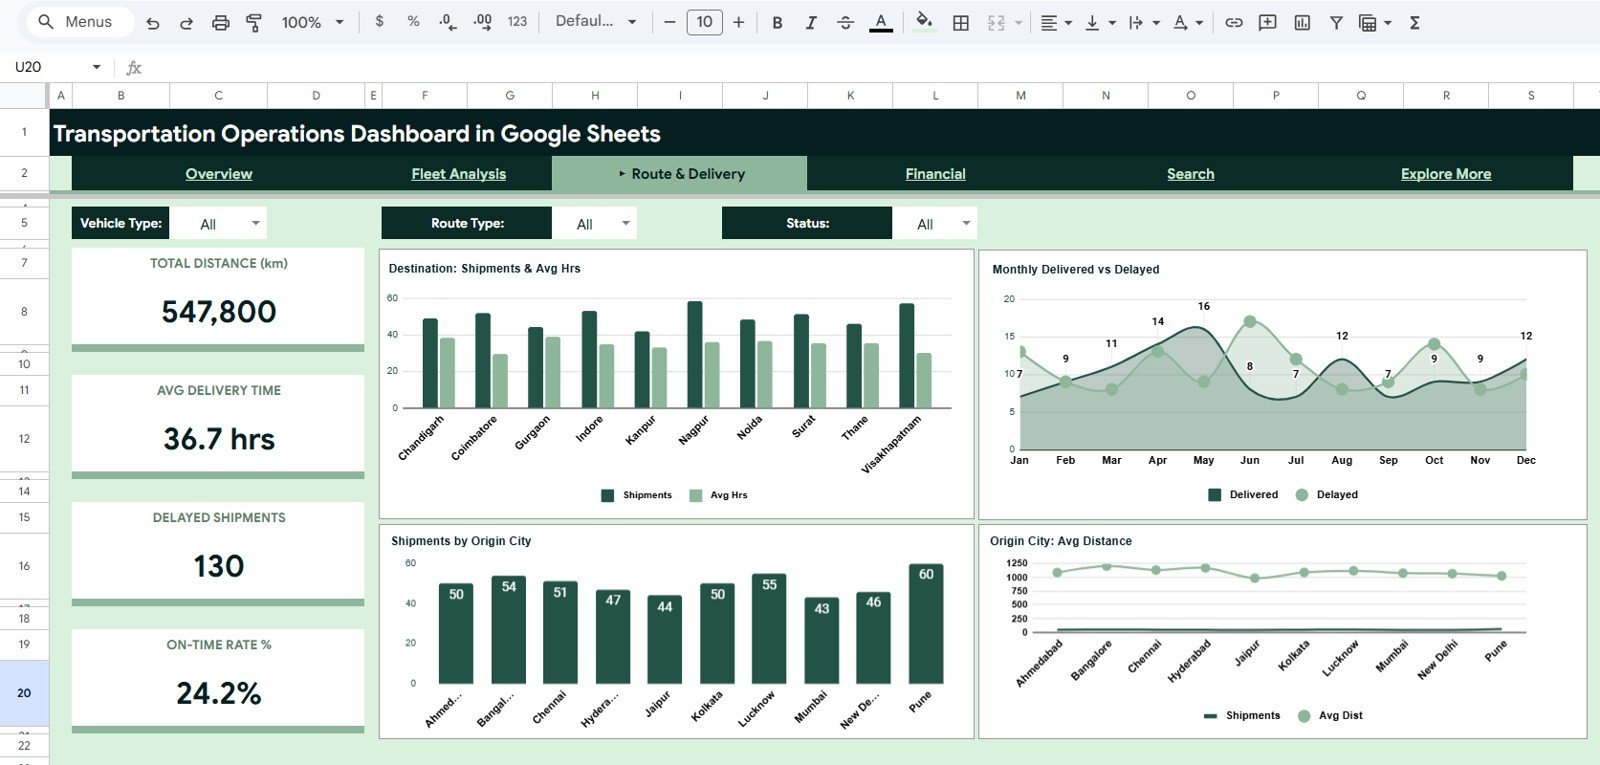
3. Route & Delivery Page
The Route & Delivery page helps you analyze distance, delivery time, delayed shipments, and on-time performance. KPI cards show Total Distance (km), Avg Delivery Time, Delayed Shipments, and On-Time Rate %.
The included charts compare destination shipment activity, monthly delivered versus delayed shipments, shipments by origin city, and average distance by origin city. This makes the tab useful for spotting route bottlenecks and location-based delivery patterns.

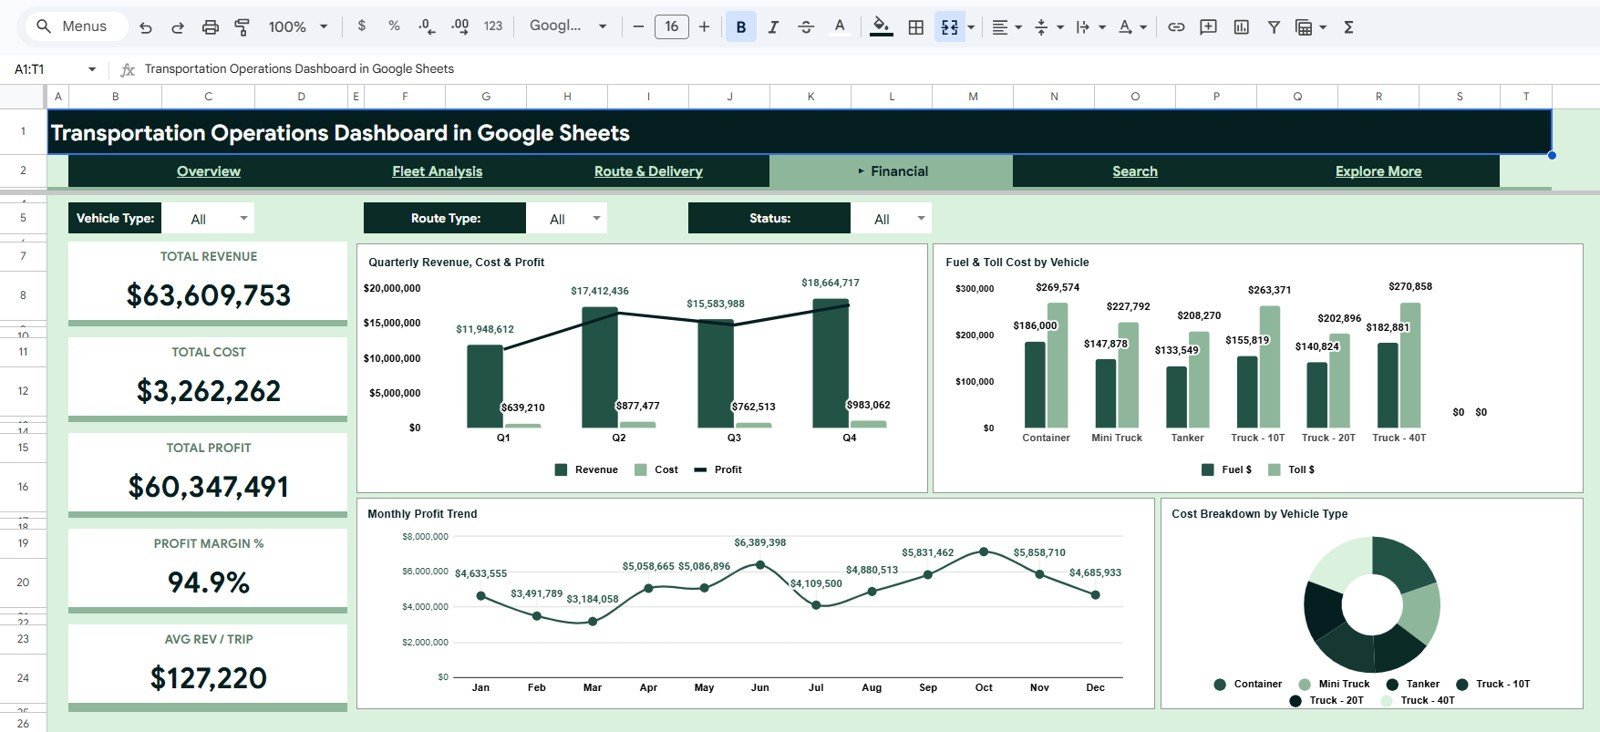
4. Financial Page
The Financial page turns shipment records into revenue, cost, and profit insights. It includes cards for Total Revenue, Total Cost, Total Profit, Profit Margin %, and Avg Revenue per Trip.
Charts for Quarterly Revenue, Cost & Profit, Fuel & Toll Cost by Vehicle, Monthly Profit Trend, and Cost Breakdown by Vehicle Type help teams track operating profitability and review where transportation costs are concentrated.

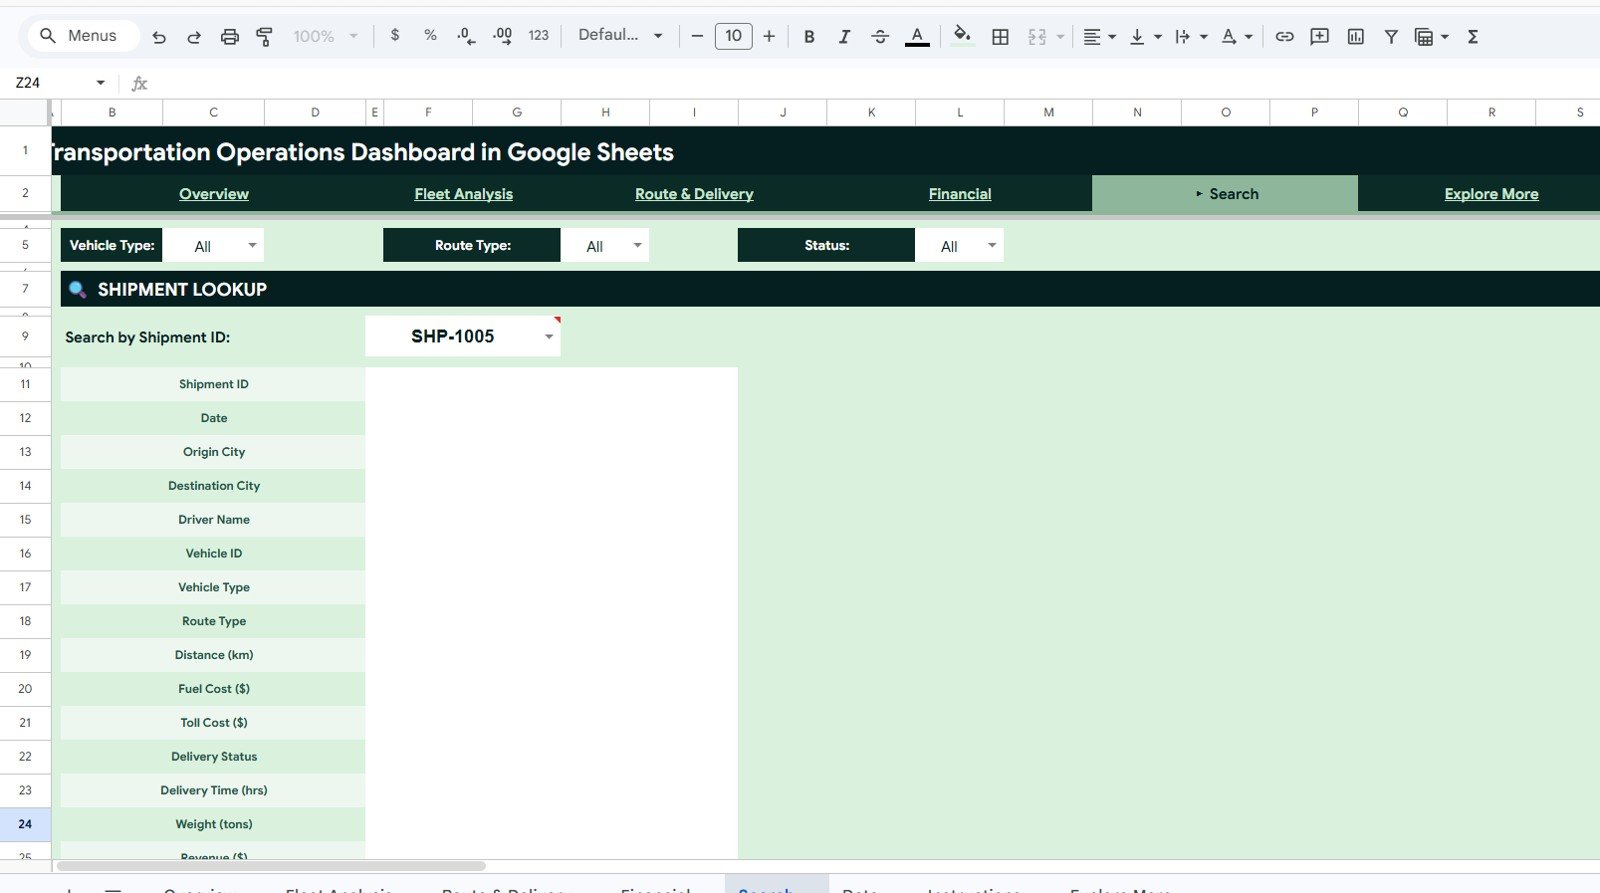
5. Search Sheet Tab
The Search sheet provides a simple shipment lookup experience. Enter a Shipment ID and the template displays the matching details in a clean record view.
The lookup fields include Shipment ID, Date, Origin City, Destination City, Driver Name, Vehicle ID, Vehicle Type, Route Type, Distance (km), Fuel Cost, Toll Cost, Delivery Status, Delivery Time, Weight, Revenue, Cost, Month, Quarter, and Customer Type.
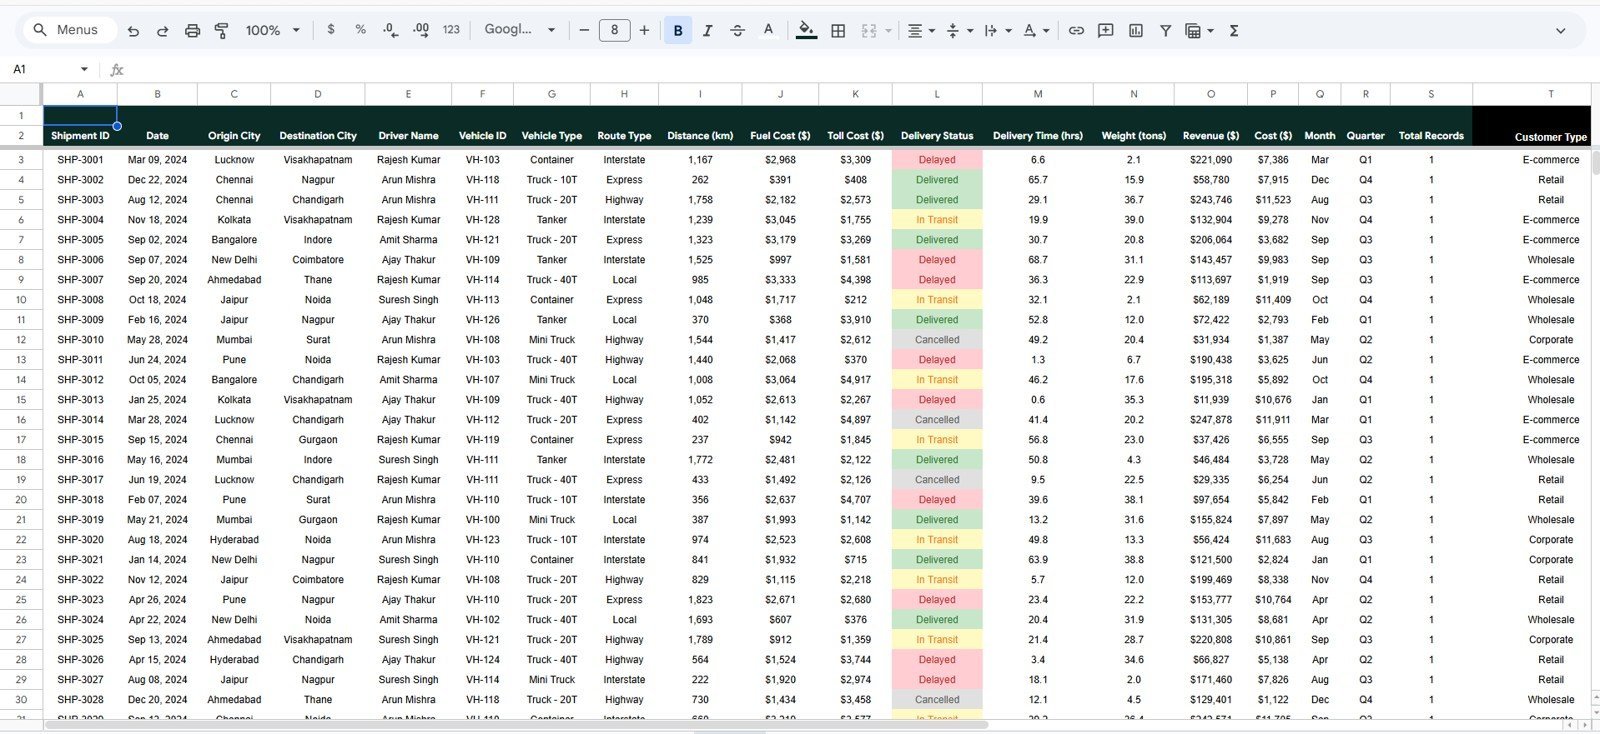
6. Data Sheet Tab
The Data sheet is where your transportation records are stored. You can replace the sample records with your own shipment data while keeping the same column format for dashboard calculations and charts.
Typical fields include Shipment ID, Date, Origin City, Destination City, Driver Name, Vehicle ID, Vehicle Type, Route Type, Distance, Fuel Cost, Toll Cost, Delivery Status, Delivery Time, Weight, Revenue, Cost, Month, Quarter, Total Records, and Customer Type.

Who Can Use This Transportation Dashboard?
- Logistics managers tracking shipment performance and delivery status.
- Fleet managers reviewing vehicle cost, fuel cost, and driver revenue.
- Transportation business owners monitoring revenue, cost, and profit.
- Dispatch teams checking route activity and shipment movement.
- Operations analysts building recurring transportation reports in Google Sheets.
- Consultants preparing transportation KPI reports for clients.
What You Can Analyze
- Monthly revenue and operating cost movement.
- Shipment volume by vehicle type and route type.
- Delivery status performance and delayed shipment count.
- Driver revenue contribution and fleet utilization indicators.
- Origin and destination shipment patterns.
- Fuel cost, toll cost, total cost, and profit margin.
- Individual shipment details through the search tab.
Why Use a Google Sheets Transportation Dashboard?
Google Sheets is a practical choice for transportation reporting because teams can access the same workbook from different locations, collaborate online, and update records without expensive business intelligence software. This template gives you a structured starting point for shipment analysis while still allowing customization for your own routes, vehicles, drivers, and reporting needs.
Included Template Structure
| Tab | Purpose |
|---|---|
| Overview | High-level transportation KPIs and summary charts. |
| Fleet Analysis | Vehicle, driver, fuel cost, load, and fleet performance analysis. |
| Route & Delivery | Distance, delivery time, delayed shipment, origin, and destination insights. |
| Financial | Revenue, cost, profit, margin, fuel, toll, and vehicle cost analytics. |
| Search | Shipment lookup by Shipment ID. |
| Data | Source data table for shipment records. |
Frequently Asked Questions
Is this dashboard built in Google Sheets?
Yes. This is a Google Sheets dashboard template designed for transportation operations reporting.
Can I replace the sample data with my own shipment data?
Yes. Use the Data sheet tab to add your shipment records in the same column format so the dashboard pages can update correctly.
Does the dashboard include slicers?
Yes. The dashboard includes slicers so you can quickly filter views by selected transportation fields such as vehicle type, route type, and status.
What kind of transportation KPIs are included?
The dashboard includes KPIs for shipments, revenue, cost, profit, delivery performance, distance, driver performance, fuel cost, route performance, and shipment lookup details.
Can this template be customized?
Yes. Since it is built in Google Sheets, you can customize headings, colors, formulas, records, and chart labels based on your business process.
Watch the step-by-step video tutorial:
Last updated: May 2026


Reviews
There are no reviews yet.