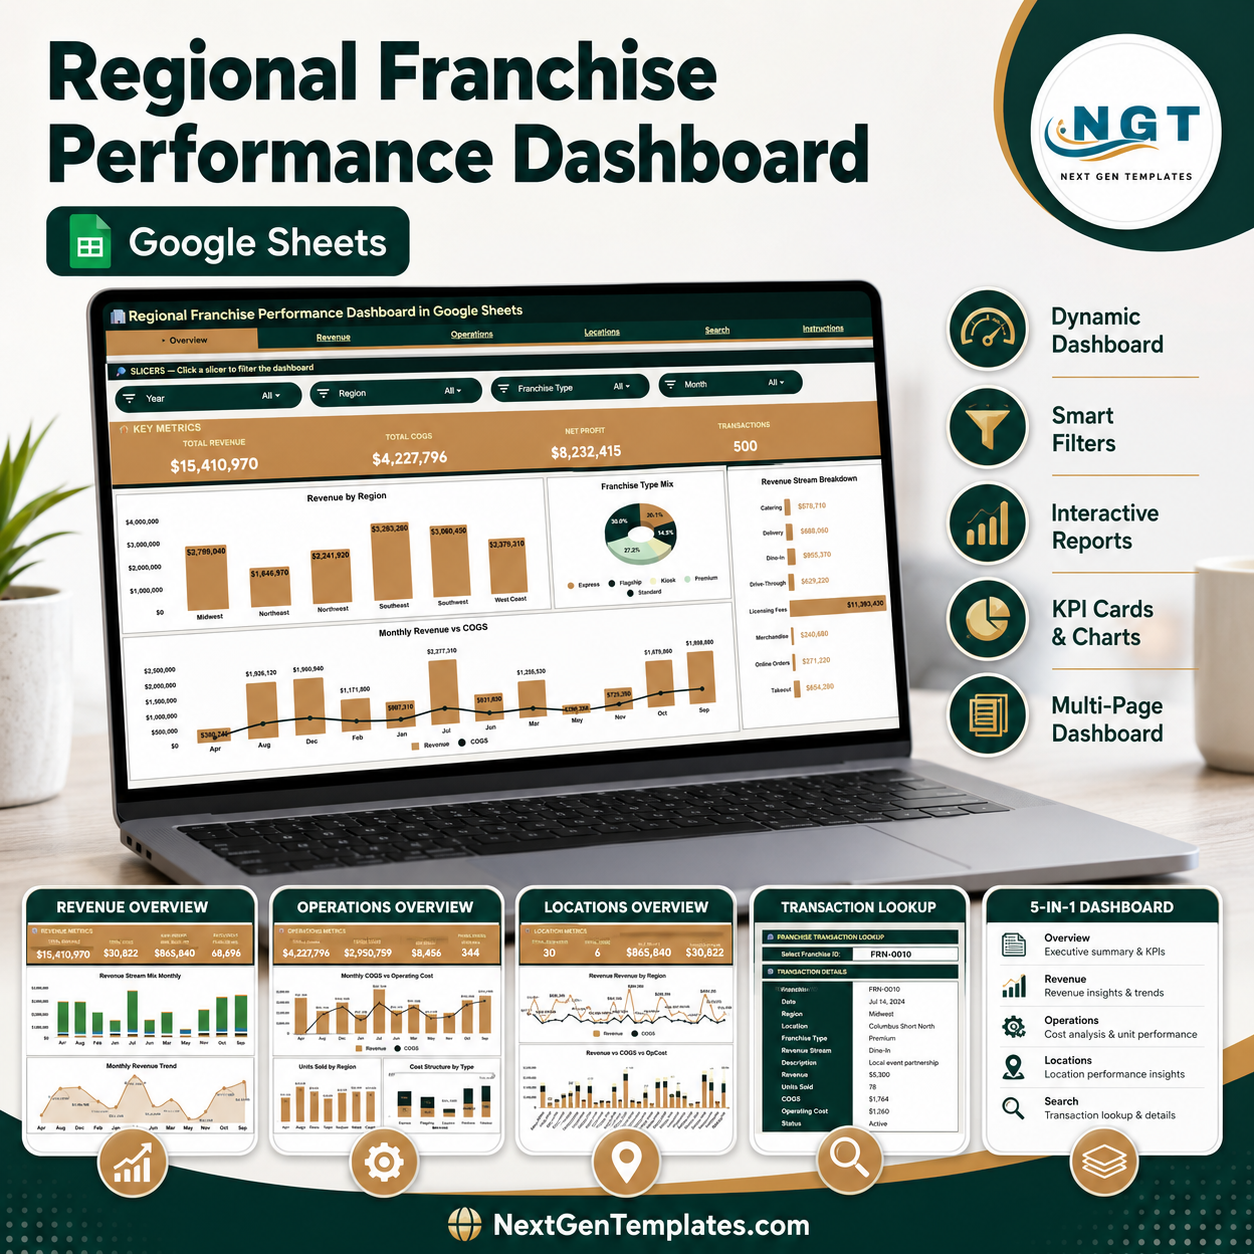

The Regional Franchise Performance Dashboard in Google Sheets tracks 4 headline KPIs — Total Revenue, Total COGS, Net Profit, and Transactions — across 5 interactive pages with 14 pre-built charts and multiple slicers for instant filtering by region, franchise type, and revenue stream. Setup takes under 10 minutes — make a copy, paste your franchise transaction data into the Data sheet, and every chart, card, and lookup updates automatically.
🌍 Join 8,400+ teams in 40+ countries using NextGenTemplates to replace paid SaaS tools with one-time-purchase Excel, Google Sheets, Power BI, and HTML templates.
✅ Instant download · One-time payment · No subscription · No per-user fees · Lifetime access
If you run a multi-location franchise network, this Regional Franchise Performance Dashboard in Google Sheets gives every franchisee, regional manager, and head-office analyst a single shared view of revenue, cost, and profit — without paying per-user fees for a heavy BI platform. Because it lives in Google Sheets, your whole team can open it in any browser, on any device, and collaborate in real time.
🔑 Key Features of the Regional Franchise Performance Dashboard in Google Sheets
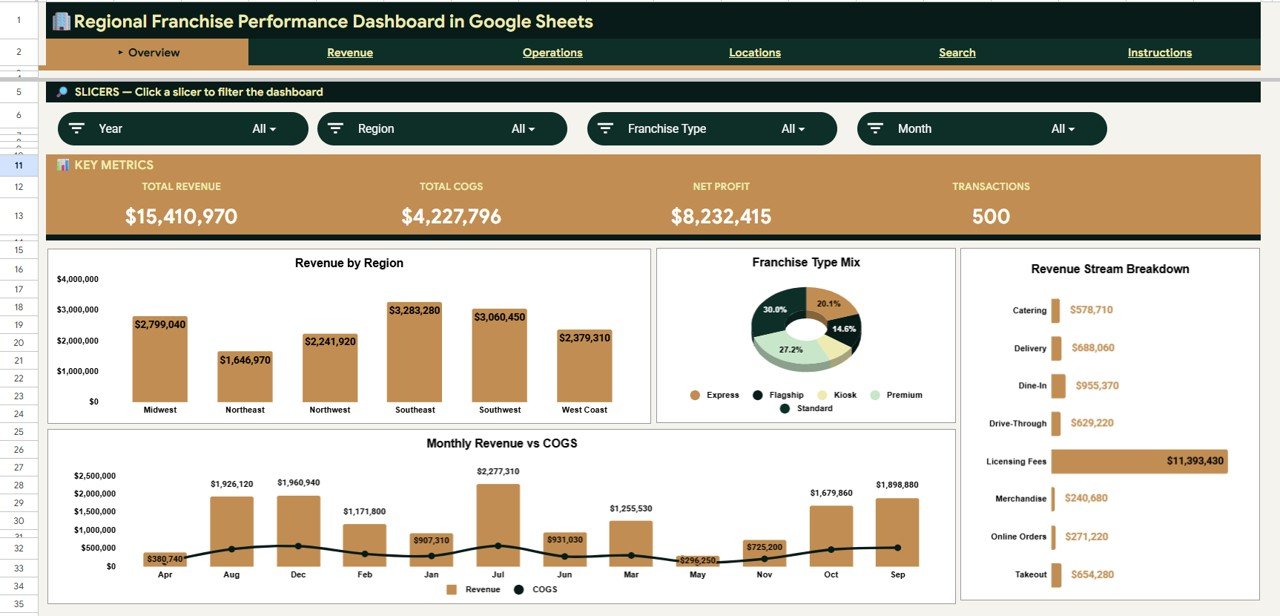
📊 Four headline KPI cards sit at the top of the Overview page — Total Revenue, Total COGS, Net Profit, and Transactions — so leadership sees network-wide financial health the moment the file opens, with every figure recalculating as new transactions are added.
🔎 Native slicers on every analysis page let you filter the entire dashboard by Region, Franchise Type, and Revenue Stream in a single click. The charts, cards, and tables all respond together, so you can isolate one region or one revenue stream in seconds.
📈 14 pre-built charts across 4 analysis pages cover revenue mix, monthly trends, cost structure, location comparisons, and franchise status — built on native Google Sheets pivot tables and chart ranges that auto-expand as your data grows.
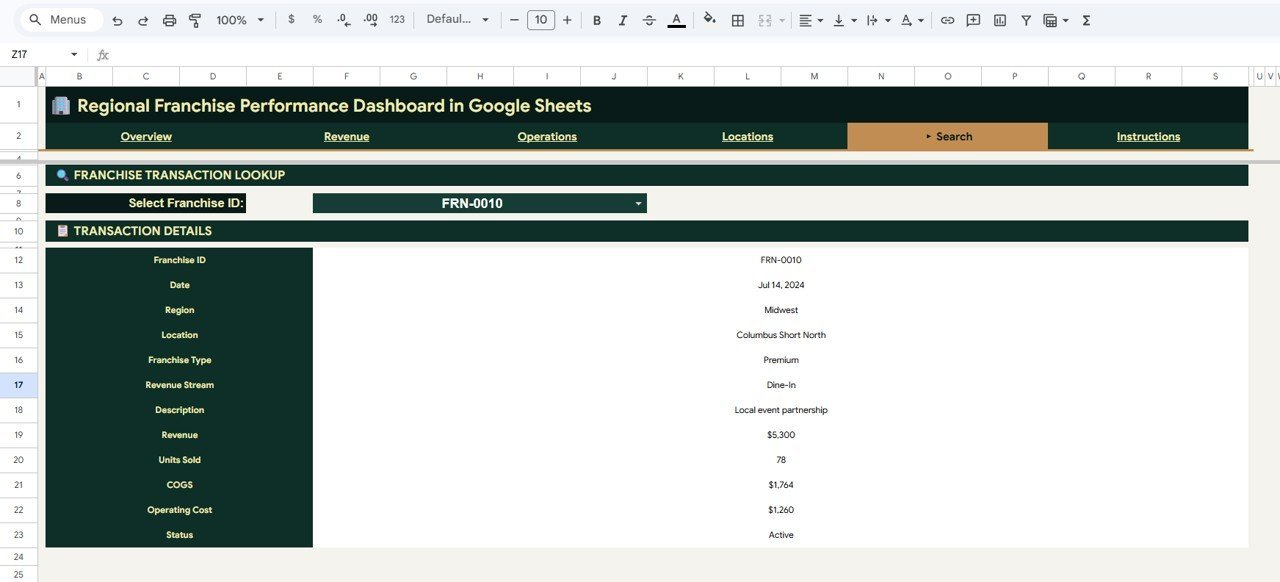
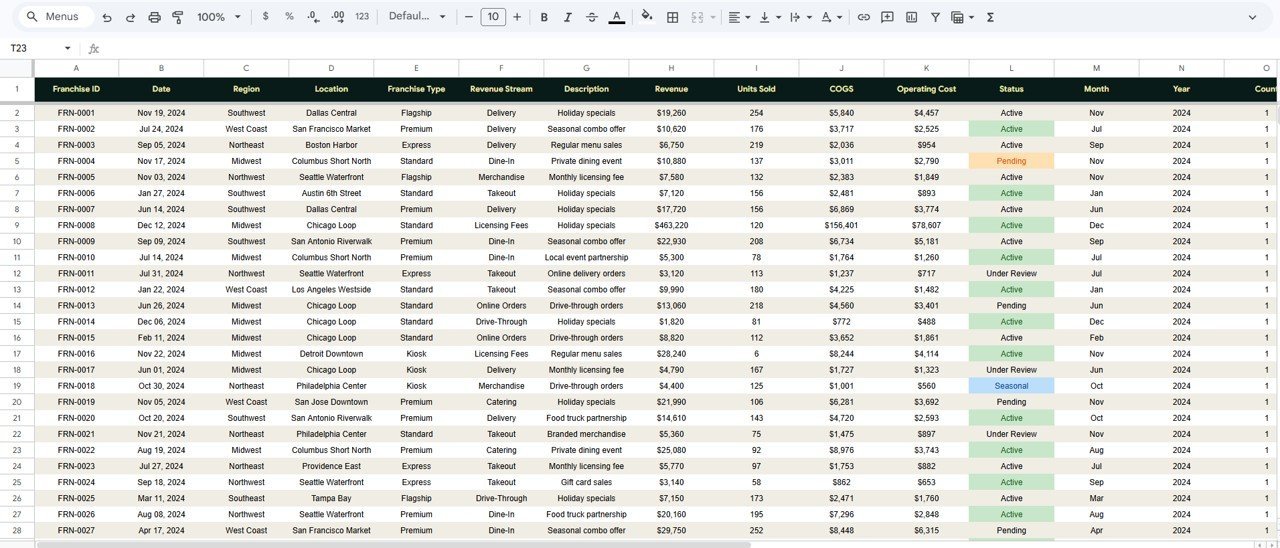
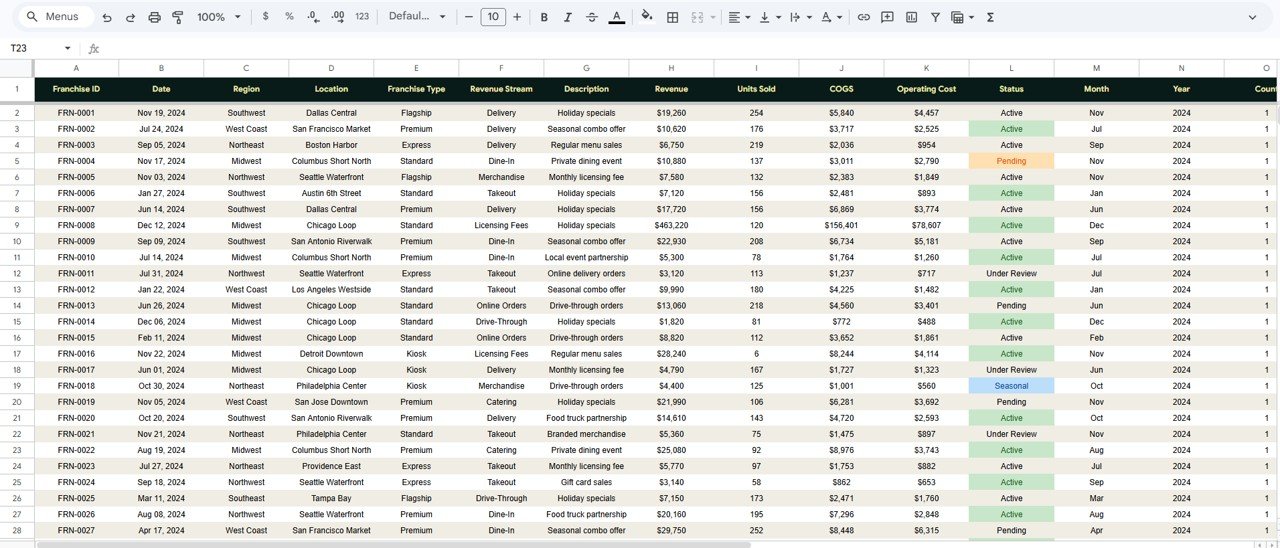
🔁 A Franchise Transaction Lookup tool on the Search sheet returns the complete record for any Franchise ID — date, region, location, franchise type, revenue stream, description, revenue, units sold, COGS, operating cost, and status — from a single dropdown.
🗂️ A structured Data sheet defines the exact column format your transactions must follow. Paste rows in the same layout and the entire dashboard updates with no formula edits required.
📦 What’s Inside the Regional Franchise Performance Dashboard in Google Sheets
This Google Sheets franchise dashboard is organized into six tabs — an Overview page, three deep-dive analysis pages, a Search sheet, and a Data sheet. Here is what each tab delivers.
Page 1: Overview
The Overview page opens with four KPI cards — Total Revenue, Total COGS, Net Profit, and Transactions — plus slicers to filter the whole view instantly. Charts include Revenue by Region (compares network revenue across each geographic region), Revenue by Franchise Type (shows which franchise formats earn the most), Revenue by Revenue Stream (breaks income down by stream such as product, service, or fees), and Monthly Revenue vs COGS (tracks income against cost of goods month over month).
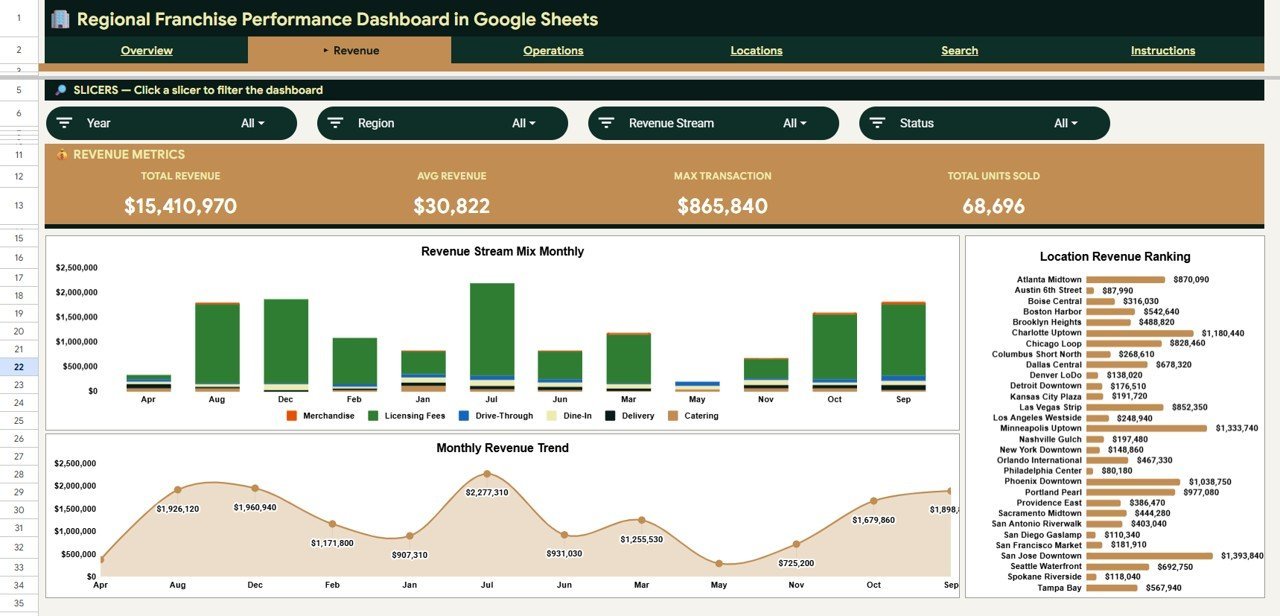
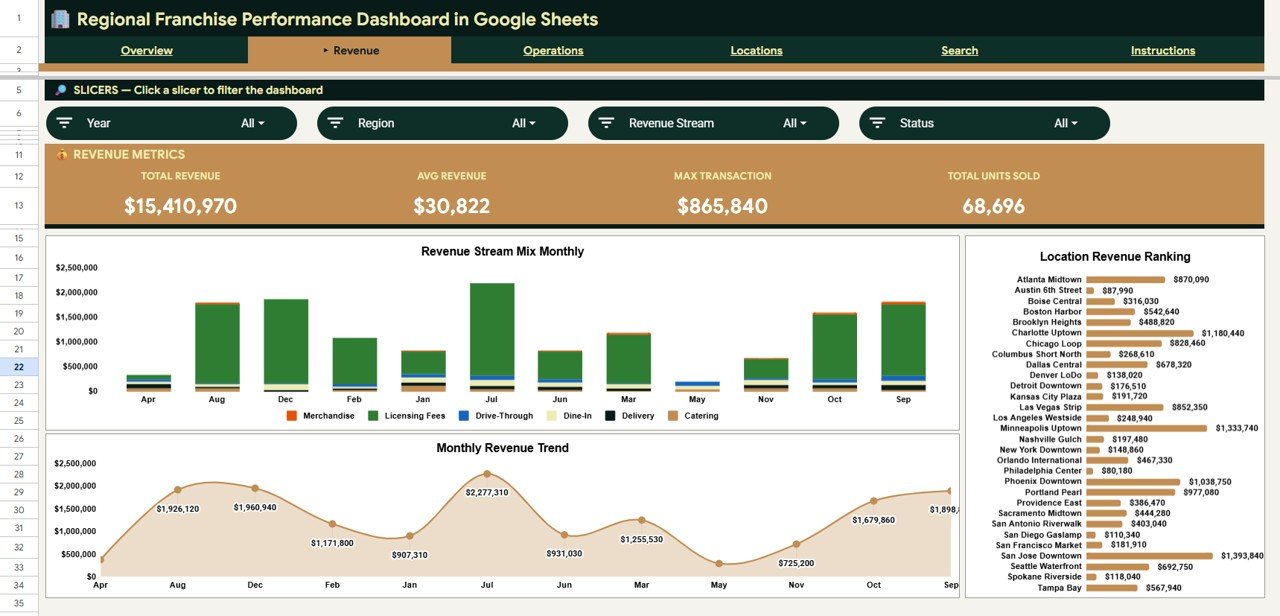
Page 2: Revenue
The Revenue page drills into where your income comes from and how it moves over time. Charts include Revenue Stream Mix by Month (shows how each stream contributes across the year), Monthly Revenue Trend (tracks total revenue month by month to spot seasonality), and Revenue by Location (ranks every franchise location by revenue generated).
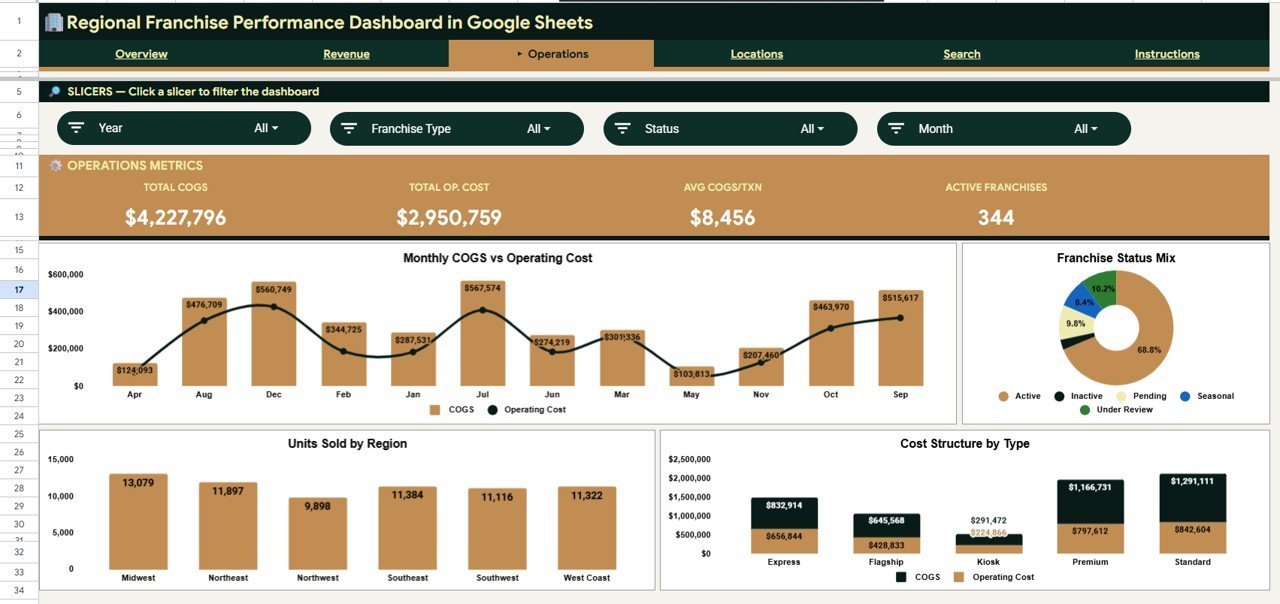
Page 3: Operations
The Operations page focuses on cost control and network status. Charts include Monthly COGS vs Operating Cost (compares the two main cost lines each month), Franchises by Status (shows how many locations are active, pending, or closed), Units Sold by Region (compares sales volume across regions), and Cost Structure by Franchise Type (reveals which formats run leanest).

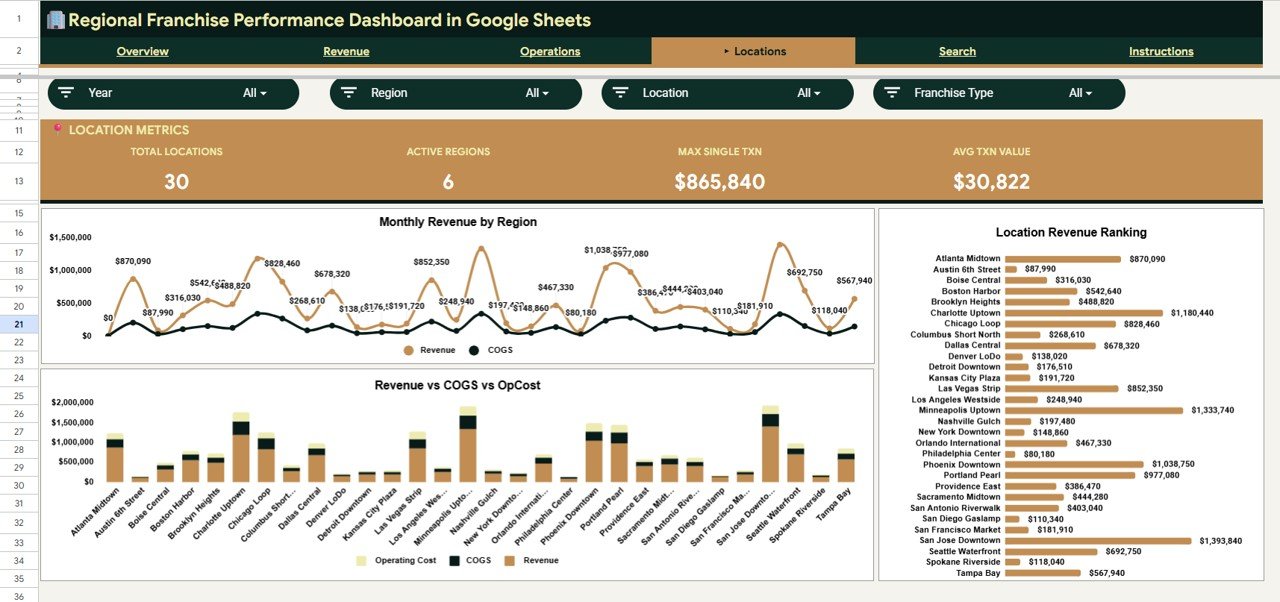
Page 4: Locations
The Locations page compares performance site by site so you can see which outlets lead and which need attention. Charts include Monthly Revenue by Region (trends regional revenue across months), Revenue vs COGS vs Operating Cost by Location (a full profitability view per location), and Revenue by Location (a clean ranking of every site).
Page 5: Search Sheet
The Search sheet holds the Franchise Transaction Lookup. Select any Franchise ID from the dropdown and it returns the full transaction record — Date, Region, Location, Franchise Type, Revenue Stream, Description, Revenue, Units Sold, COGS, Operating Cost, and Status — perfect for answering a quick question about a single franchise without scrolling the raw data.

Page 6: Data Sheet
The Data sheet is where your transactions live. Add your records in the same column format shown and the dashboard, charts, KPIs, and lookup all update automatically — no formula edits needed.
📊 Regional Franchise Performance Dashboard: Google Sheets vs. Microsoft Excel vs. Paid Franchise SaaS — Where This Fits
| Feature | This Google Sheets Dashboard | Microsoft Excel Dashboard | Paid Franchise SaaS (FranchiSoft / Naranga) |
|---|---|---|---|
| Cost | $9.99 one-time | $9.99–$18.99 one-time | $50–$300 / location / month |
| Platform | Google Sheets (browser, any device) | Desktop Excel | Proprietary web platform |
| Setup time | Under 10 minutes | Under 10 minutes | Days to weeks (onboarding) |
| Real-time team collaboration | ✅ Built in (Google Sheets) | ❌ Needs OneDrive / SharePoint | ✅ Yes |
| Mobile access | ✅ Sheets app, free | ⚠️ Excel mobile, limited | ✅ Yes |
| Customizable fields | ✅ Fully editable | ✅ Fully editable | ❌ Locked to vendor schema |
| Share with link | ✅ One click | ⚠️ File send / cloud | ✅ Login required |
| Slicer filtering by region / type / stream | ✅ Native slicers included | ✅ Slicers included | ✅ Yes |
| Year-1 cost at 5 locations | $9.99 total | $9.99–$18.99 total | $3,000–$18,000 / year |
For franchise networks that want a shared, real-time view of revenue and profit without paying $50–$300 per location every month, the Regional Franchise Performance Dashboard in Google Sheets sits in the sweet spot.
👥 Who This Template Is For — and Who It’s Not For
✅ This template is built for:
- Franchise owners and franchisors managing 3–100 locations who want one shared performance view
- Regional and area managers tracking revenue, COGS, and net profit across multiple sites
- Small-business and multi-unit operators who prefer Google Sheets over a paid BI subscription
- Finance and operations analysts who need slicer-driven reporting they can edit freely
❌ This template is NOT for:
- Enterprise franchise groups needing live POS integration, automated data pipelines, or SSO
- Teams that require audited role-based permissions at the row level
- Users who want a fully hosted SaaS with vendor support and SLAs rather than a self-managed spreadsheet
⚙️ How to Use the Regional Franchise Performance Dashboard in Google Sheets
- Open the PDF guide in your download and click the Google Sheets copy link to create your own editable copy in Google Drive.
- Go to the Data sheet and replace the sample rows with your franchise transactions, keeping the same column order.
- Return to the Overview page — the four KPI cards and all charts update automatically from your new data.
- Use the slicers to filter by Region, Franchise Type, or Revenue Stream and watch every page respond together.
- Open the Search sheet and pick a Franchise ID to pull up any single transaction record on demand.
💼 Real-World Use Cases
Maria owns a 12-location coffee franchise across three regions. She uses the Regional Franchise Performance Dashboard in Google Sheets to compare Revenue by Region every Monday, spot which locations are dragging net profit, and share one link with her area managers — without paying $80 per location per month for a franchise platform.
David is a regional manager for a quick-service restaurant brand. He filters the Operations page by his region to watch Monthly COGS vs Operating Cost, then uses the Search sheet to drill into any underperforming outlet before his weekly call with head office.
Priya is a franchise finance analyst. She pastes the month’s transactions into the Data sheet, exports the Revenue Stream Mix by Month chart for the board deck, and answers ad-hoc “how did Location 7 do?” questions instantly using the Franchise Transaction Lookup.
❓ Frequently Asked Questions
What KPIs does the Regional Franchise Performance Dashboard in Google Sheets track?
The Regional Franchise Performance Dashboard in Google Sheets tracks four headline KPIs — Total Revenue, Total COGS, Net Profit, and Transactions — plus revenue by region, franchise type, revenue stream, and location across its charts. Every metric updates automatically when you replace the sample data.
How long does setup take?
Setup takes under 10 minutes. Make a copy of the Google Sheet, paste your franchise transactions into the Data sheet using the same column format, and the KPI cards, charts, slicers, and lookup tool all update automatically with no formula editing.
Can my whole franchise team use it at once?
Yes. Because the Regional Franchise Performance Dashboard runs in Google Sheets, you can share one link and have franchisees, regional managers, and analysts view or edit it in real time from any browser or the free Google Sheets mobile app.
How does this compare to paid franchise management software?
Paid franchise SaaS platforms typically cost $50–$300 per location per month. The Regional Franchise Performance Dashboard in Google Sheets is a one-time $9.99 purchase with no per-user or per-location fees, making it ideal for networks that want core revenue and profit reporting without a subscription.
Do the slicers really filter every chart together?
Yes. The dashboard uses native Google Sheets slicers bound to pivot tables, so selecting a Region, Franchise Type, or Revenue Stream updates the KPI cards and every connected chart on the page at the same time.
Can I add more franchise locations later?
Absolutely. Just add new rows to the Data sheet in the same format. The chart ranges auto-expand and the KPIs recalculate, so the Regional Franchise Performance Dashboard scales as your franchise network grows.
👤 About the Author
Built by PK — Microsoft Certified Professional with 15+ years of Excel, Google Sheets, and Power BI experience. Founder of NextGenTemplates, reaching 300K+ subscribers across YouTube channels (@PK-AnExcelExpert, @NextGenTemplates, @NeoTechNavigators). Every template is hand-built and tested before release.
🔗 Explore Related Templates
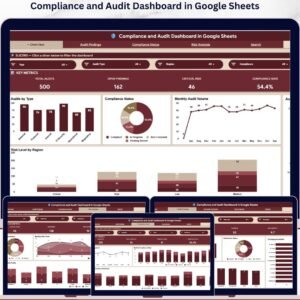
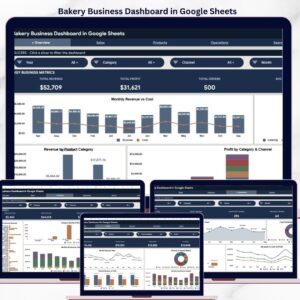
If you manage multi-location operations, you may also like the Franchise Network Analytics Dashboard in Google Sheets for a network-wide analytics view, the Cleaning Staff Performance Dashboard in Google Sheets for service-team tracking, and the Laundromat Business Dashboard in Google Sheets for single-unit operators. Browse all Google Sheets Dashboards for more.
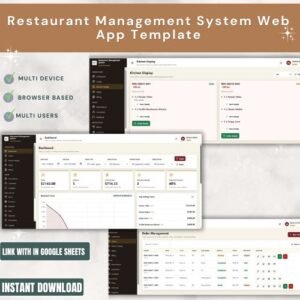
Need a full multi-user system? Step up to the CRM and Sales Pipeline Management System Web App or the Restaurant Management System Web App.
📖 Click here to read the Detailed Blog Post
Watch the step-by-step video Demo:
🎥 Visit our YouTube channel for step-by-step video tutorials
👉 YouTube.com/@NextGenTemplates
📅 Last updated: June 2026


Reviews
There are no reviews yet.