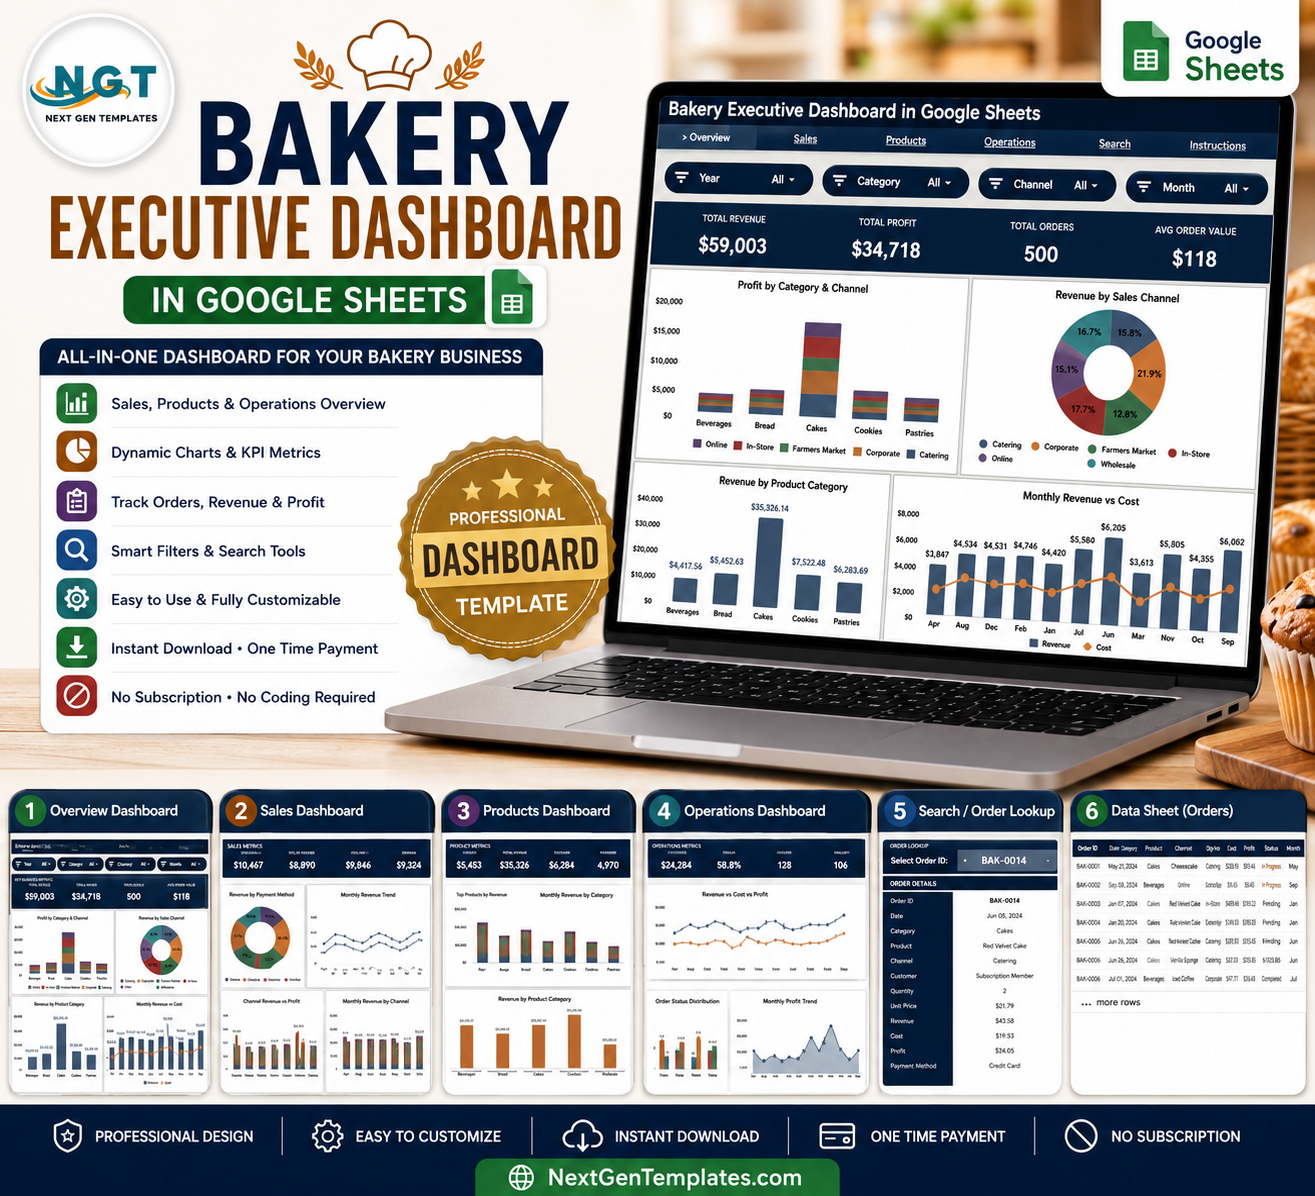
The Bakery Executive Dashboard in Google Sheets tracks 4 headline KPIs — Total Revenue, Total Profit, Total Orders, and Average Order Value — across 4 interactive report pages backed by 16 pre-built charts and click-to-filter slicers. Replace the sample bakery data and every chart, KPI card, and the order Search tab refresh automatically in under 10 minutes.
🌍 Join 8,400+ teams in 40+ countries using NextGenTemplates to replace paid SaaS tools with one-time-purchase Google Sheets, Excel, Power BI, and HTML templates.
✅ Instant download · One-time payment · No subscription · No per-user fees · Lifetime access
🔑 Key Features of the Bakery Executive Dashboard in Google Sheets
🔹 4 executive KPI cards – The Overview page surfaces Total Revenue, Total Profit, Total Orders, and Average Order Value at the top, so a bakery owner sees the headline numbers the moment the sheet opens.
🔹 16 ready-made charts – Across the Overview, Sales, Products, and Operations pages, this dashboard ships with 16 charts covering revenue, profit, cost, sales channel, product category, payment method, and order status.
🔹 Slicer-based filtering – Native slicers on the Overview page let you filter the whole dashboard by category, channel, or month with a click — no formula edits or pivot rebuilds required.
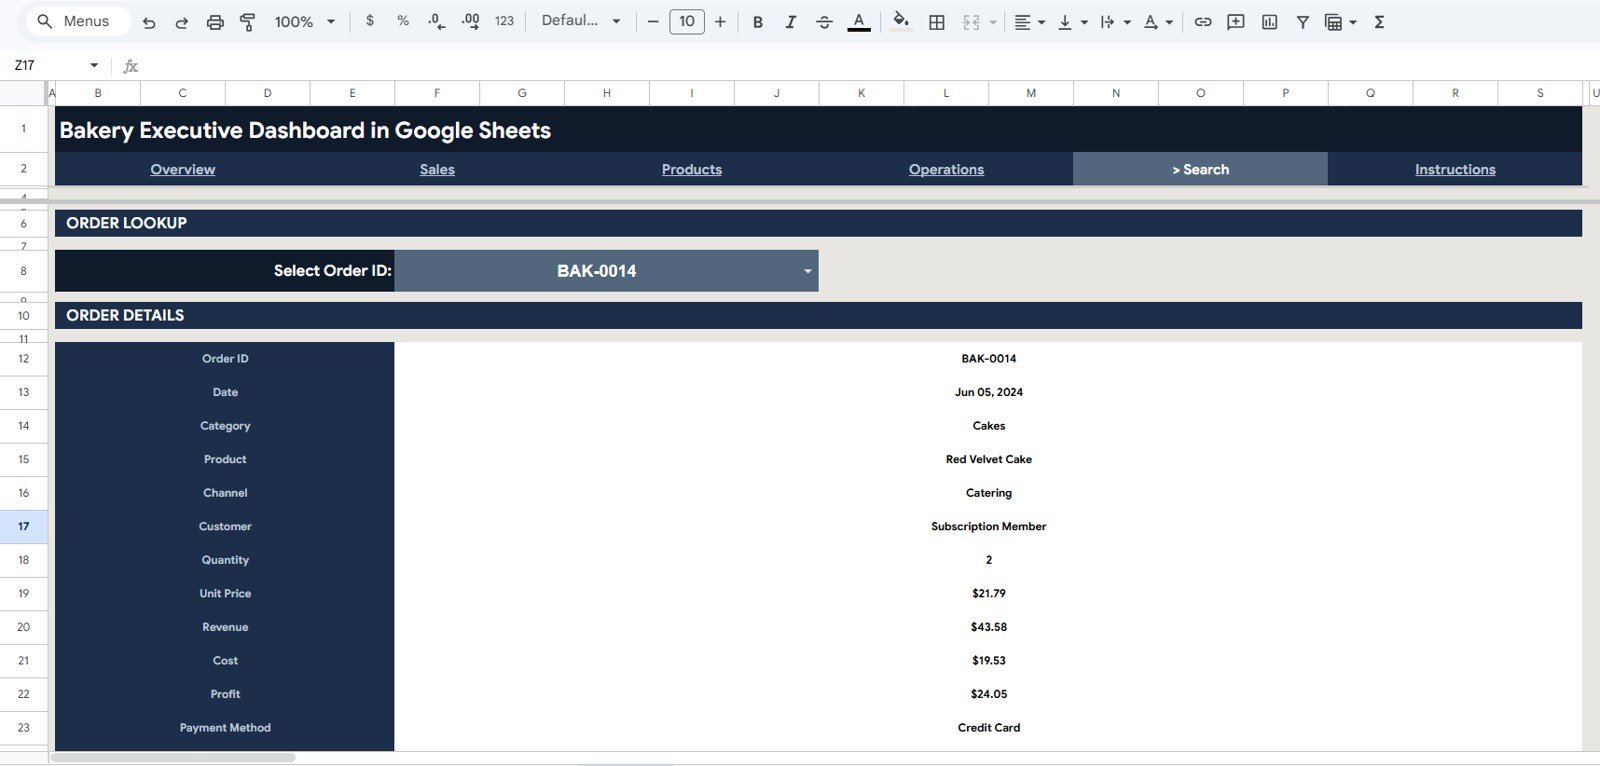
🔹 Order Search tab – Pick any Order ID from a dropdown and instantly read its Date, Category, Product, Channel, Customer, Quantity, Unit Price, Revenue, Cost, Profit, and Payment Method.
🔹 Single Data sheet – All four report pages read from one structured Data tab; add new rows in the same format and the charts and KPI cards expand automatically.
🔹 Runs in the browser – Works in any free Google account with no add-ons, macros, or installs, and pairs naturally with the Inventory Status Analysis Dashboard in Google Sheets for stock-side tracking.
📦 What’s Inside the Bakery Executive Dashboard in Google Sheets
Overview Page
The landing page shows the four KPI cards — Total Revenue, Total Profit, Total Orders, and Average Order Value — alongside slicers and four charts: Profit by Category and Channel, Revenue by Sales Channel, Revenue by Product Category, and Revenue vs Cost by Month.
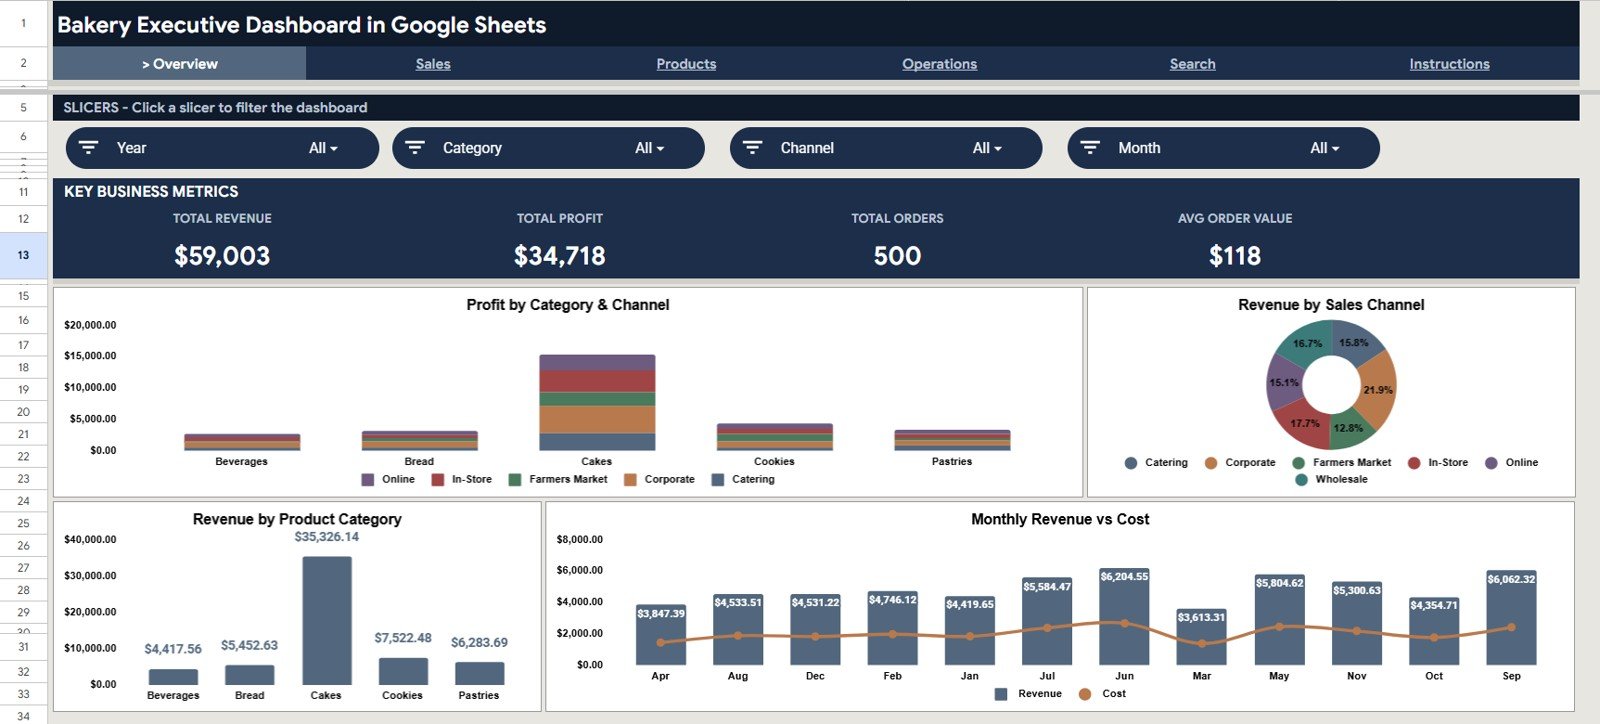
Bakery Executive Dashboard
Sales
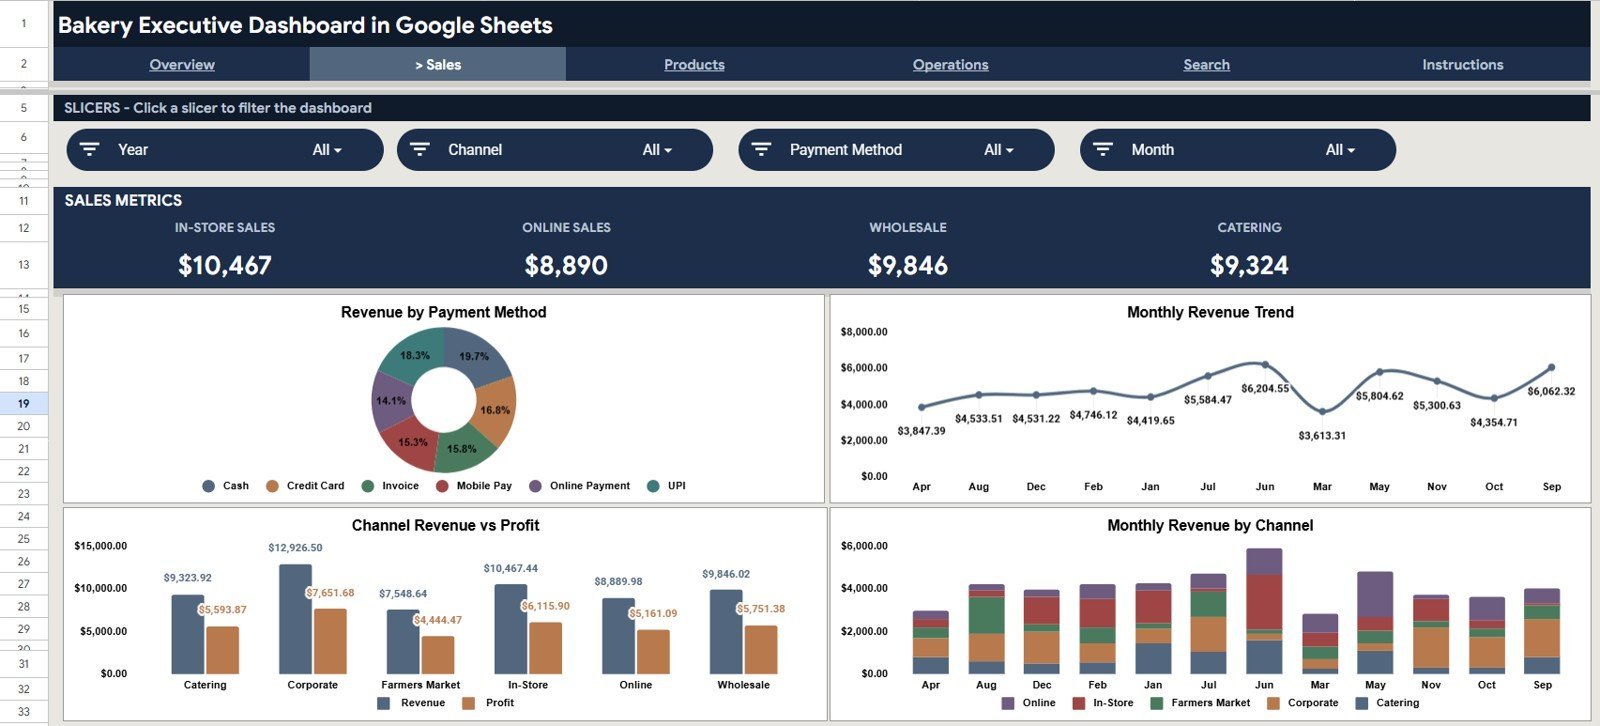
The Sales page analyses how money comes in, with four charts: Revenue by Payment Method, Revenue Trend by Month, Revenue vs Profit by Channel, and Revenue by Channel and Month.
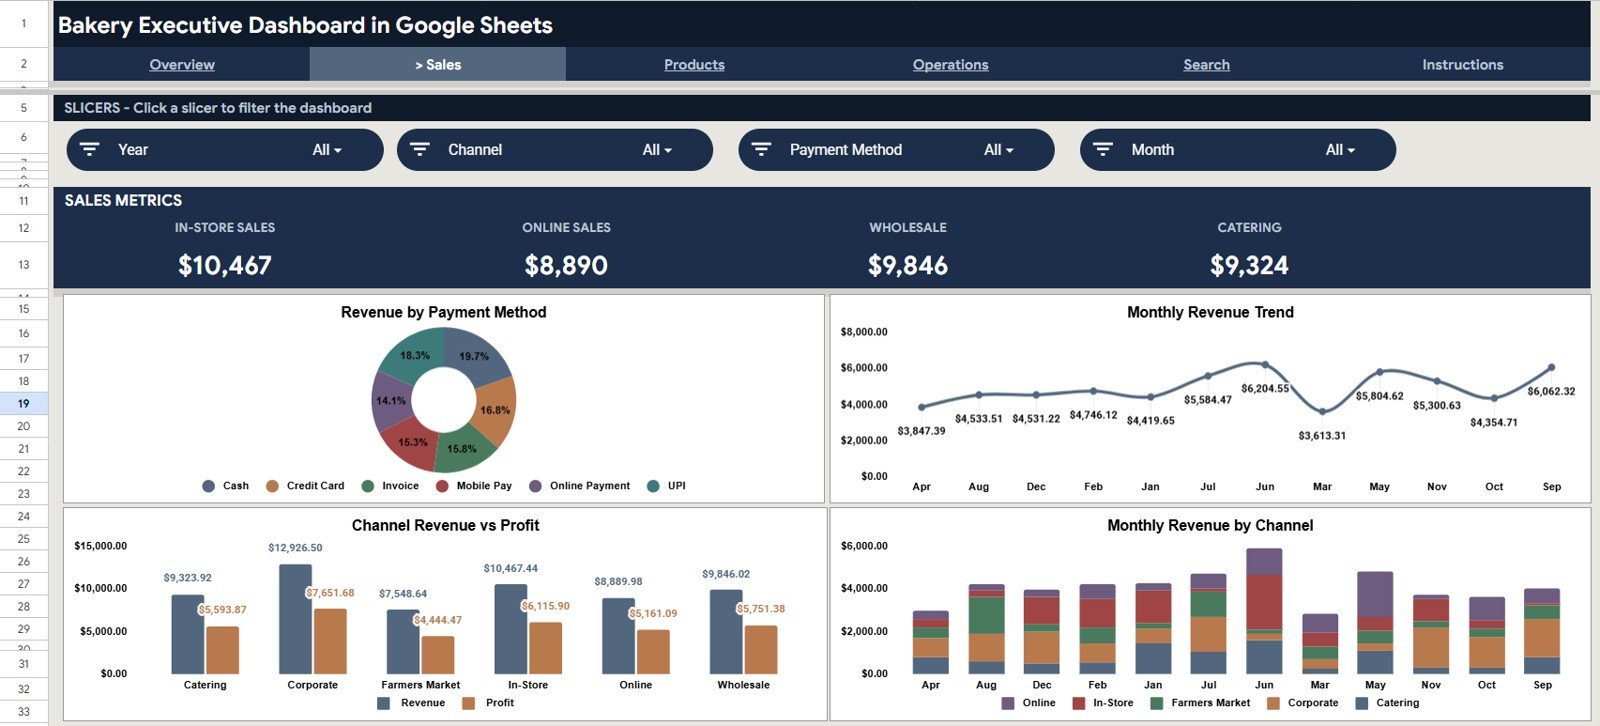
Sales
Products
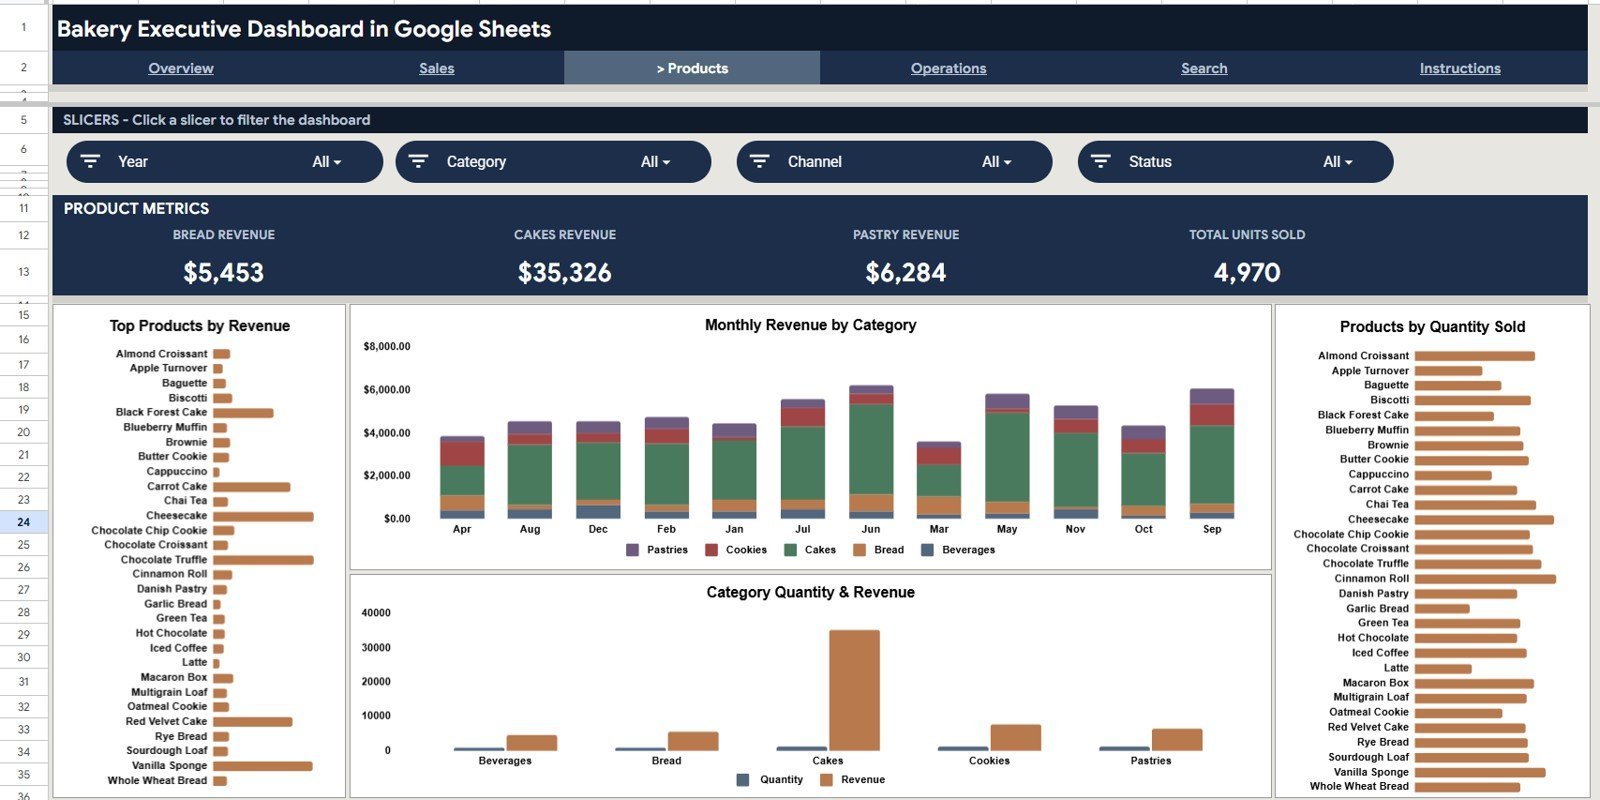
The Products page ranks your menu with Top Products by Revenue, Revenue by Category and Month, Products by Quantity Sold, and Quantity and Revenue by Category.

Products
Operations
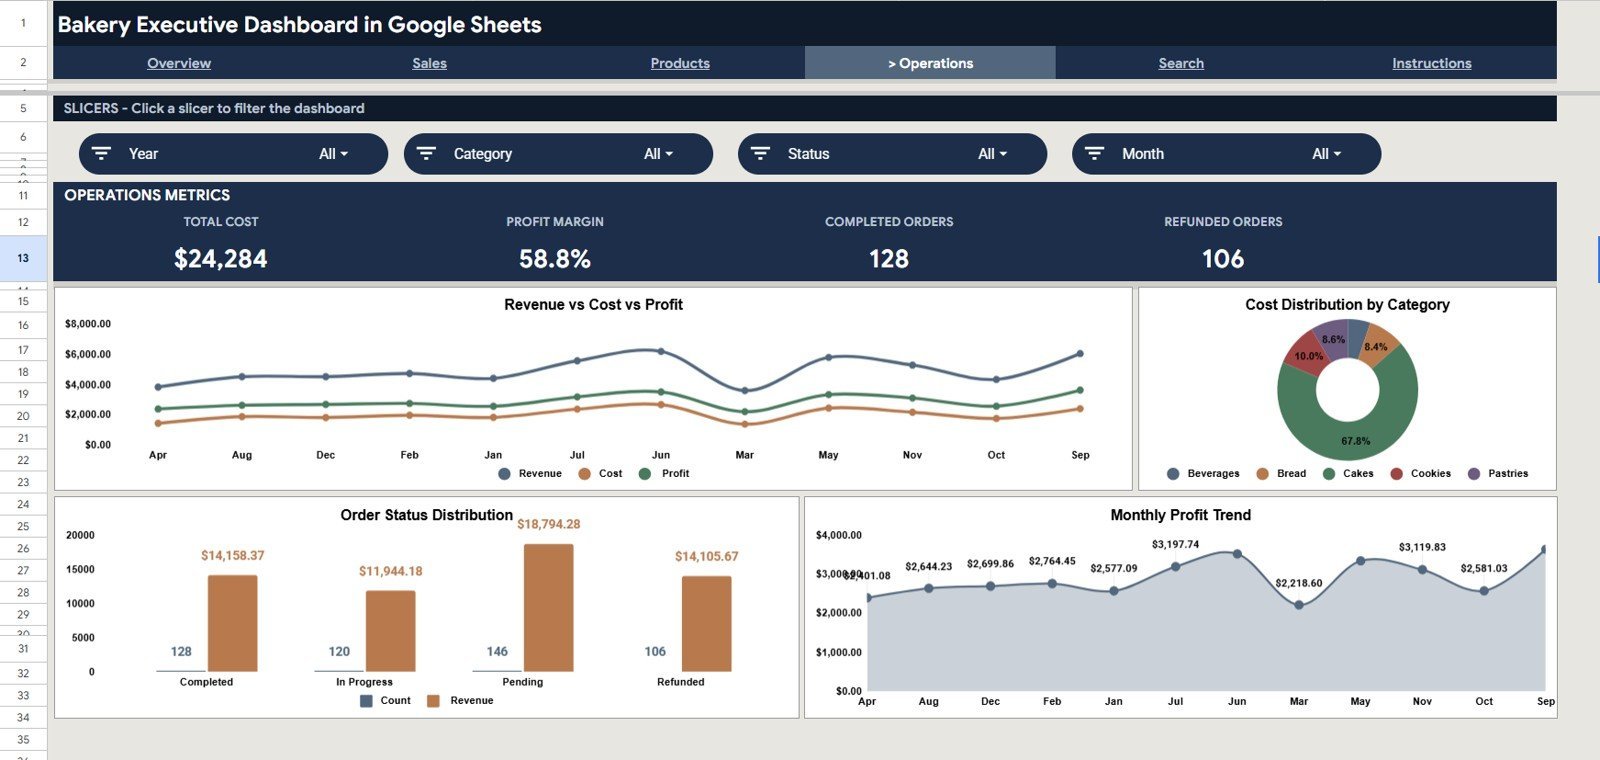
The Operations page connects cost to profit, with Revenue vs Cost vs Profit by Month, Cost Distribution by Category, Order Count and Revenue by Status, and Profit Trend by Month.

Operations
Search Sheet
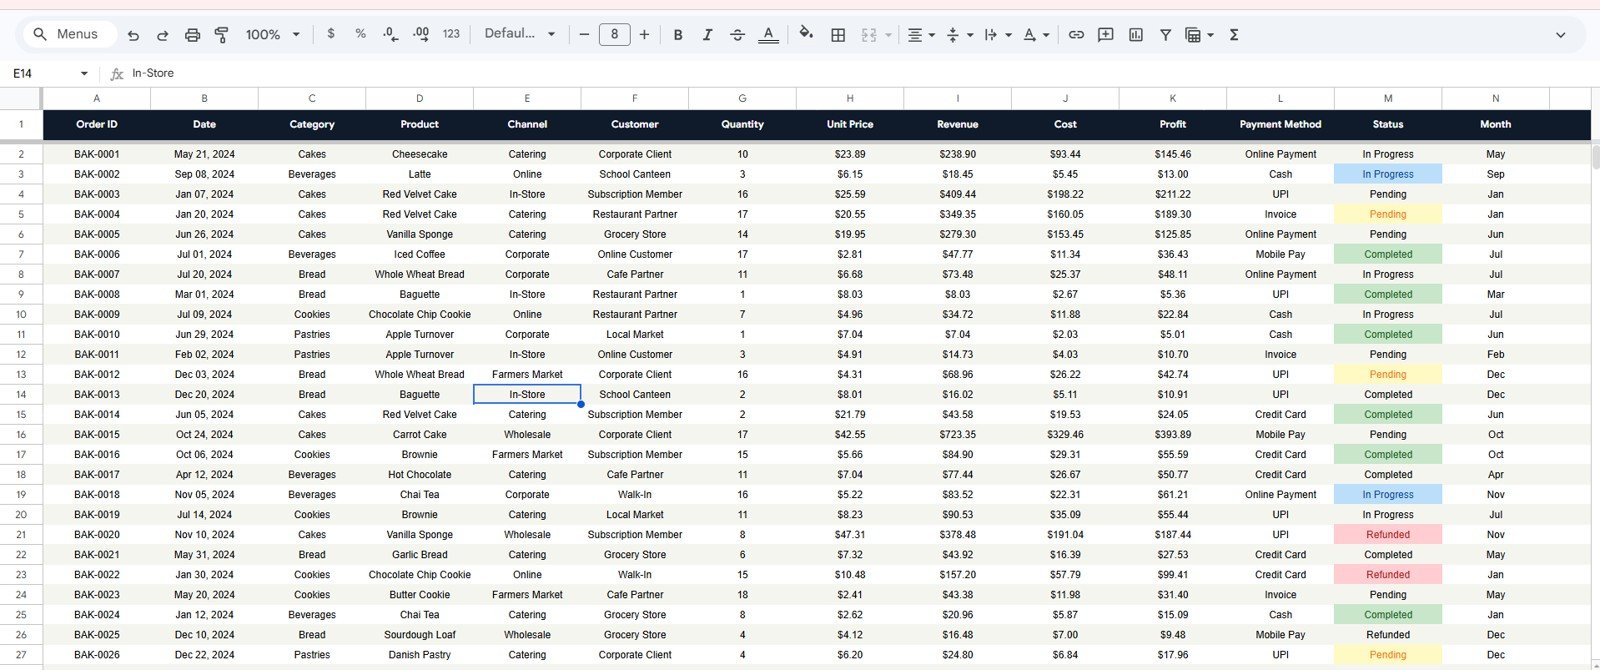
The Search tab lets you select any Order ID from a dropdown and instantly view the full order — Date, Category, Product, Channel, Customer, Quantity, Unit Price, Revenue, Cost, Profit, and Payment Method.

Search Sheet tab
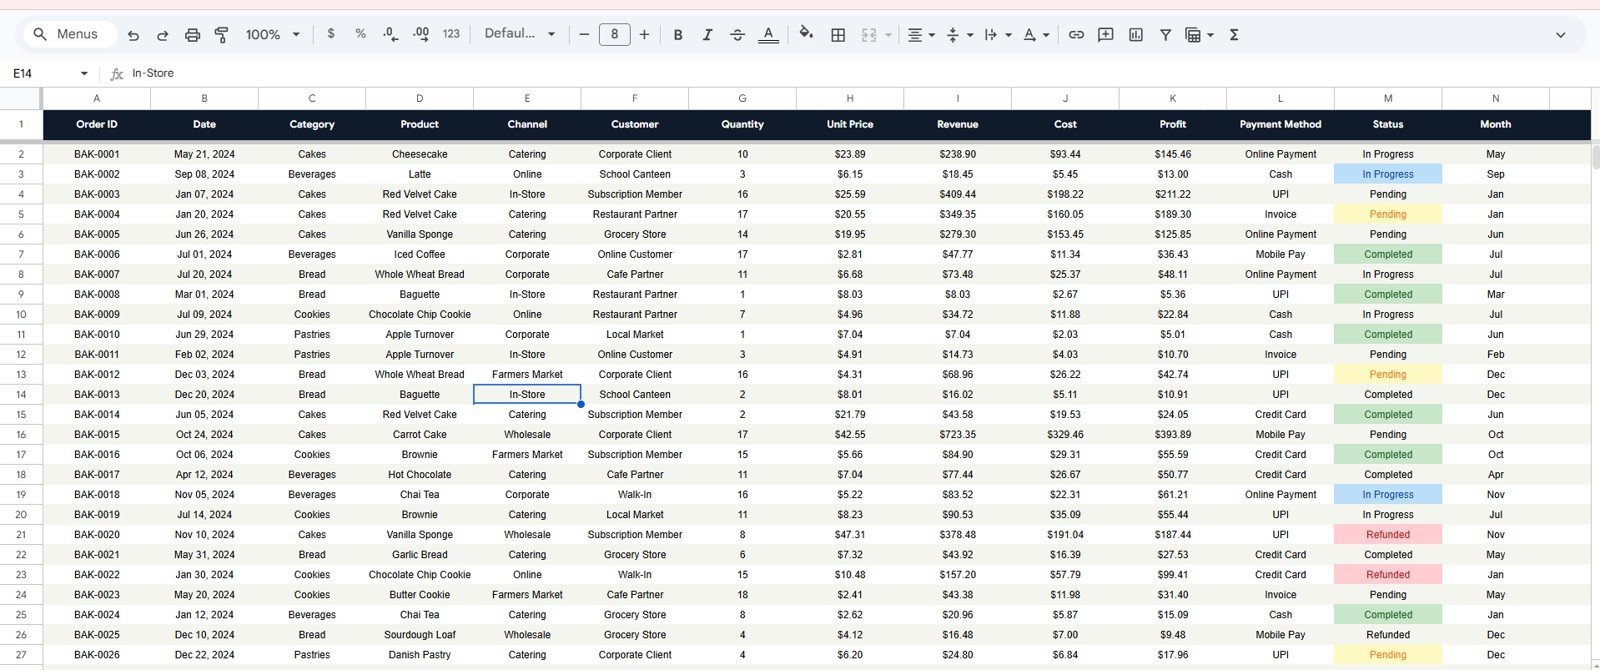
Data Sheet
The Data tab is where you maintain records. Enter each order in the same column format and every page, chart, and KPI updates from this single source.
Data Sheet tab
📊 Bakery Executive Dashboard in Google Sheets vs. Microsoft Excel Dashboard vs. Bakery POS Analytics — Where This Fits
| Feature | Bakery Executive Dashboard (Google Sheets) | Microsoft Excel Dashboard | Toast / Square POS Analytics |
|---|---|---|---|
| Cost | $9.99 one-time | $12–18 one-time | $0–165 / month + fees |
| Platform | Google Sheets (browser) | Desktop Excel | Proprietary POS + cloud |
| Setup time | Under 10 minutes | Under 10 minutes | Days (hardware + onboarding) |
| Real-time team collaboration | ✅ Built in | ❌ Needs OneDrive | ✅ Yes |
| Mobile access | ✅ Sheets app | ⚠️ Limited | ✅ Yes |
| Customizable fields | ✅ Fully editable | ✅ Fully editable | ❌ Locked to vendor |
| Share with link | ✅ Yes | ❌ File-based | ⚠️ Account seats |
| Per-product profitability | ✅ Built in | ✅ Built in | ⚠️ Higher tiers only |
| Year-1 cost at 5 users | $9.99 total | ~$15 total | $1,000–9,900+ |
For bakeries that want owner-level visibility into revenue, profit, and product mix without paying monthly POS analytics fees, the Bakery Executive Dashboard in Google Sheets sits in the sweet spot.
👥 Who This Template Is For — and Who It’s Not For
✅ This template is built for:
- Independent bakery and café owners tracking daily sales, profit, and order mix
- Cloud kitchens and home-baking businesses selling across walk-in, online, and delivery channels
- Bakery managers who report weekly revenue and margins to an owner or franchise
❌ This template is NOT for:
- Large multi-outlet chains needing live integration with POS terminals and inventory ERP
- Teams that need automatic transaction capture instead of manual or exported data entry
- Businesses requiring SOC 2 audited, role-based financial systems
⚙️ How to Use the Bakery Executive Dashboard in Google Sheets
- Open the file and use the Google Sheets copy link in the PDF guide to create your own editable copy in Google Drive.
- Go to the Data sheet and replace the sample rows with your own orders in the same column format.
- Open the Overview page and use the slicers to filter by category, channel, or month.
- Review the Sales, Products, and Operations pages to see revenue, product, and cost analysis.
- Use the Search tab to look up any single order by its Order ID.
💼 Real-World Use Cases
Priya runs a single-location artisan bakery. She uses the Overview and Operations pages to watch profit by category and the monthly cost trend, replacing a $69/month POS analytics add-on with a one-time spreadsheet.
Daniel manages a cloud bakery selling through walk-in, website, and delivery apps. He uses the Sales page — Revenue by Channel and Month and Revenue by Payment Method — to decide where to push weekend promotions.
Aisha is a franchise area manager. She uses the Products page (Top Products by Revenue and Quantity and Revenue by Category) to standardise the bestsellers across her outlets each quarter.
❓ Frequently Asked Questions
What KPIs does the Bakery Executive Dashboard in Google Sheets track?
The Bakery Executive Dashboard in Google Sheets tracks four headline KPIs — Total Revenue, Total Profit, Total Orders, and Average Order Value — plus 16 charts covering channel, category, payment method, cost, and order status.
How many pages and charts are included?
The Bakery Executive Dashboard in Google Sheets includes four report pages — Overview, Sales, Products, and Operations — plus a Search tab and a Data tab, with 16 charts in total.
Do I need Excel or any software to use it?
No. The Bakery Executive Dashboard in Google Sheets runs in any free Google account directly in your browser — there is nothing to install, and no add-ons or macros are required.
How long does setup take?
Setup takes under 10 minutes. Make your own copy, paste your orders into the Data sheet in the same column format, and every chart, KPI card, and the Search tab update automatically.
How does this compare to a bakery POS analytics subscription?
A POS analytics subscription can cost $50–165 per month. The Bakery Executive Dashboard in Google Sheets is a one-time $9.99 purchase; it reads manual or exported order data rather than capturing live transactions.
Can I filter the dashboard?
Yes. Slicers on the Overview page let you filter the entire Bakery Executive Dashboard in Google Sheets by product category, sales channel, or month with a single click.
Can my whole team use it together?
Yes. Because it lives in Google Sheets, you can share the Bakery Executive Dashboard in Google Sheets by link and let your team view or edit it together in real time.
👤 About the Author
Built by PK — Microsoft Certified Professional with 15+ years of Excel, Google Sheets, and Power BI experience. Founder of NextGenTemplates, reaching 300K+ subscribers across YouTube channels (@PK-AnExcelExpert, @NextGenTemplates, @NeoTechNavigators). Every template is hand-built and tested before release.
🔗 Explore Related Templates
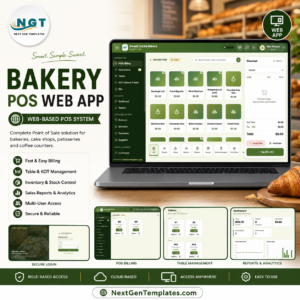
- Bakery POS Web App — full billing, stock, and dashboard system for running the bakery counter.
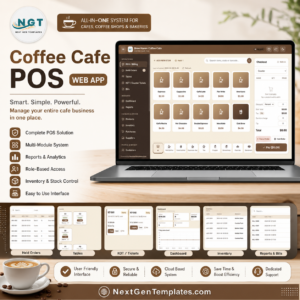
- Coffee Cafe POS Web App — the café equivalent with multi-role logins.
- Inventory Status Analysis Dashboard in Google Sheets — track stock alongside sales.
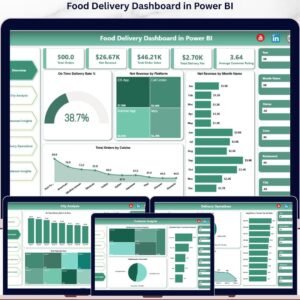
- Food Delivery Dashboard in Power BI — channel and delivery analysis in Power BI.
Browse more Google Sheets Dashboards for other business verticals.
📖 Click here to read the Detailed Blog Post<
Watch the step-by-step video Demo:
🎥 Visit our YouTube channel for step-by-step video tutorials
👉 YouTube.com/@NextGenTemplates
📅 Last updated: June 2026


Reviews
There are no reviews yet.