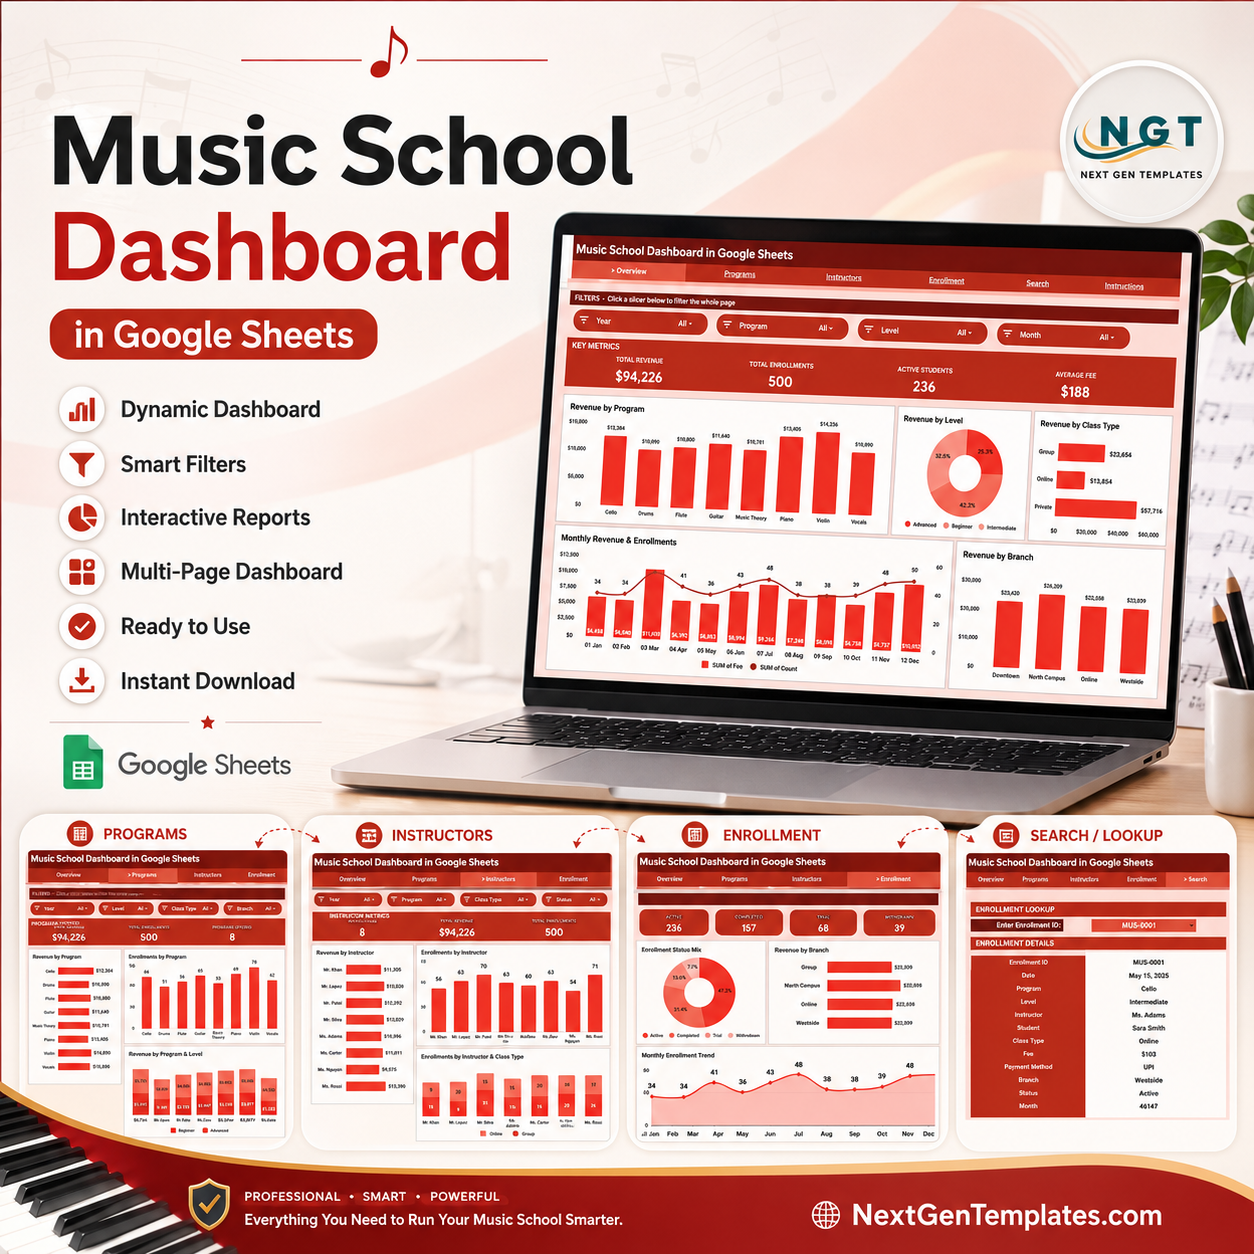


The Music School Dashboard in Google Sheets gives music school owners, branch managers, and program coordinators a 6-sheet reporting system that tracks revenue, enrollments, instructor performance, and branch trends across 4 KPI cards and 17 analysis charts. Setup takes under 10 minutes — replace the sample data on the Data sheet and every chart, slicer, and KPI card updates automatically. For a one-time price of $9.99, it replaces hours of manual spreadsheet rebuilding and the monthly fees of music school SaaS software.
🌍 Join 8,400+ teams in 40+ countries using NextGenTemplates to replace paid SaaS tools with one-time-purchase Excel, Google Sheets, Power BI, and HTML templates.
✅ Instant download · One-time payment · No subscription · No per-user fees · Lifetime access
🔑 Key Features of the Music School Dashboard in Google Sheets
This Music School Dashboard in Google Sheets tracks 4 headline KPIs — Total Revenue, Total Enrollments, Active Students, and Average Fee — and breaks them down across 17 charts on 4 analysis pages. Every visual is powered by native Google Sheets pivot tables, so the numbers stay accurate as your roster grows.
🔹 Slicer-based filtering – Multiple slicers sit at the top of the Overview page, letting you filter the entire dashboard by program, level, class type, or branch in one click — no formulas to edit.
🔹 Pivot-driven charts – All 17 charts read from pivot tables that auto-expand as you add enrollments, so revenue and headcount trends never break when new rows arrive.
🔹 Enrollment lookup – The Search sheet pulls a complete record for any Enrollment ID, including date, program, level, instructor, student, class type, fee, payment method, branch, and status.
🔹 Branch and instructor comparison – Dedicated pages compare revenue and enrollments by instructor and by branch, so you can see which teachers and locations drive the most income.
🔹 Works on any device – Because it runs in Google Sheets, the whole team can open the dashboard on a laptop, tablet, or phone and share it with a single link.
📦 What’s Inside the Music School Dashboard in Google Sheets
The template is organized into 6 sheets — an Overview page, three deep-dive analysis pages (Programs, Instructors, Enrollment), a Search sheet, and a Data sheet. Here is what each one does.
Overview Page
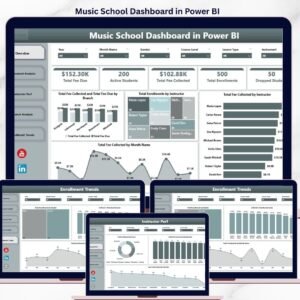
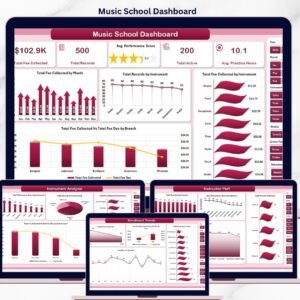
The Overview page opens with 4 KPI cards — Total Revenue, Total Enrollments, Active Students, and Average Fee — and a row of slicers for instant filtering. Charts include Revenue by Program, Revenue by Level, Revenue by Class Type, Monthly Revenue and Enrollments by Month, and Revenue by Branch.

Programs Page
The Programs page focuses on how each course or instrument program performs financially and by headcount. Charts include Revenue by Program, Enrollments by Program, Revenue by Program and Class Type, and Revenue by Program and Level.

Instructors Page
The Instructors page shows which teachers generate the most revenue and enrollments and how they perform across levels and class types. Charts include Revenue by Instructor, Enrollments by Instructor, Revenue by Instructor and Level, and Enrollments by Instructor and Class Type.

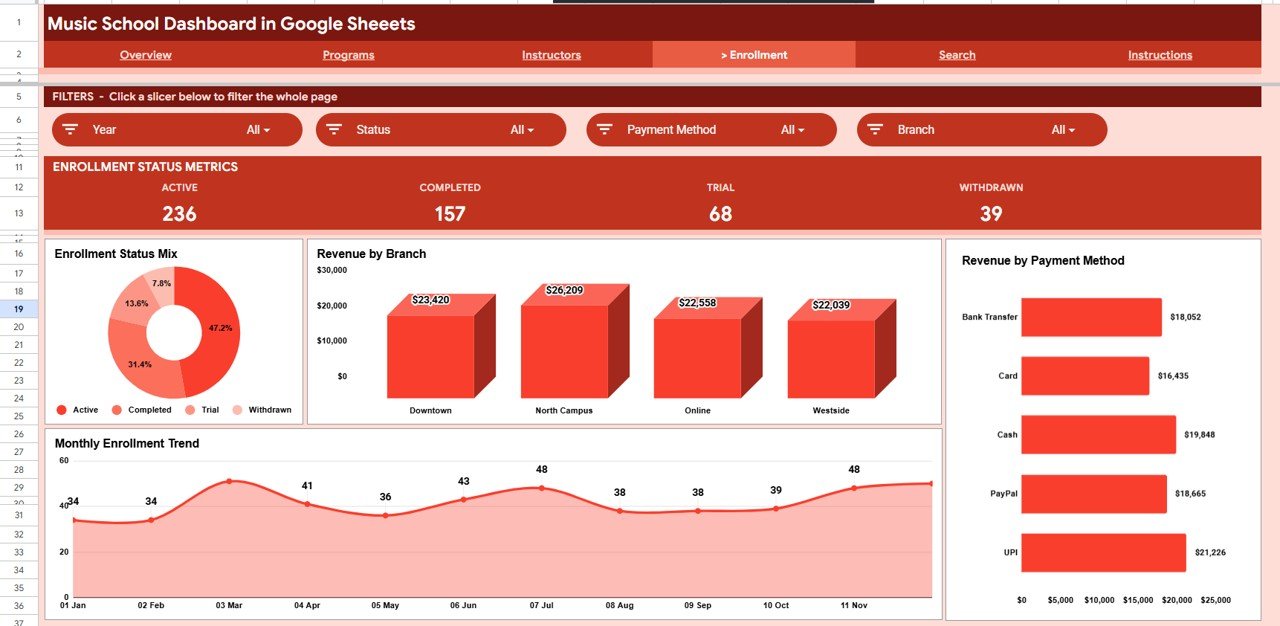
Enrollment Page
The Enrollment page tracks the mix and trend of sign-ups along with how money comes in. Charts include Enrollment Status Mix by Status, Revenue by Branch, Monthly Enrollment Trend by Month, and Revenue by Payment Method.
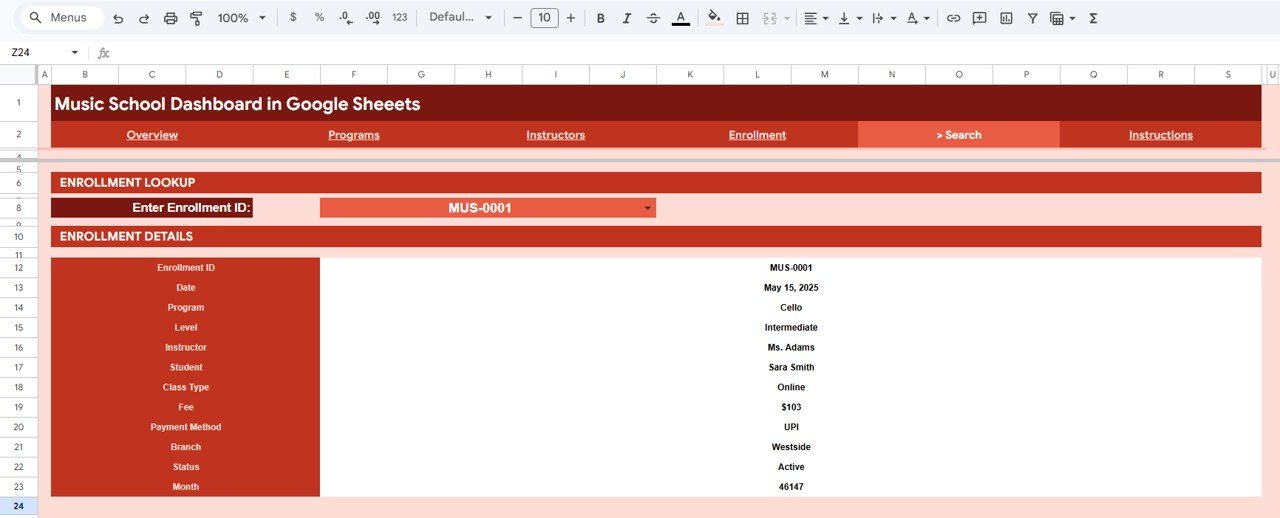
Search Sheet
The Search sheet lets you pick any Enrollment ID from a dropdown and instantly see the full record — date, program, level, instructor, student, class type, fee, payment method, branch, and status. It is the fastest way to answer a parent or staff question without scrolling the raw data.
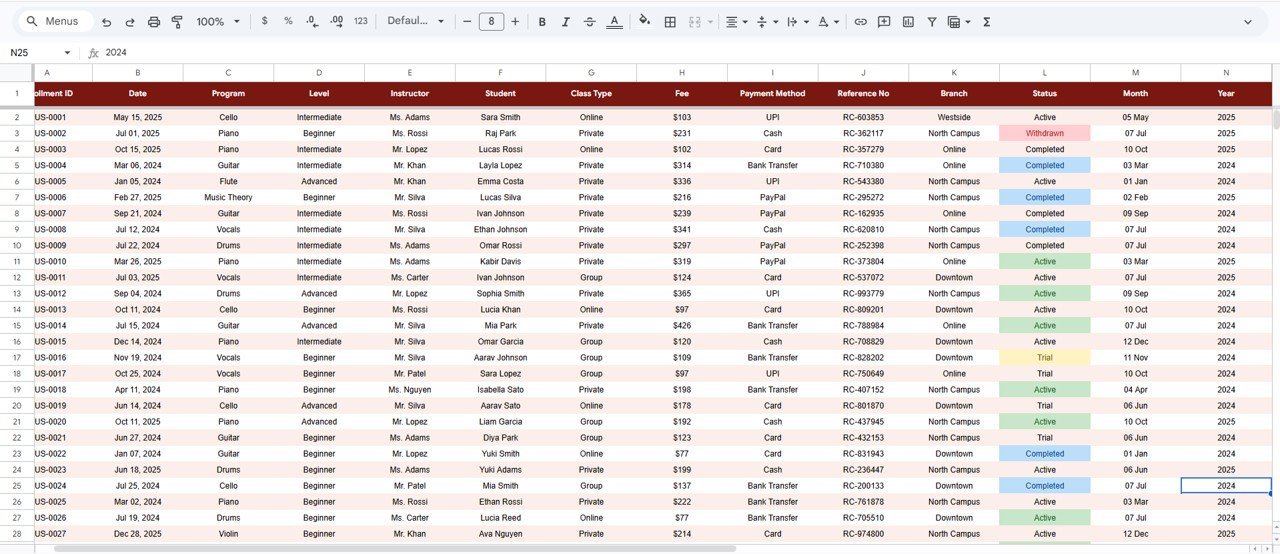
Data Sheet
The Data sheet is where you enter enrollment records in the same column format provided. Add your rows here and every page, pivot table, chart, and KPI card updates automatically — no manual formula edits required.

📊 Music School Dashboard in Google Sheets vs. Excel Dashboard vs. Paid Music School SaaS — Where This Fits
| Feature | Music School Dashboard (Google Sheets) | Microsoft Excel Dashboard | Paid Music School SaaS (My Music Staff / Opus1) |
|---|---|---|---|
| Cost | $9.99 one-time | $12–18 one-time | $15–50 / month |
| Platform | Google Sheets (browser) | Microsoft Excel (desktop) | Web app |
| Setup time | Under 10 minutes | Under 10 minutes | Hours of onboarding |
| Real-time team collaboration | ✅ Built in | Limited | ✅ Yes |
| Mobile access | ✅ Any browser | Excel app needed | ✅ Yes |
| Customizable fields | ✅ Fully editable | ✅ Fully editable | ❌ Locked |
| Share with link | ✅ One click | File send | ✅ Yes |
| Per-user fees | ✅ None | ✅ None | ❌ Per seat / per student |
| Year-1 cost at 5 users | $9.99 | $12–18 | $900–3,000 |
For music schools that want clean reporting and team access without paying $900+ a year for SaaS, the Music School Dashboard in Google Sheets sits in the sweet spot.
👥 Who This Template Is For — and Who It’s Not For
✅ This template is built for:
- Independent music school and academy owners running 1–5 branches
- Program coordinators tracking enrollments across piano, guitar, vocal, and other instrument programs
- Studio managers who want instructor and branch revenue comparisons without monthly software fees
❌ This template is NOT for:
- Large chains needing automated payment processing, SMS reminders, and student portals
- Teams that require role-based logins and audit trails baked into the tool
⚙️ How to Use the Music School Dashboard in Google Sheets
- Open the PDF guide in your download and click the Google Sheets copy link to create your own editable copy in Google Drive.
- Go to the Data sheet and replace the sample enrollments with your own records in the same column format.
- Return to the Overview page — all KPI cards, charts, and slicers update automatically.
- Use the slicers to filter by program, level, class type, or branch, and open the Search sheet to look up any single enrollment.
💼 Real-World Use Cases
Maria owns a piano and vocal academy with two branches. She uses the Music School Dashboard in Google Sheets to compare revenue by branch each month and to spot which instructors fill the most class slots — without paying $39 per month for My Music Staff.
James coordinates programs at a community music school. He filters the Overview page by class type to see whether group lessons or one-on-one sessions bring in more revenue, then shares the link with the board before each quarterly meeting.
Priya manages front desk operations. When a parent calls about a sign-up, she types the Enrollment ID into the Search sheet and reads back the program, instructor, fee, and payment status in seconds.
❓ Frequently Asked Questions
What KPIs does the Music School Dashboard in Google Sheets track?
The Music School Dashboard in Google Sheets tracks 4 headline KPIs — Total Revenue, Total Enrollments, Active Students, and Average Fee — plus 17 charts covering revenue and enrollments by program, level, class type, instructor, branch, payment method, and month.
How long does setup take?
Setup takes under 10 minutes. Make your own copy of the Music School Dashboard in Google Sheets, paste your enrollment records onto the Data sheet, and every pivot table, chart, slicer, and KPI card refreshes automatically.
How does this compare to paid music school SaaS?
Paid music school software like My Music Staff or Opus1 costs $15–50 per month. The Music School Dashboard in Google Sheets is a one-time $9.99 purchase with no per-student fees, giving you the core reporting without an ongoing subscription.
Can I use it on my phone?
Yes. The Music School Dashboard in Google Sheets runs entirely in Google Sheets, so you and your team can open it in any browser on a laptop, tablet, or phone and share it with a single link.
Is the Music School Dashboard available for Excel or Power BI?
Yes. The same template is available as a Music School Dashboard in Excel and a Music School Dashboard in Power BI, so you can pick the platform your team already uses.
👤 About the Author
Built by PK — Microsoft Certified Professional with 15+ years of Excel, Google Sheets, and Power BI experience. Founder of NextGenTemplates, reaching 300K+ subscribers across YouTube channels (@PK-AnExcelExpert, @NextGenTemplates, @NeoTechNavigators). Every template is hand-built and tested before release.
🔗 Explore Related Templates
Also available as: Music School Dashboard in Excel · Music School Dashboard in Power BI.
- Driving School Dashboard in Google Sheets — same 6-sheet reporting layout for driving schools.
- School Admin Dashboard in Google Sheets — wider school administration metrics in one place.
- Music & Performing Arts KPI Dashboard in Excel — a KPI scorecard view for performing-arts programs.
📖 Click here to read the Detailed Blog Post
Watch the step-by-step video Demo:
🎥 Visit our YouTube channel for step-by-step video tutorials
👉 YouTube.com/@NextGenTemplates
📅 Last updated: June 2026


Reviews
There are no reviews yet.