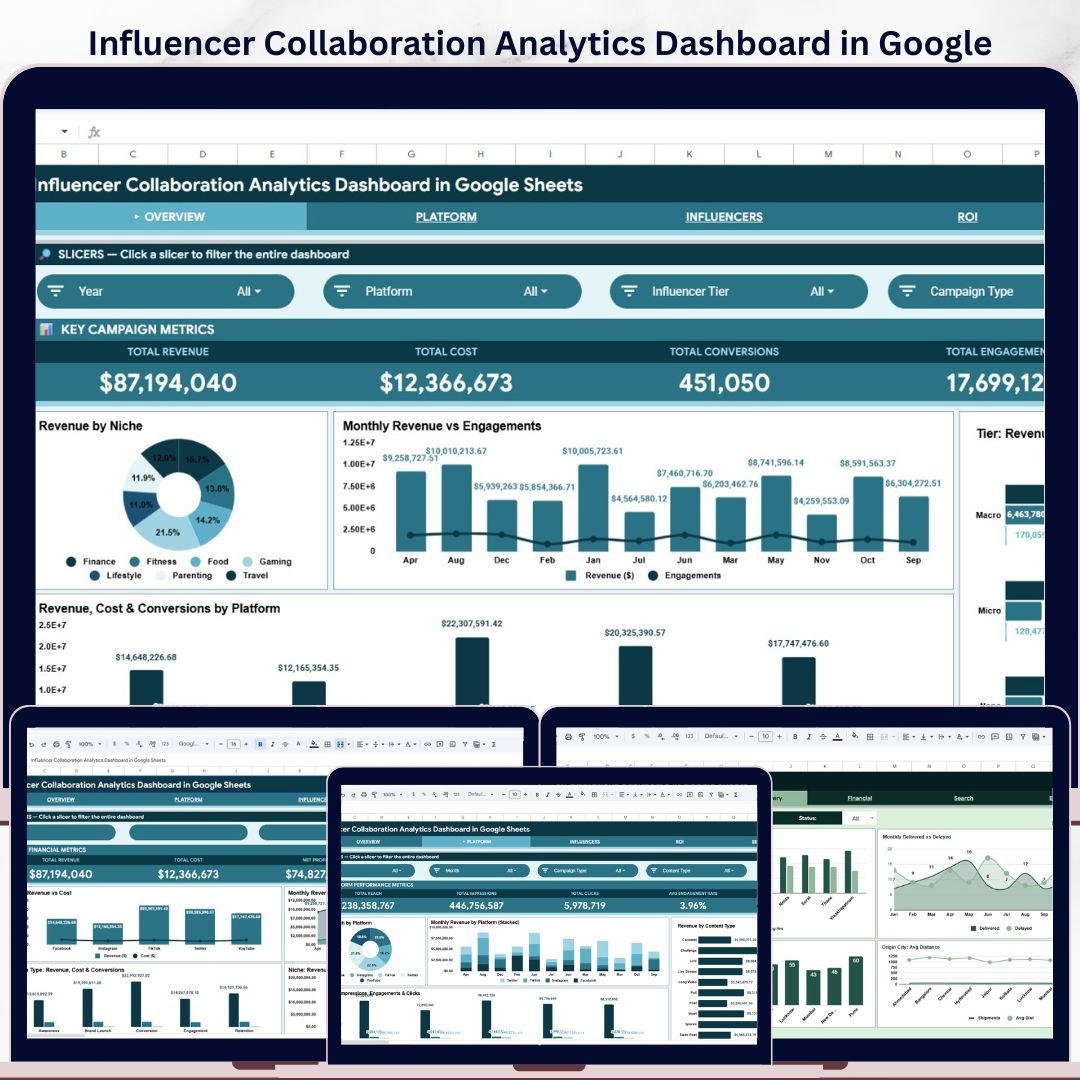
The Influencer Collaboration Analytics Dashboard in Google Sheets gives marketing teams, creators, agencies and brand managers a clear way to monitor influencer campaign performance without building reports from scratch. It brings revenue, cost, conversions, engagements, platform trends, influencer tiers and niche performance into one organized Google Sheets dashboard.
If you manage brand collaborations across Instagram, YouTube, TikTok, blogs, podcasts or other creator channels, this template helps you compare what is working, where budget is going, and which campaigns deserve more attention. The dashboard is built for practical marketing analysis, with slicers, KPI cards and ready-made charts that make influencer performance easier to review.
- 6 dashboard tabs for overview, platform, influencer, ROI, search and data entry analysis.
- 4 executive KPI cards for Total Revenue, Total Cost, Total Conversions and Total Engagements.
- 16 chart views covering revenue, cost, reach, impressions, clicks, conversions, engagements and niche performance.
- Built in Google Sheets, so your team can work online, collaborate and update campaign data without extra software.
Key Features of the Influencer Collaboration Analytics Dashboard
- Overview dashboard: Track high-level influencer marketing results with KPI cards and charts for revenue by niche, monthly revenue and engagements, influencer tier performance, and platform performance.
- Platform analytics: Compare reach, revenue, content type performance, impressions, engagements and clicks by platform.
- Influencer analysis: Review revenue, cost, engagements and conversions by influencer tier, niche and platform.
- ROI analysis: Monitor revenue and cost by platform, month, campaign type and niche to understand return on collaboration spend.
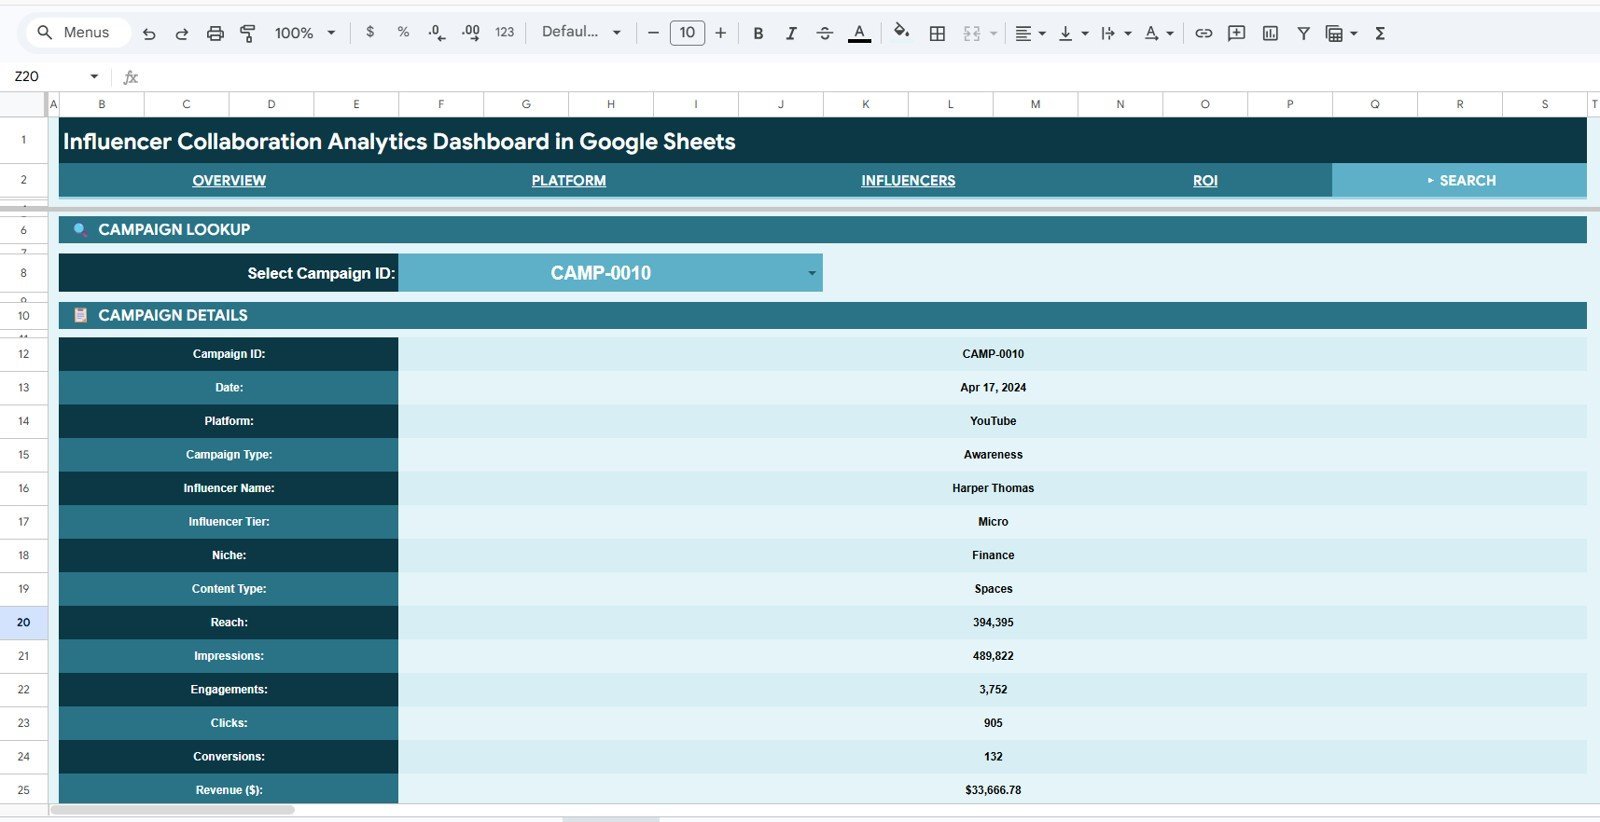
- Search sheet: Select a Campaign ID from the dropdown and view complete campaign details in one place.
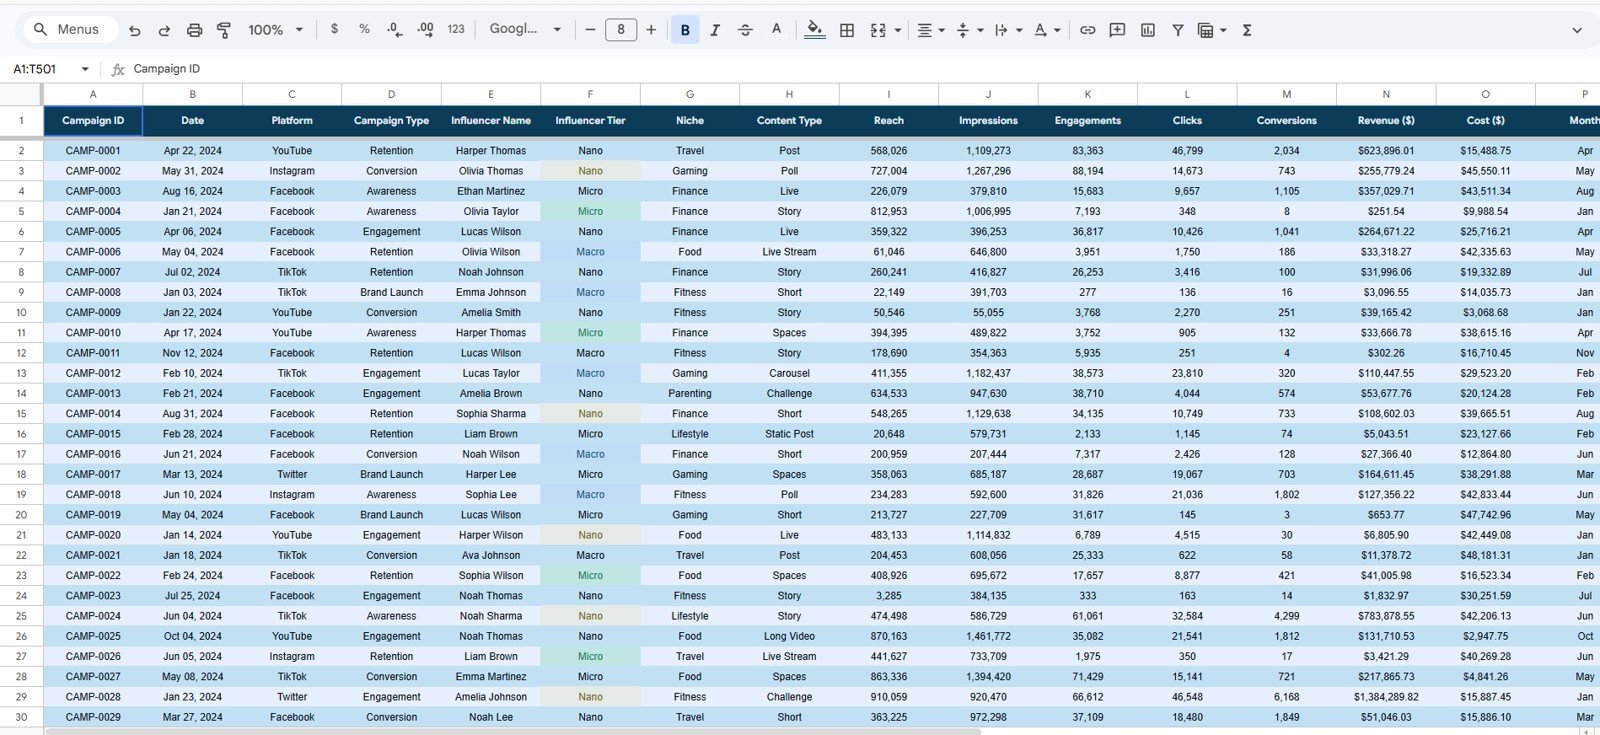
- Structured data sheet: Enter campaign records in a consistent format so the dashboard updates cleanly.
- Slicer-based filtering: Use interactive slicers to filter campaign results quickly and analyze specific platforms, months, tiers or campaign groups.
What’s Inside the Template?
| Sheet Tab | What It Helps You Analyze |
|---|---|
| Overview | Total Revenue, Total Cost, Total Conversions, Total Engagements, revenue by niche, monthly trends, tier performance and platform performance. |
| Platform | Reach by platform, revenue by platform and month, revenue by content type, and impressions, engagements and clicks by platform. |
| Influencers | Revenue, cost, engagements and conversions by tier, revenue and engagements by niche, and reach by platform and tier. |
| ROI | Revenue and cost by platform, month, campaign type and niche for clearer campaign return analysis. |
| Search Sheet | Campaign ID lookup for date, platform, campaign type, influencer name, tier, niche, content type, reach, impressions, engagements, clicks, conversions and revenue. |
| Data Sheet | Clean input table where you add influencer collaboration data in the same required format. |
Dashboard Pages Explained
1. Overview Page
The Overview page is designed for quick executive reporting. It includes cards for Total Revenue, Total Cost, Total Conversions and Total Engagements, giving you a fast view of campaign scale and outcomes.
The charts show Revenue by Niche, Revenue and Engagements by Month, Revenue, Engagements and Conversions by Influencer Tier, and Revenue, Cost and Conversions by Platform. This makes it easier to identify which niches, months, tiers and platforms are producing the strongest results.
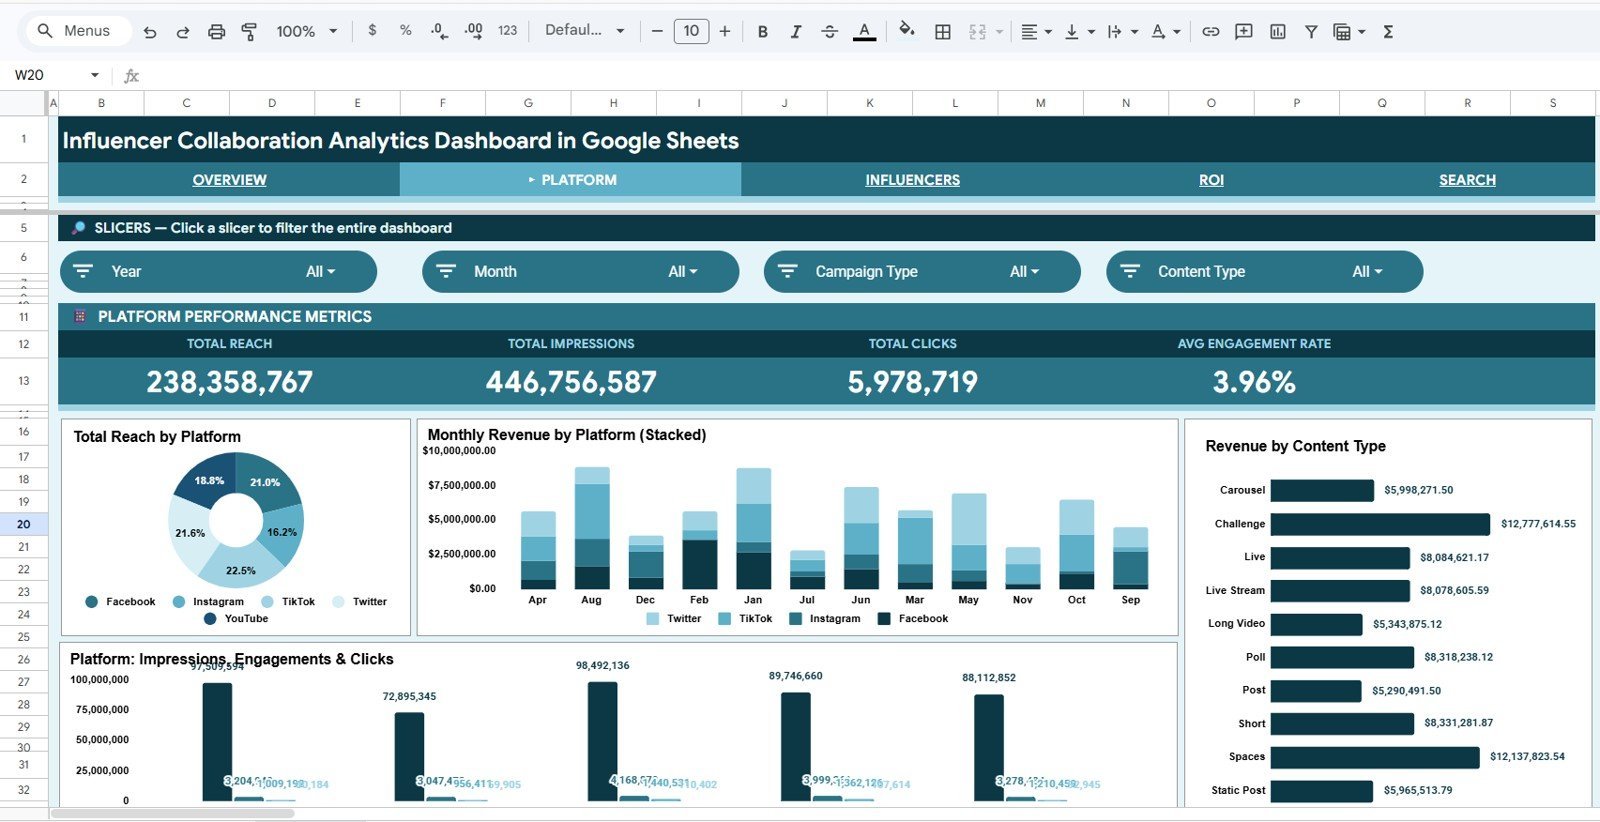
2. Platform Page
The Platform tab helps compare how different social and creator channels perform. It includes analysis for Reach by Platform, Revenue by Platform and Month, Revenue by Content Type, and Impressions, Engagements and Clicks by Platform.
This view is useful when deciding where to invest the next campaign budget, which content formats are generating revenue, and which platforms are driving awareness versus action.
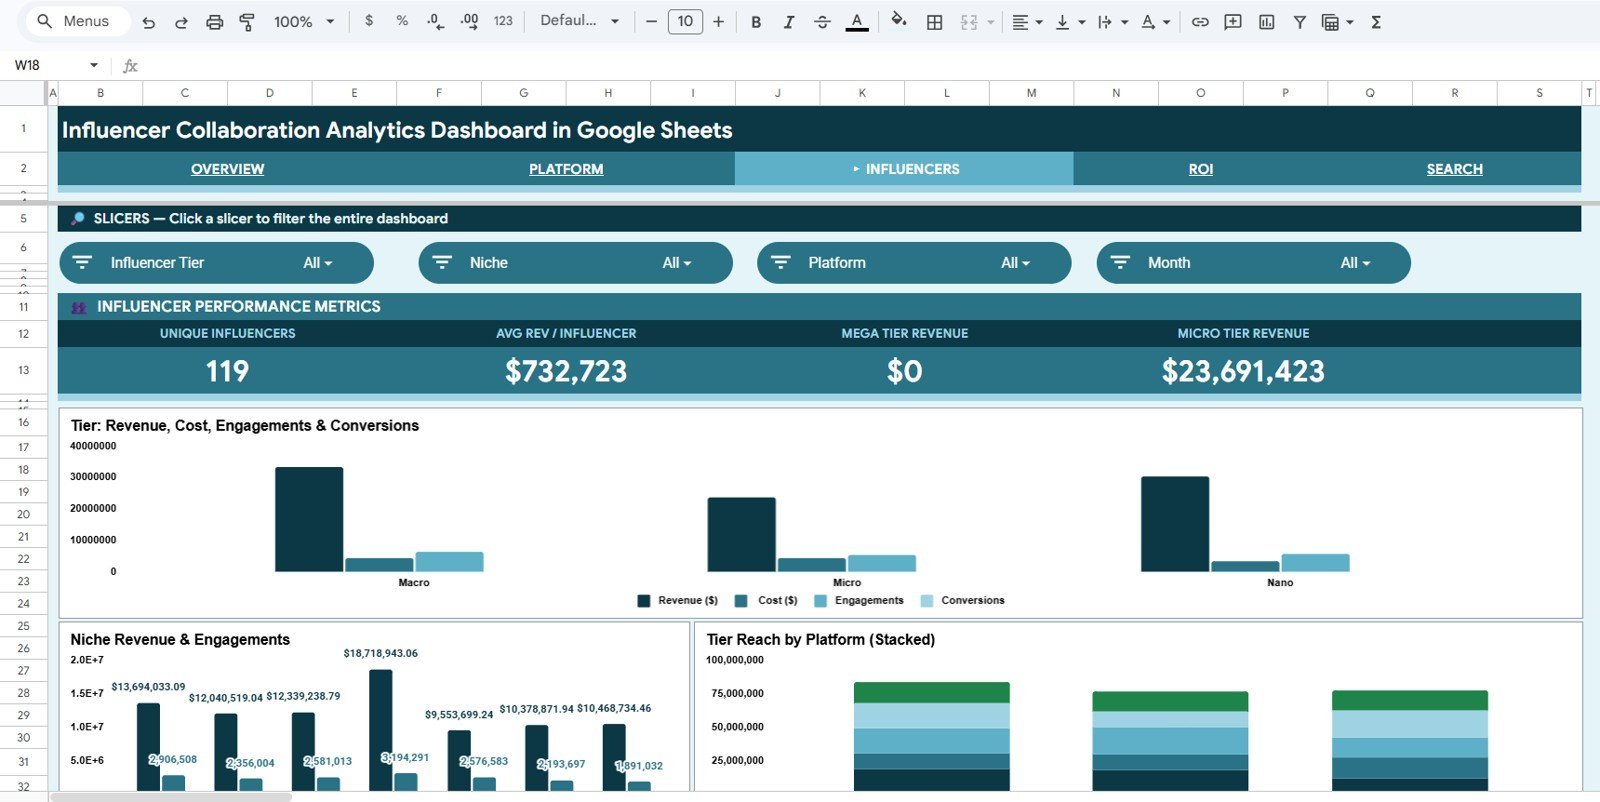
3. Influencers Page
The Influencers tab focuses on creator performance by tier, niche and platform. It compares Revenue, Cost, Engagements and Conversions by Tier, Revenue and Engagements by Niche, and Reach by Platform and Tier.
This helps teams understand whether nano, micro, mid-tier or macro influencers are performing best, and whether specific niches are producing higher engagement or conversion efficiency.
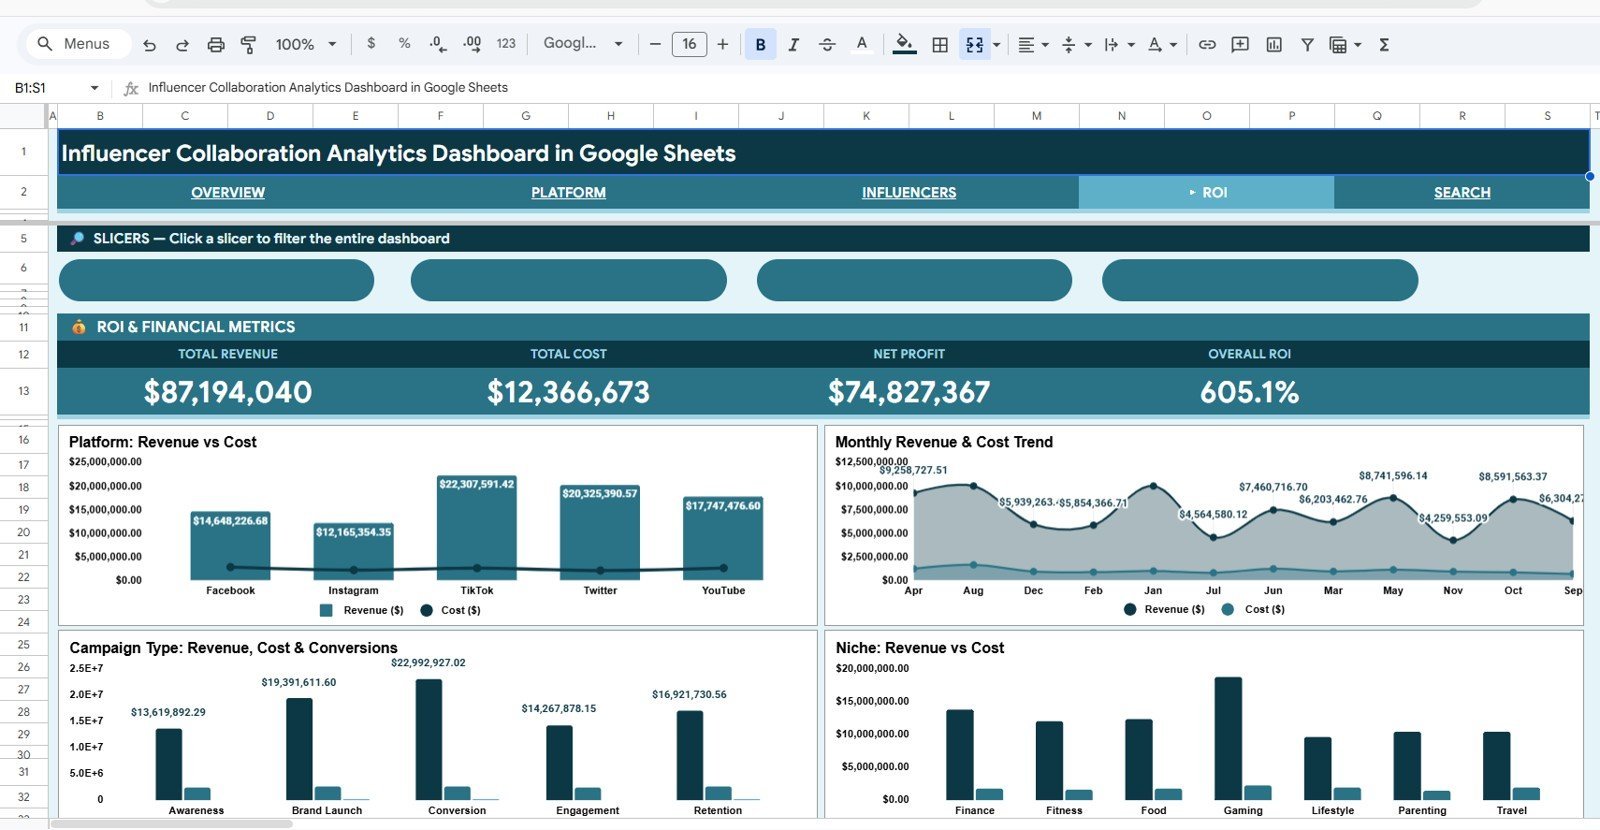
4. ROI Page
The ROI tab is built for campaign profitability and spend review. It includes Revenue and Cost by Platform, Revenue and Cost by Month, Revenue, Cost and Conversions by Campaign Type, and Revenue and Cost by Niche.
This page helps you see whether influencer spend is aligned with revenue output and which campaign types or audience niches deserve more budget.
5. Search Sheet
The Search Sheet lets you select a Campaign ID from a dropdown and instantly view the related campaign details. It pulls together date, platform, campaign type, influencer name, influencer tier, niche, content type, reach, impressions, engagements, clicks, conversions and revenue.
This is especially helpful for quick campaign audits, client reporting, internal reviews and answering specific performance questions without scrolling through raw data.
6. Data Sheet
The Data Sheet is where you add influencer collaboration records in the required format. Keeping campaign data structured ensures the dashboard charts, KPI cards and filters update properly.
Use the same columns and format when adding new campaign rows so your reports stay consistent and easy to maintain.
Influencer Dashboard vs Manual Reporting vs SaaS Tools
| Option | Best For | Limitations |
|---|---|---|
| This Google Sheets Dashboard | Affordable, editable influencer campaign reporting with charts, slicers and structured data. | Requires manual or imported data entry. |
| Manual Spreadsheet | Basic campaign tracking and simple totals. | Time-consuming to design and easy to break. |
| SaaS Influencer Platform | Large teams that need automated creator discovery, outreach and enterprise workflows. | Usually more expensive and may include features smaller teams do not need. |
Who Should Use This Template?
- Influencer marketing managers tracking campaign results across multiple creators.
- Digital marketing agencies reporting collaboration performance to clients.
- Brand teams measuring revenue, reach, clicks, conversions and engagement from creator campaigns.
- Small businesses that need an affordable influencer analytics template in Google Sheets.
- Content partnerships teams comparing performance by platform, tier, niche and campaign type.
Who Is This Template Not For?
- Teams that need automated API connections to every social media platform out of the box.
- Companies looking for influencer discovery, contract management or payment processing features.
- Users who do not want to maintain campaign-level data in a spreadsheet format.
How to Use the Influencer Collaboration Analytics Dashboard
- Open the Google Sheets template and make a copy for your own workspace.
- Go to the Data Sheet and replace the sample records with your own campaign data.
- Keep the same column format for campaign ID, date, platform, influencer, tier, niche, content type, reach, impressions, engagements, clicks, conversions, cost and revenue.
- Use the slicers on the dashboard pages to filter by campaign dimensions.
- Review the Overview, Platform, Influencers and ROI pages to understand performance patterns.
- Use the Search Sheet to look up a specific Campaign ID and review all details in one place.
Real-World Use Cases
- Monthly influencer report: Summarize campaign revenue, cost, conversions and engagements for leadership or clients.
- Platform budget planning: Compare Instagram, TikTok, YouTube and other channels before allocating the next campaign budget.
- Influencer tier analysis: Identify whether nano, micro, mid-tier or macro influencers are driving better outcomes.
- Campaign ROI review: Compare revenue and cost by campaign type, niche and month.
- Campaign lookup: Quickly retrieve individual campaign details using Campaign ID search.
Why This Dashboard Is Useful
Influencer marketing data can become scattered across platform exports, campaign sheets, screenshots and agency reports. This dashboard gives you one structured place to review the most important collaboration metrics, without needing to build charts or report layouts from zero.
Because it is made in Google Sheets, it is easy to edit, duplicate, share and adapt. You can use it as a lightweight reporting system for internal teams, client dashboards, creator campaign reviews or marketing performance meetings.
FAQ
Is this dashboard built in Google Sheets?
Yes. This is a Google Sheets dashboard template designed for influencer collaboration and campaign analytics.
Can I customize the dashboard?
Yes. You can edit the sample data, update formulas, adjust colors, modify charts and adapt the layout to match your reporting needs.
Does it include influencer ROI analysis?
Yes. The ROI tab compares revenue and cost by platform, month, campaign type and niche so you can review campaign return more clearly.
Can I use it for agency client reporting?
Yes. Agencies can use the dashboard to present influencer campaign performance, platform results, niche performance and campaign-level details to clients.
Do I need advanced spreadsheet skills?
No. The template is already structured with dashboard pages, charts, slicers and a data sheet. Basic Google Sheets knowledge is enough to update the data and use the reports.
About the Author
This template is created by PK: An Excel Expert, founder of NextGenTemplates and creator of practical Excel, Google Sheets and dashboard templates for business users. Our tutorials and spreadsheet systems have helped a community of more than 300K+ subscribers build better reporting workflows.
Watch the step-by-step video tutorial:
Explore Related Templates
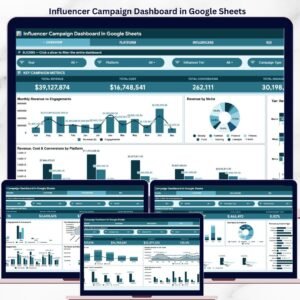
- Influencer Campaign Dashboard in Google Sheets
- Influencer Engagement KPI Dashboard in Google Sheets
- PPC Campaign KPI Dashboard in Google Sheets
- Seller Analytics Dashboard in Google Sheets
Last updated: May 21, 2026.


Reviews
There are no reviews yet.