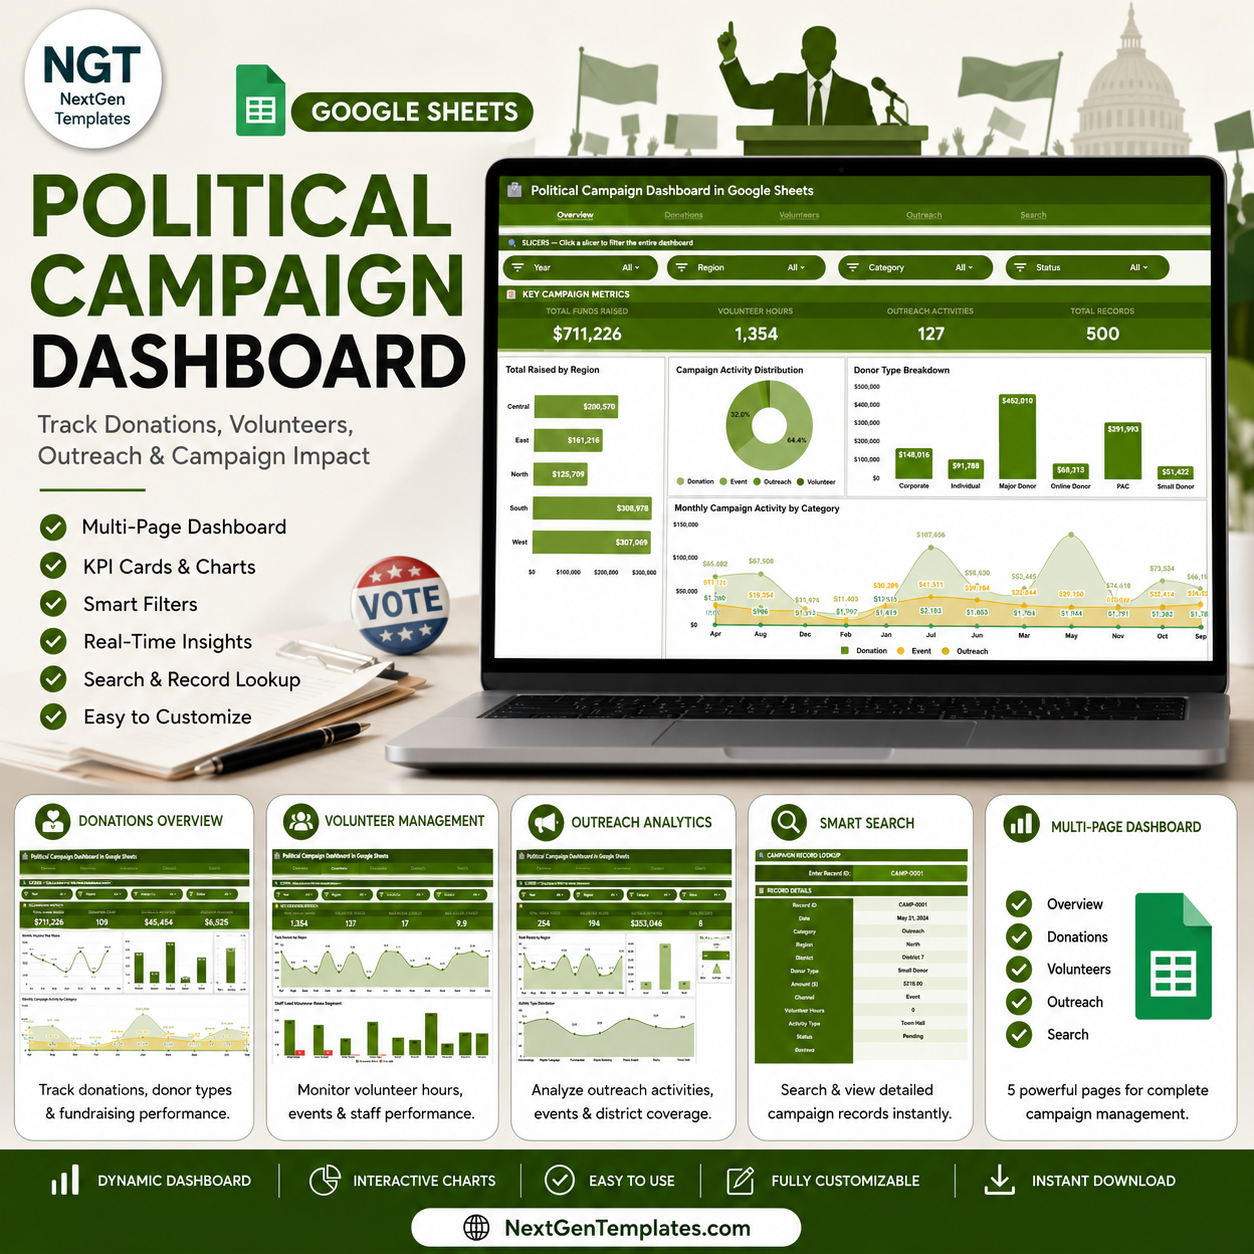

The Political Campaign Dashboard in Google Sheets tracks 4 core KPIs across 4 interactive analysis pages — Total Funds Raised, Volunteer Hours, Outreach Activities, and Total Records — all updating automatically when you replace the sample data. The dashboard includes 12 pre-built charts and interactive slicers for real-time filtering by Region, Donor Type, and Activity Type. Setup takes under 10 minutes: paste your campaign data and every chart and KPI card updates instantly.
🌍 Join 8,400+ teams in 40+ countries using NextGenTemplates to replace paid SaaS tools with one-time-purchase Google Sheets templates.
✅ Instant download · One-time payment · No subscription · No per-user fees · Lifetime access
🔑 Key Features of the Political Campaign Dashboard in Google Sheets
This dashboard tracks 4 KPIs — Total Funds Raised, Volunteer Hours, Outreach Activities, and Total Records — across 4 dedicated analysis pages with interactive slicers. It includes 12 pre-built charts covering donation trends, volunteer engagement, outreach volume, and regional performance. The Search sheet retrieves complete record details by entering any Record ID — including date, category, region, district, donor type, amount, channel, volunteer hours, activity type, status, and staff lead. Built entirely in native Google Sheets with no add-ons required, it is fully shareable via a Google Drive link.
- 🔹 4 interactive KPI cards — Total Funds Raised, Volunteer Hours, Outreach Activities, Total Records
- 🔹 12 pre-built charts across Donations, Volunteers, and Outreach pages
- 🔹 Slicers on every analysis page for real-time Region, Donor Type, and Activity Type filtering
- 🔹 Record ID lookup — retrieve full campaign activity details in one click
- 🔹 Structured Data sheet — add new records in the same column format and the dashboard auto-updates
- 🔹 No add-ons, no coding — 100% native Google Sheets formulas and charts
📦 What’s Inside the Political Campaign Dashboard in Google Sheets
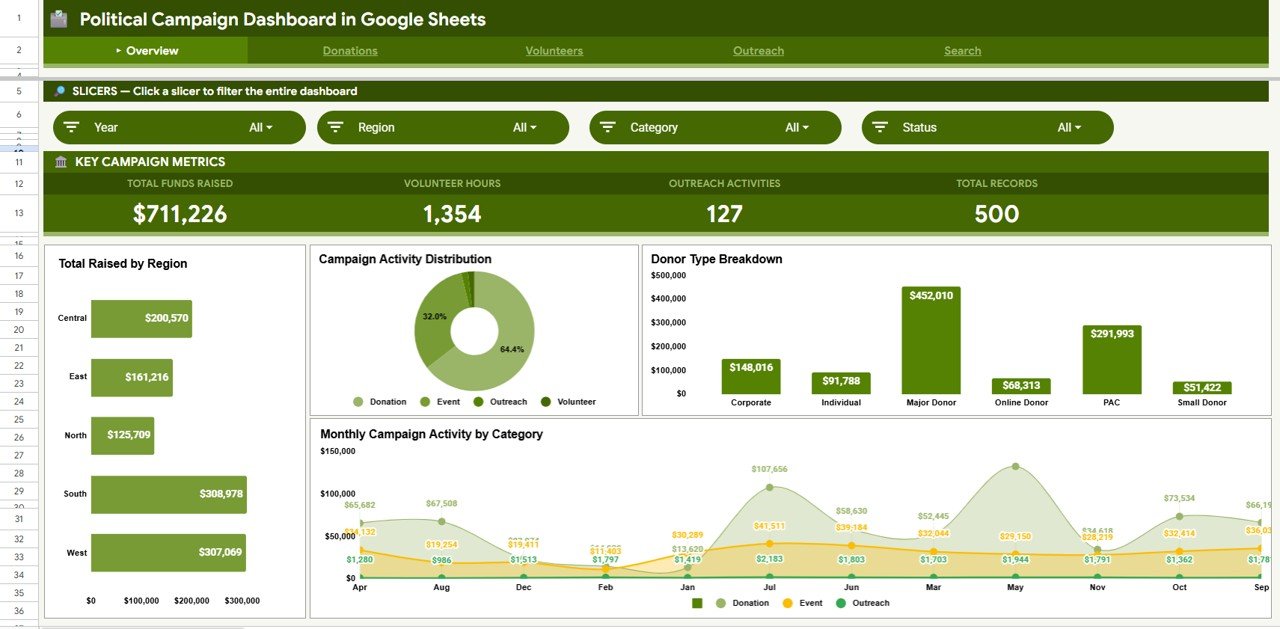
Page 1: Overview
This page displays 4 high-level KPI cards — Total Funds Raised, Volunteer Hours, Outreach Activities, and Total Records — along with 4 summary charts: Total Raised by Region, Campaign Activity by Type, Funds Raised by Donor Type, and Monthly Campaign Activity by Category. Interactive slicers at the top allow instant filtering across all visuals.
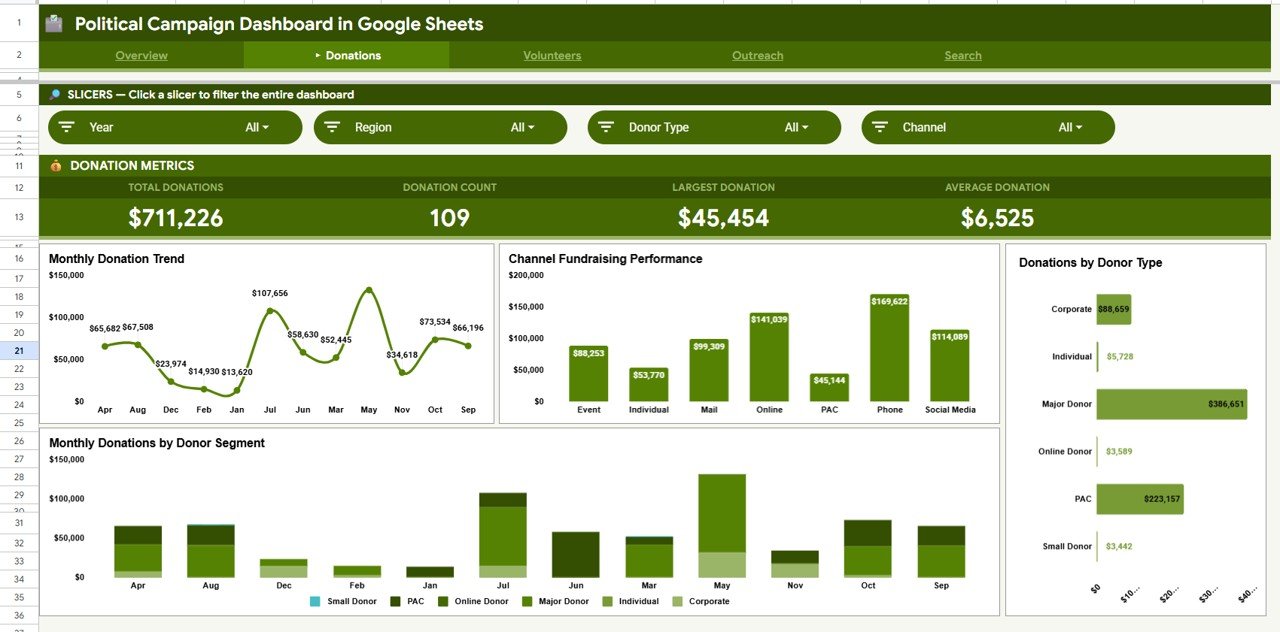
Page 2: Donations
This page provides in-depth donation analytics with 4 charts: Monthly Donation Trend, Fundraising Performance by Channel, Donations by Donor Type, and Monthly Donations by Donor Segment. Slicers allow filtering by region and donor category for targeted fundraising insights.
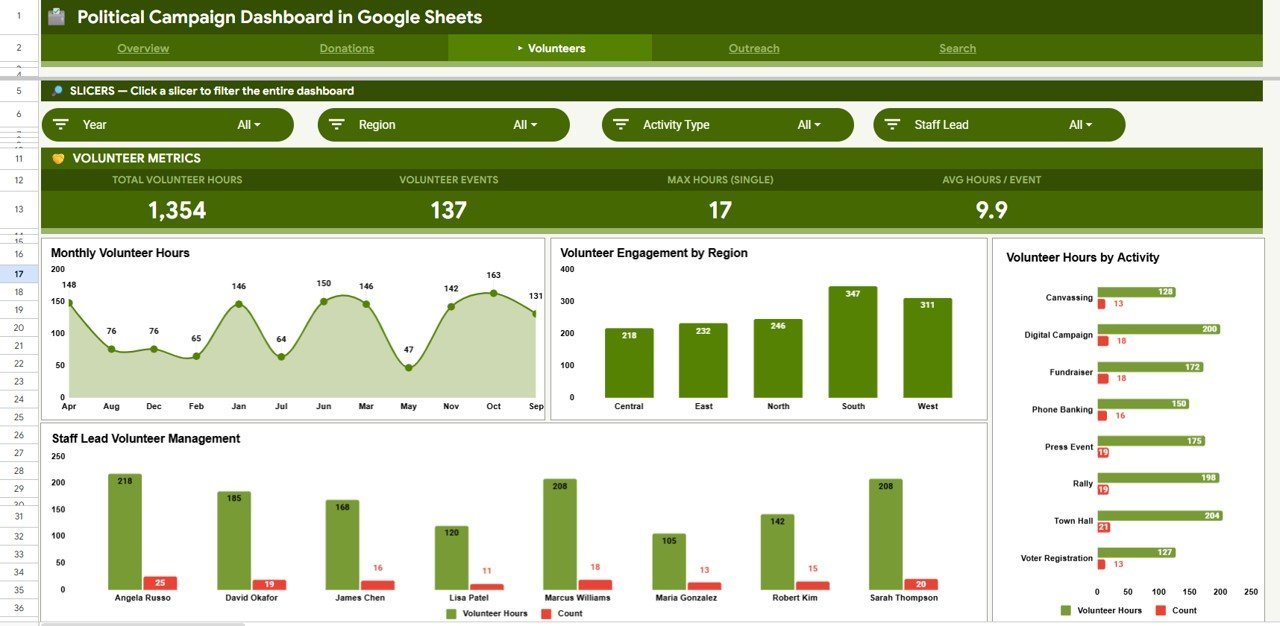
Page 3: Volunteers
This page tracks volunteer engagement with 4 charts: Monthly Volunteer Hours, Volunteer Engagement by Region, Volunteer Hours by Activity, and Volunteer Hours by Staff Lead. Quickly identify which regions and activities are generating the most volunteer time.

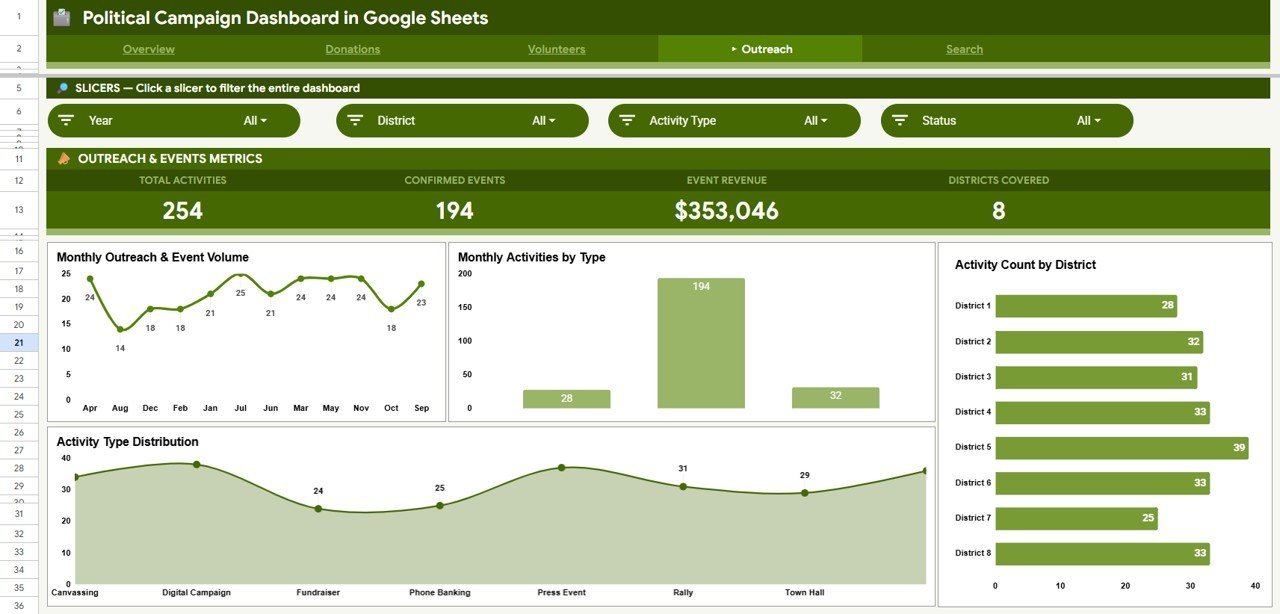
Page 4: Outreach
This page monitors campaign outreach activity with 4 charts: Monthly Outreach and Event Volume, Monthly Activities by Type, Activity Count by District, and Activity Type Distribution. Understand which districts and activity types are driving the highest engagement across the campaign.

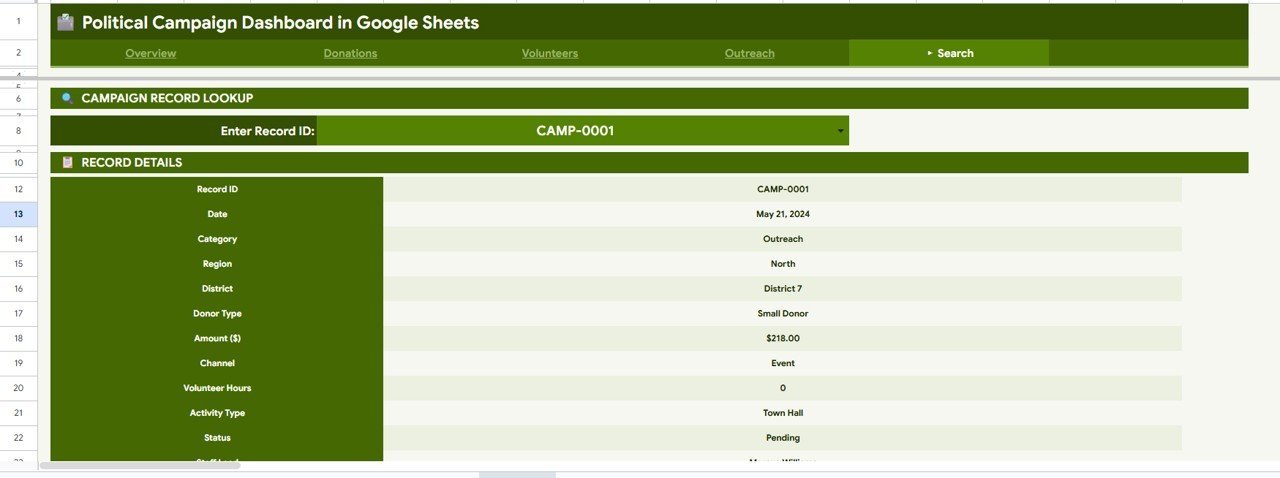
Search Sheet
Enter any Record ID and the dashboard instantly displays the full details for that record — including date, category, region, district, donor type, amount, channel, volunteer hours, activity type, status, and staff lead. No manual lookup required.

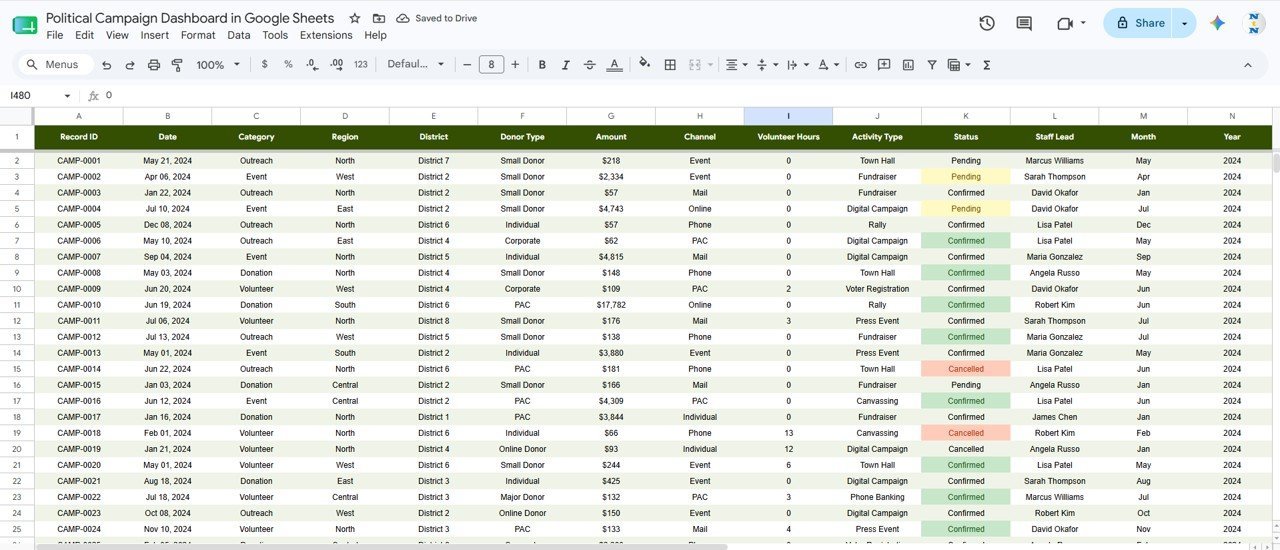
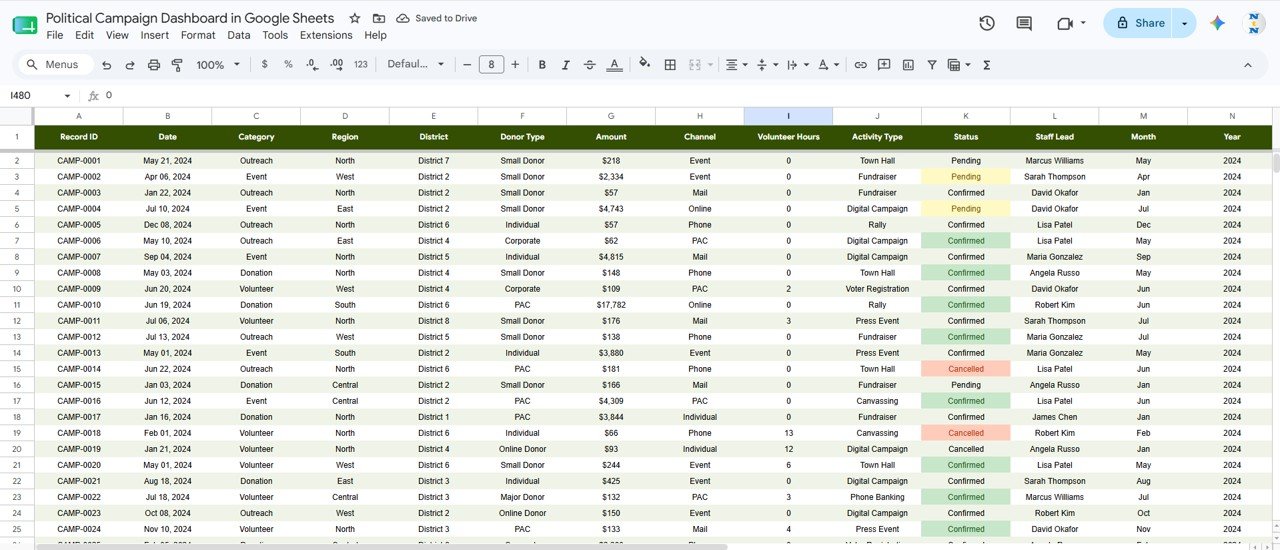
Data Sheet
This is the data entry sheet where you add your campaign records in the same column format as the sample data. All dashboards and charts update automatically as new rows are added — no formulas to edit.
📊 Political Campaign Dashboard in Google Sheets vs. Excel vs. Paid Campaign SaaS — Where This Fits
| Feature | Political Campaign Dashboard in Google Sheets | Excel Dashboard | NationBuilder / NGP VAN |
|---|---|---|---|
| Cost | $9.99 one-time | $17.99 one-time | $29–$199 / month |
| Platform | ✅ Browser-based (any device) | Windows/Mac desktop | Web-based SaaS |
| Setup time | ✅ Under 10 minutes | Under 10 minutes | 1–3 days onboarding |
| Real-time collaboration | ✅ Yes — Google Drive sharing | Limited (OneDrive) | ✅ Yes |
| Mobile access | ✅ Google Sheets mobile app | Limited | ✅ Yes |
| Customizable fields | ✅ Fully editable | ✅ Fully editable | Limited without dev |
| Share with link | ✅ Instant Google Drive link | Manual file sharing | Role-based access |
| Year-1 cost (5 users) | $9.99 total | $17.99 total | $348–$2,388 |
| No subscription | ✅ One-time purchase | ✅ One-time purchase | ❌ Monthly billing |
For campaign teams that need donation, volunteer, and outreach analytics without paying monthly SaaS fees, the Political Campaign Dashboard in Google Sheets is the practical choice.
👥 Who This Template Is For — and Who It’s Not For
✅ This template is built for:
- Campaign managers and political directors tracking donations, volunteers, and outreach activities
- Nonprofit and advocacy organizations managing fundraising and field programs
- Local and regional campaign teams that need fast, shareable reporting without expensive tools
- Google Sheets users who want a ready-made analytics dashboard without building from scratch
❌ This template is NOT for:
- Large national campaigns requiring CRM-level voter file integration (use NGP VAN)
- Teams needing automated email or SMS fundraising workflows built in
⚙️ How to Use the Political Campaign Dashboard in Google Sheets
- Purchase and download — open the included PDF for the Google Sheets copy link
- Click the copy link to create your own editable copy in Google Drive
- Go to the Data sheet and replace the sample records with your actual campaign data
- Use the slicers on the Overview, Donations, Volunteers, and Outreach pages to filter the dashboard
- Use the Search sheet to look up any record by its Record ID for full details
- Share the Google Sheets link with your campaign team for real-time collaborative access
💼 Real-World Use Cases
Maria manages a state senate campaign in the Southwest. She uses the Political Campaign Dashboard in Google Sheets to track weekly donation totals by region, monitor volunteer hours by staff lead, and present outreach activity counts to the campaign director — all without paying $99/month for NationBuilder.
David runs a nonprofit voter-registration drive. He enters each outreach event into the Data sheet and uses the Outreach page to monitor which districts are underperforming on activity count — then reallocates volunteer hours accordingly before the deadline.
A local PAC treasurer uses the Donations page to track fundraising channel performance month-by-month, quickly comparing online vs. direct mail vs. event contributions — and shares the live Google Sheets link with the board for quarterly review.
❓ Frequently Asked Questions
What KPIs does the Political Campaign Dashboard in Google Sheets track?
The Political Campaign Dashboard in Google Sheets tracks 4 core KPIs: Total Funds Raised, Volunteer Hours, Outreach Activities, and Total Records. All KPI cards and charts update automatically when you enter or update data in the Data sheet.
Do I need any Google Sheets add-ons or special software?
No. The Political Campaign Dashboard in Google Sheets is built entirely with native Google Sheets features — no add-ons, macros, or coding required. It works in any browser on any device through your Google account.
How long does setup take?
Setup takes under 10 minutes. Use the copy link from the PDF, paste your campaign data into the Data sheet, and the dashboard updates instantly. No formulas to edit or charts to configure.
How does this compare to NationBuilder or NGP VAN?
NationBuilder and NGP VAN are subscription SaaS platforms that cost $29–$199/month and include voter file integrations. The Political Campaign Dashboard in Google Sheets costs $9.99 once and covers donation tracking, volunteer analytics, and outreach reporting — ideal for local and regional campaigns that don’t need CRM-level tools.
Can I filter the dashboard by region or donor type?
Yes. Every analysis page — Overview, Donations, Volunteers, and Outreach — includes slicers you can click to instantly filter all charts and KPIs by Region, Donor Type, or Activity Type without any formula edits.
Can multiple team members use this at the same time?
Yes. Because it’s a Google Sheets file, you can share the link with your entire campaign team. Multiple users can view and edit simultaneously via Google Drive — no per-user fees apply.
👤 About the Author
Built by PK — Microsoft Certified Professional with 15+ years of Excel, Google Sheets, and Power BI experience. Founder of NextGenTemplates, reaching 300K+ subscribers across YouTube channels (@PK-AnExcelExpert, @NextGenTemplates, @NeoTechNavigators). Every template is hand-built and tested before release.
🔗 Explore Related Templates
Looking for more campaign and analytics templates? Explore these related products:
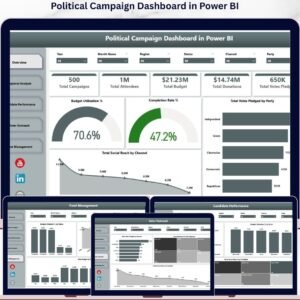
- Political Campaign Dashboard in Power BI — the same analytics in a Power BI format with advanced slicers and drill-through
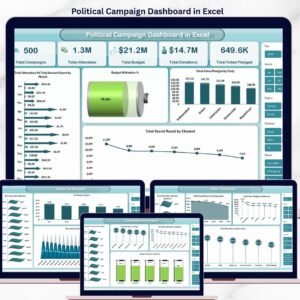
- Political Campaign Dashboard in Excel — the Excel version with pivot-driven charts and VBA-free design
- Drop Shipping Dashboard in Google Sheets — another multi-page Google Sheets analytics dashboard
Also available as: Excel version | Power BI version
Browse all Google Sheets Dashboards →
📖 Click here to read the Detailed Blog Post
Watch the step-by-step video Demo:
🎥 Visit our YouTube channel for step-by-step video tutorials
👉 YouTube.com/@NeoTechNavigators


Reviews
There are no reviews yet.