


The Plumbing Contractor Dashboard in Google Sheets tracks 4 headline KPIs and 13 interactive charts across 6 working tabs, turning your raw job log into a live picture of revenue, jobs, technicians and material costs. Setup takes under 10 minutes — replace the sample rows in the Data sheet and every card, chart and slicer updates automatically.
🌍 Join 8,400+ teams in 40+ countries using NextGenTemplates to replace paid SaaS tools with one-time-purchase Excel, Google Sheets, Power BI, and HTML templates.
✅ Instant download · One-time payment · No subscription · No per-user fees · Lifetime access
🔑 Key Features of the Plumbing Contractor Dashboard in Google Sheets
This Google Sheets plumbing dashboard tracks 4 KPIs — Completed Revenue, Total Jobs, Average Job Value and Completed Jobs — on a single Overview tab, so you see the health of the business the moment you open the file.
Across the Jobs, Revenue and Technicians tabs it builds 13 charts covering revenue by month, region, job category and service type, plus jobs by status, revenue vs material cost, and per-technician revenue, job count and labor hours.
Slicers at the top of the Overview let you filter by region, service type or job category with a click, redrawing every chart instantly — no formulas to edit. A dedicated Search tab returns any job’s full record from a single Job ID.
📦 What’s Inside the Plumbing Contractor Dashboard in Google Sheets
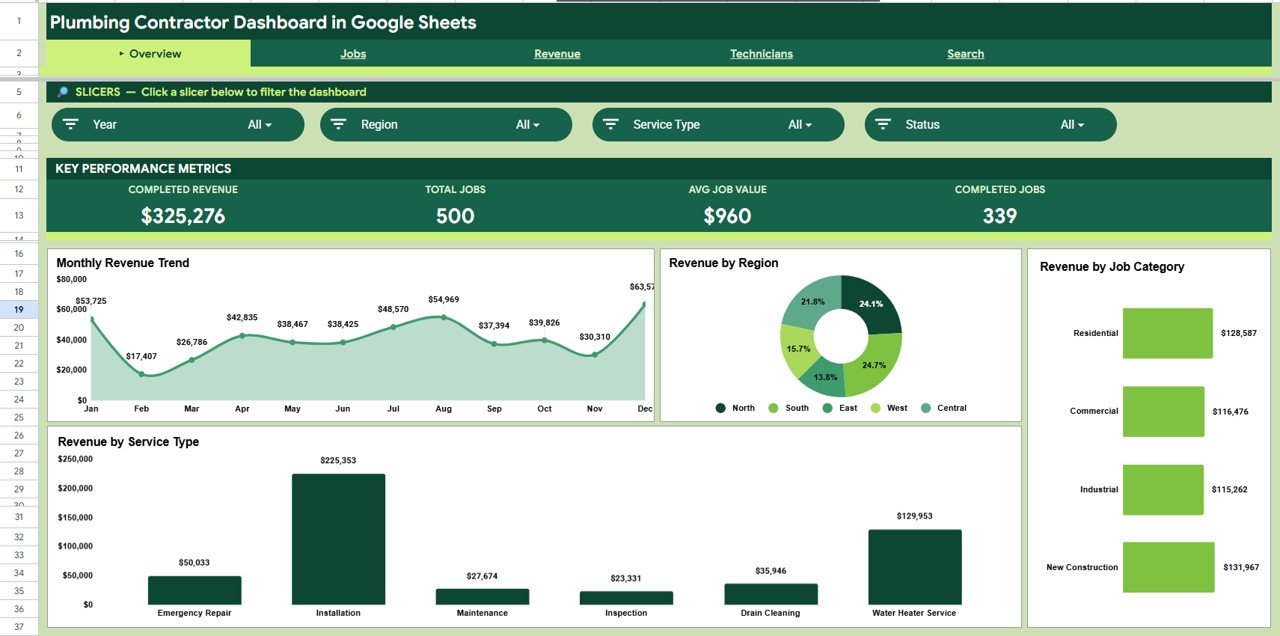
Page 1: Overview
The Overview tab shows four KPI cards — Completed Revenue, Total Jobs, Avg Job Value and Completed Jobs — above four charts: Revenue by Month, Revenue by Region, Revenue by Job Category and Revenue by Service Type. Slicers let you filter the whole page instantly.
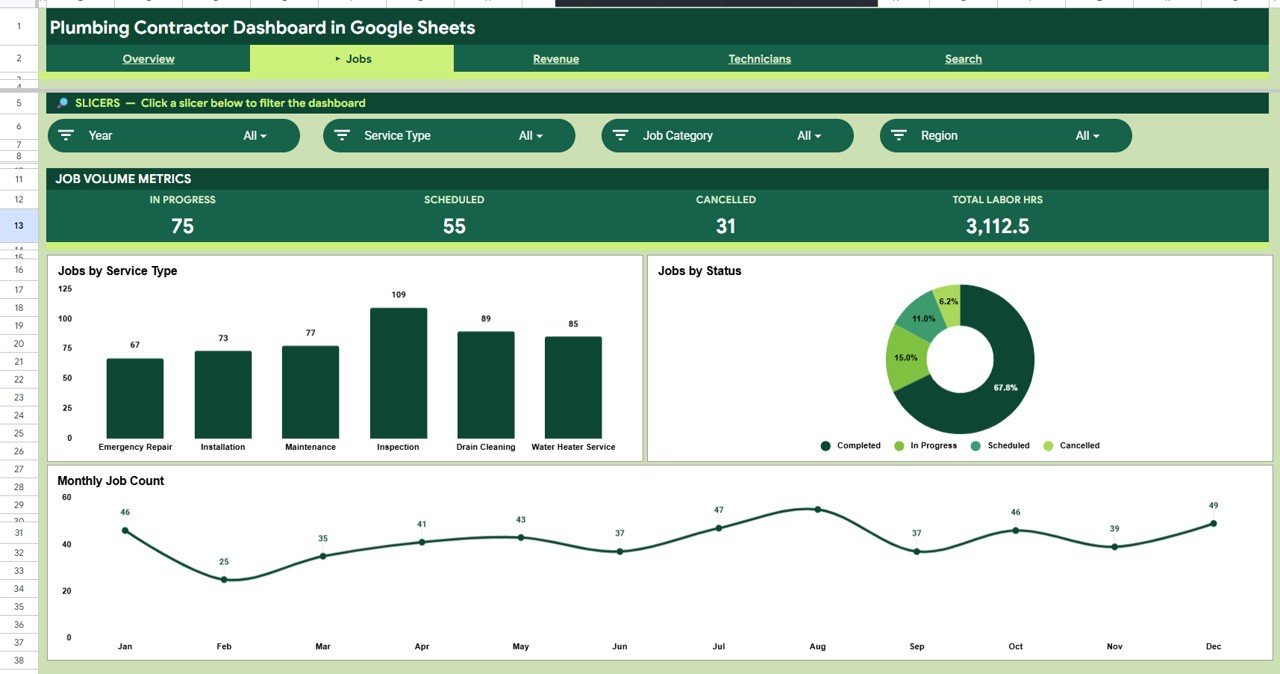
Page 2: Jobs
The Jobs tab breaks the workload down with Jobs by Service Type, Jobs by Status and Job Count by Month, so you can see your mix of repairs, installs and maintenance and how completed vs pending jobs trend over time.
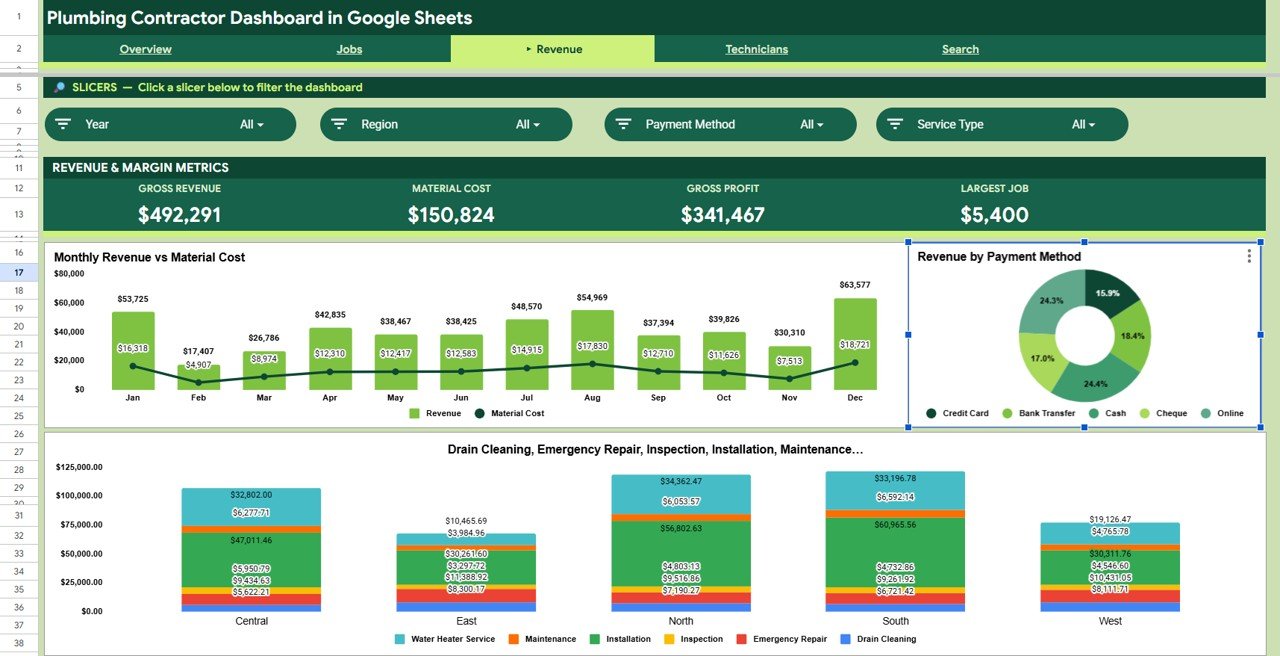
Page 3: Revenue
The Revenue tab compares Revenue vs Material Cost by Month, then splits income by Revenue by Payment Method and Revenue by Region and Service Type — so you can spot your most profitable work and where margins are thin.
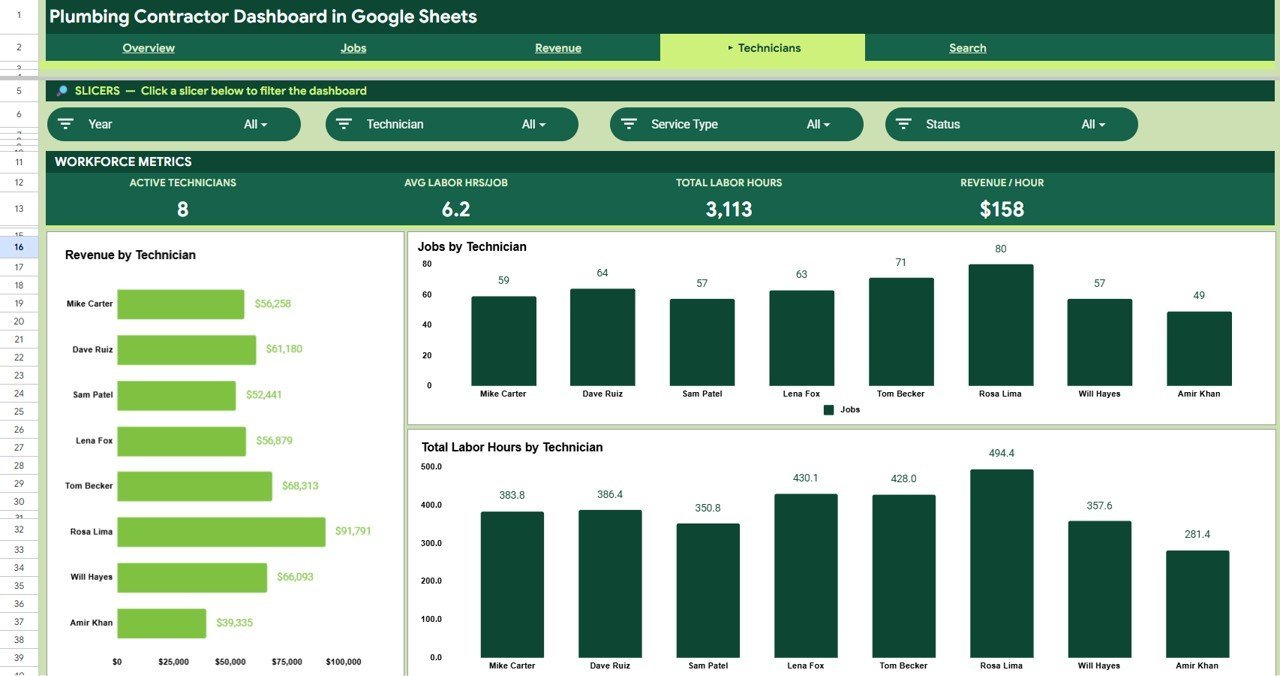
Page 4: Technicians
The Technicians tab ranks your crew with Revenue by Technician, Jobs by Technician and Total Labor Hours by Technician, making it easy to see who is driving income and how workload is balanced across the team.

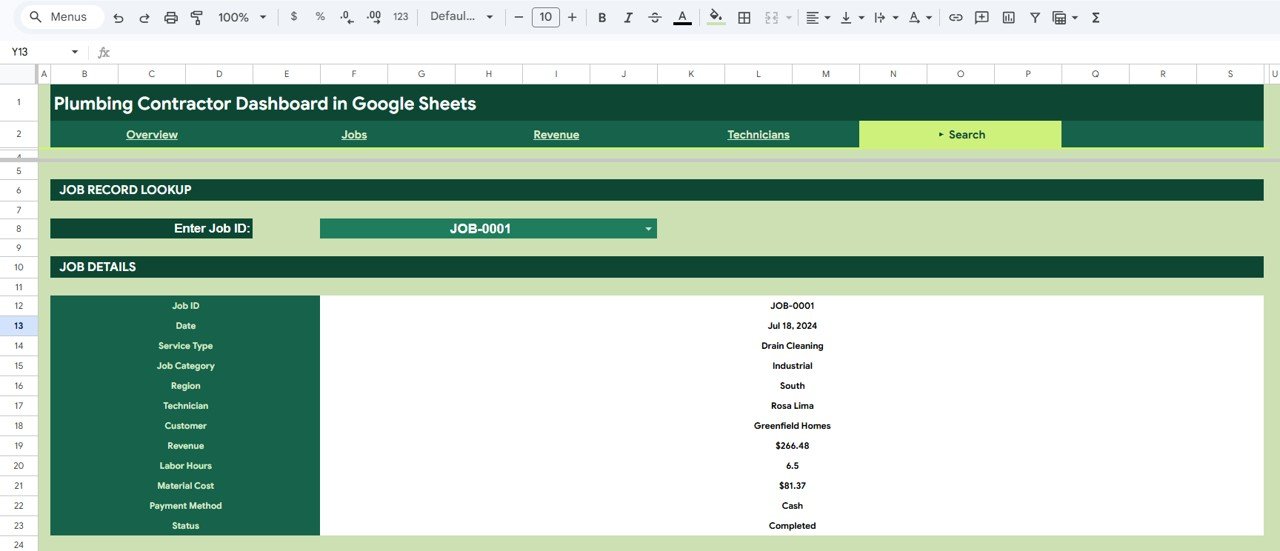
Page 5: Search Sheet
The Search tab is a Job Record Lookup: select or type any Job ID and it returns the full record — Date, Service Type, Job Category, Region, Technician, Customer, Revenue, Labor Hours, Material Cost, Payment Method and Status.
Page 6: Data Sheet
The Data tab is where you enter each job in the same column format used by the template. Add rows here and every KPI, chart and slicer across the dashboard updates automatically.

📊 Plumbing Contractor Dashboard in Google Sheets vs. Excel Dashboard vs. Field-Service SaaS — Where This Fits
| Feature | Plumbing Contractor Dashboard (Google Sheets) | Microsoft Excel Dashboard | ServiceTitan / Jobber / Housecall Pro |
|---|---|---|---|
| Cost | $9.99 one-time | $17.99 one-time | $49-300 / user / month |
| Platform | Google Sheets (cloud) | Desktop Excel file | Proprietary web + app |
| Setup time | ✅ Under 10 minutes | Under 10 minutes | Days to weeks of onboarding |
| Real-time team collaboration | ✅ Built-in (Google Drive) | Limited / needs OneDrive | ✅ Yes |
| Mobile access | ✅ Sheets app, any device | Excel mobile only | ✅ Native app |
| Customizable fields | ✅ Fully editable | ✅ Fully editable | Limited to vendor schema |
| Share with a link | ✅ One Drive link | Send file attachment | ✅ Account logins |
| Year-1 cost at 5 users | ✅ $9.99 total | $17.99 total | $2,940-18,000 |
| Owns your data | ✅ Your Google account | ✅ Your file | Stored on vendor servers |
For plumbing contractors who want live job and revenue tracking without paying $49+ per user every month for field-service software, the Plumbing Contractor Dashboard in Google Sheets sits in the sweet spot.
👥 Who This Template Is For — and Who It’s Not For
✅ This template is built for:
- Independent plumbers and small plumbing companies (1-25 technicians) tracking jobs and revenue
- Owners who want one dashboard for service calls, repairs, installs and maintenance work
- Office managers who report monthly revenue, job counts and technician performance
- Service businesses already living in Google Workspace who want zero new software to learn
❌ This template is NOT for:
- Large field-service operations needing automated dispatch, GPS routing and live customer SMS
- Teams that require integrated invoicing, payment processing and inventory in one system
- Anyone who wants automatic call-booking — this is a tracking and reporting dashboard, not a CRM
⚙️ How to Use the Plumbing Contractor Dashboard in Google Sheets
- Open the PDF in your download and click the Google Sheets copy link to save your own editable copy to Google Drive.
- Go to the Data tab and replace the sample rows with your own jobs, keeping the same column format.
- Return to the Overview tab — the 4 KPI cards and charts update automatically.
- Use the slicers to filter by region, service type or job category and read the filtered view.
- Open the Search tab and enter a Job ID to pull any job’s full record.
💼 Real-World Use Cases
Mike runs a 6-technician plumbing company. He uses the Plumbing Contractor Dashboard in Google Sheets to track monthly completed revenue, see which regions bring the most installs, and review revenue per technician at his Friday team meeting — without paying $99 per user per month for field-service software.
Dana manages the office for a family plumbing business. Each month she filters the Overview by service type to report on emergency call-outs vs scheduled maintenance, then uses the Revenue tab to compare income against material cost and protect margins.
Sam is a solo plumber. He logs every job in the Data tab from his phone and uses the Search sheet to instantly recall a customer’s past job details when they call back.
❓ Frequently Asked Questions
What KPIs does the Plumbing Contractor Dashboard in Google Sheets track?
The Plumbing Contractor Dashboard in Google Sheets tracks 4 headline KPIs — Completed Revenue, Total Jobs, Average Job Value and Completed Jobs — plus 13 charts covering revenue, jobs, material cost and technician performance. All metrics update automatically when you replace the sample data.
How long does setup take?
Setup takes under 10 minutes. Make your own copy of the Plumbing Contractor Dashboard in Google Sheets, paste your jobs into the Data tab using the existing column format, and every KPI card, chart and slicer redraws automatically.
How does this compare to field-service software like Jobber or ServiceTitan?
Field-service platforms cost $49-300 per user each month and include dispatch and invoicing. The Plumbing Contractor Dashboard in Google Sheets is a one-time $9.99 reporting tool — ideal if you want clear job and revenue analytics without an ongoing subscription.
Do I need Excel or any special software?
No. The Plumbing Contractor Dashboard in Google Sheets runs entirely in Google Sheets through a free Google account, so it opens on any desktop, tablet or phone with no extra software to install.
Can I filter the dashboard by region or service type?
Yes. The Overview tab includes slicers for region, service type and job category. Click any value and the Plumbing Contractor Dashboard in Google Sheets refilters every KPI and chart instantly.
Can my whole team use it at once?
Yes. Because the Plumbing Contractor Dashboard in Google Sheets lives in Google Drive, you can share one link and your technicians and office staff can view or edit together in real time.
👤 About the Author
Built by PK — Microsoft Certified Professional with 15+ years of Excel, Google Sheets, and Power BI experience. Founder of NextGenTemplates, reaching 300K+ subscribers across YouTube channels (@PK-AnExcelExpert, @NextGenTemplates, @NeoTechNavigators). Every template is hand-built and tested before release.
🔗 Explore Related Templates
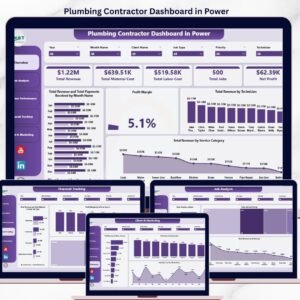
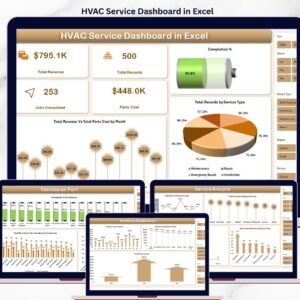
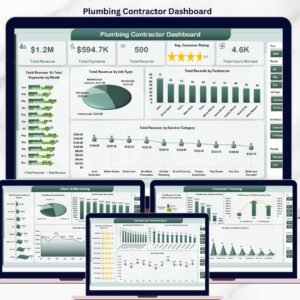
Prefer a different platform? This dashboard is also available as the Plumbing Contractor Dashboard in Excel and the Plumbing Contractor Dashboard in Power BI. Run another trade? See the HVAC Service Dashboard in Excel. For adjacent service workflows, try the Home Inspection Dashboard in Google Sheets or the Renovation Request Tracker in Google Sheets. Browse more Google Sheets Dashboards.
📖 Click here to read the Detailed Blog Post
Watch the step-by-step video tutorial:
🎥 Visit our YouTube channel for step-by-step video tutorials
👉 YouTube.com/@NextGenTemplates


Reviews
There are no reviews yet.