

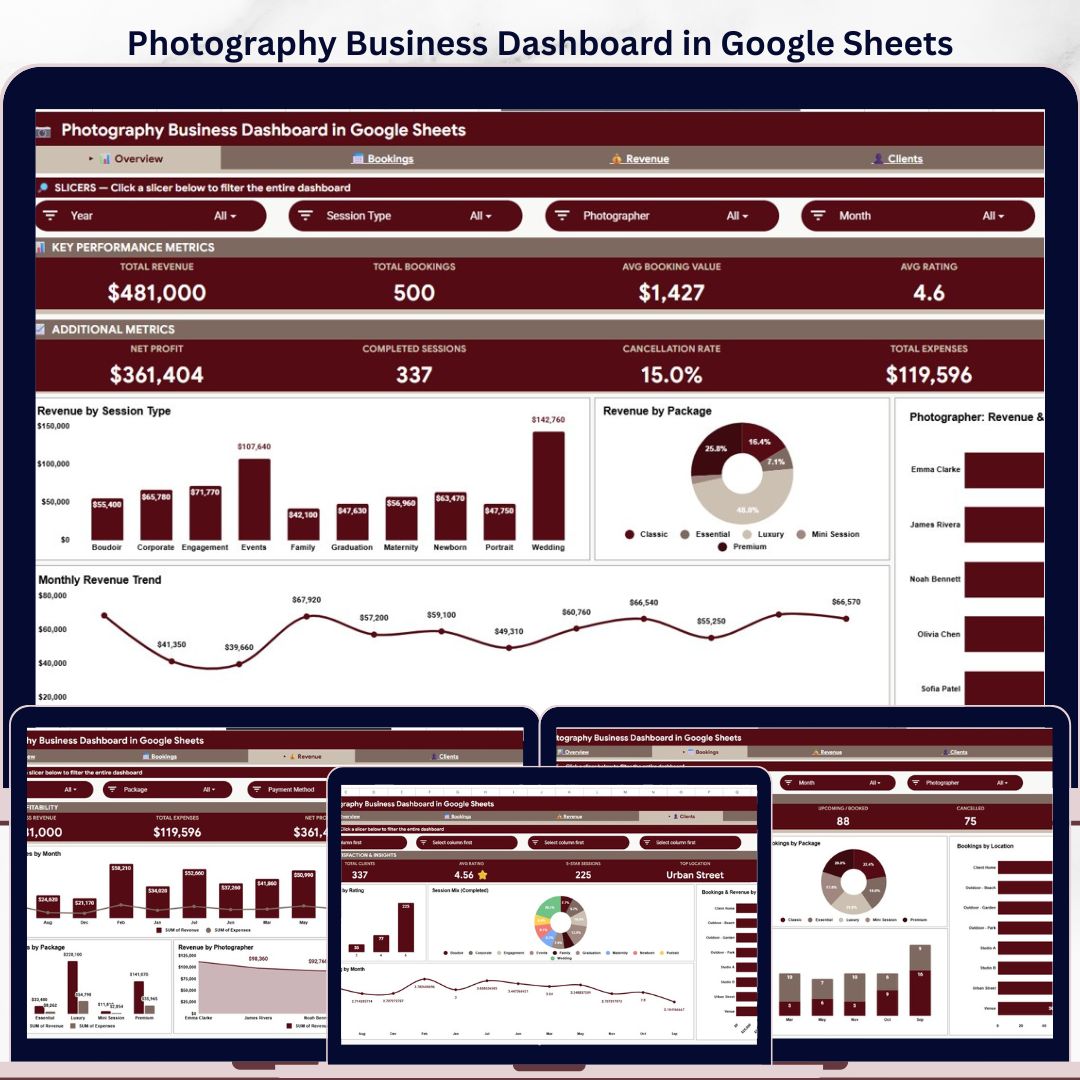

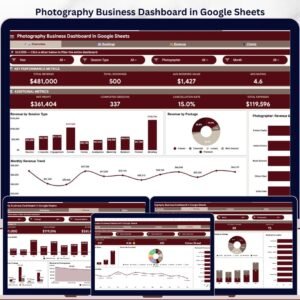
The Photography Business Dashboard in Google Sheets gives photography studios, freelance photographers, and creative service teams a 6-tab reporting system with 8 headline cards, 16 chart views, slicer-based filtering, a Booking ID search tab, and a structured data sheet. A studio handling 25 sessions per month creates 300+ booking records per year, so tracking revenue, booking volume, session mix, profit, expenses, cancellations, and ratings in one place can prevent a lot of quiet leakage. Built by NextGenTemplates and used by spreadsheet-first teams that prefer one-time template purchases over recurring SaaS subscriptions, this Google Sheets dashboard helps you review the business without giving up ownership of your data.
Key Features of Photography Business Dashboard in Google Sheets
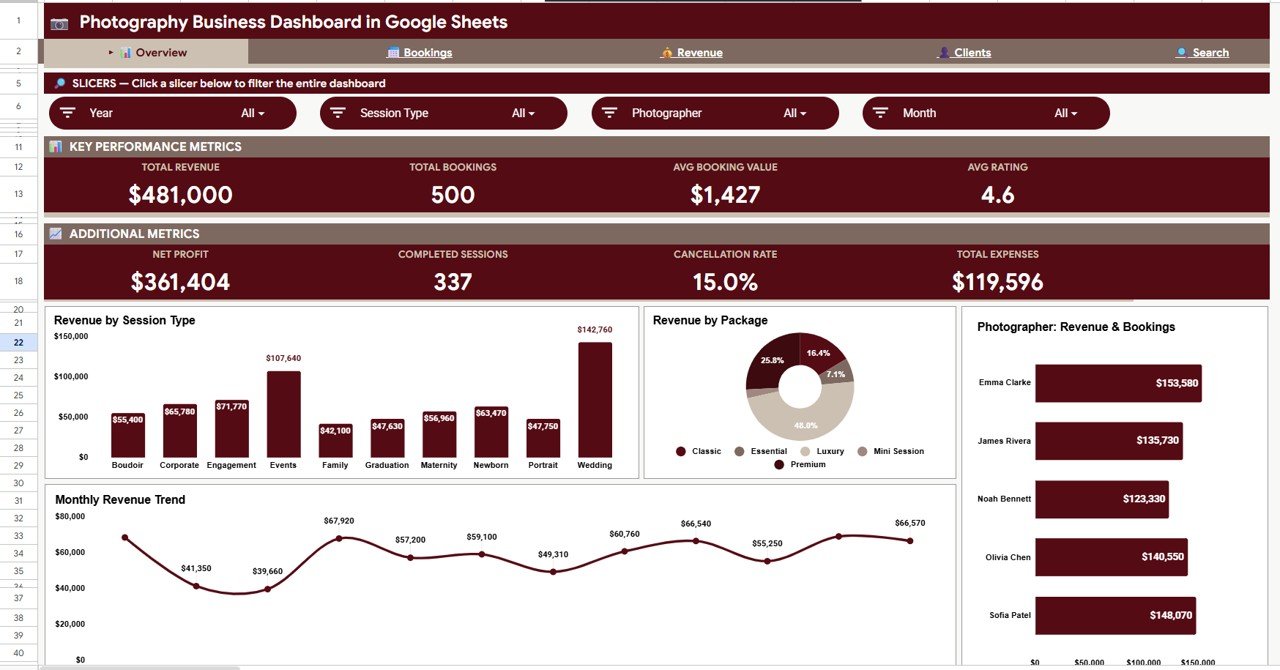
8 executive KPI cards: The Overview page displays Total Revenue, Total Bookings, Avg Booking Value, Avg Rating, Net Profit, Completed Sessions, Cancellation Rate, and Total Expenses. These cards give studio owners a fast read on business health before they drill into charts.
6 practical Google Sheets tabs: The workbook includes Overview, Bookings, Revenue, Clients, Search, and Data tabs. That structure keeps reporting, lookup, and raw data entry separated so the file stays easier to maintain.
16 ready-made chart views: The dashboard covers session type, package, photographer, month, location, status, expense, rating, and client mix analysis. You can review bookings, revenue, profit, and service quality from multiple angles without building charts from scratch.
Multiple slicers for fast filtering: Slicers help you filter the dashboard quickly by the available fields in the workbook. This is useful when you want to compare wedding shoots, portraits, events, photographers, packages, locations, or time periods.
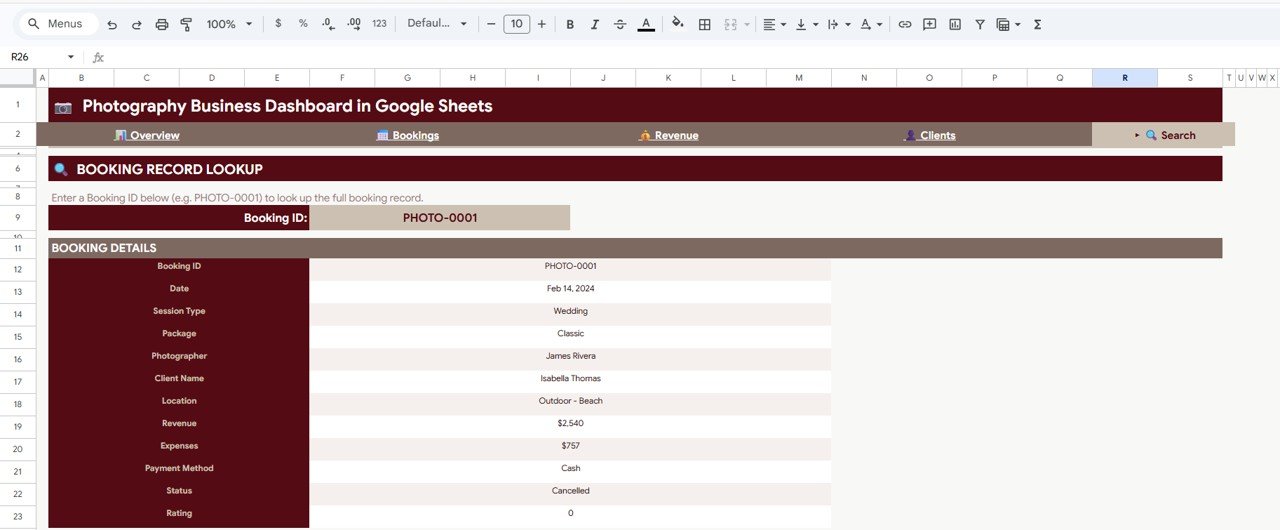
Booking ID search tab: The Search tab lets you enter a Booking ID and return the full booking record, including date, session type, package, photographer, client name, location, revenue, expenses, payment method, status, and rating.
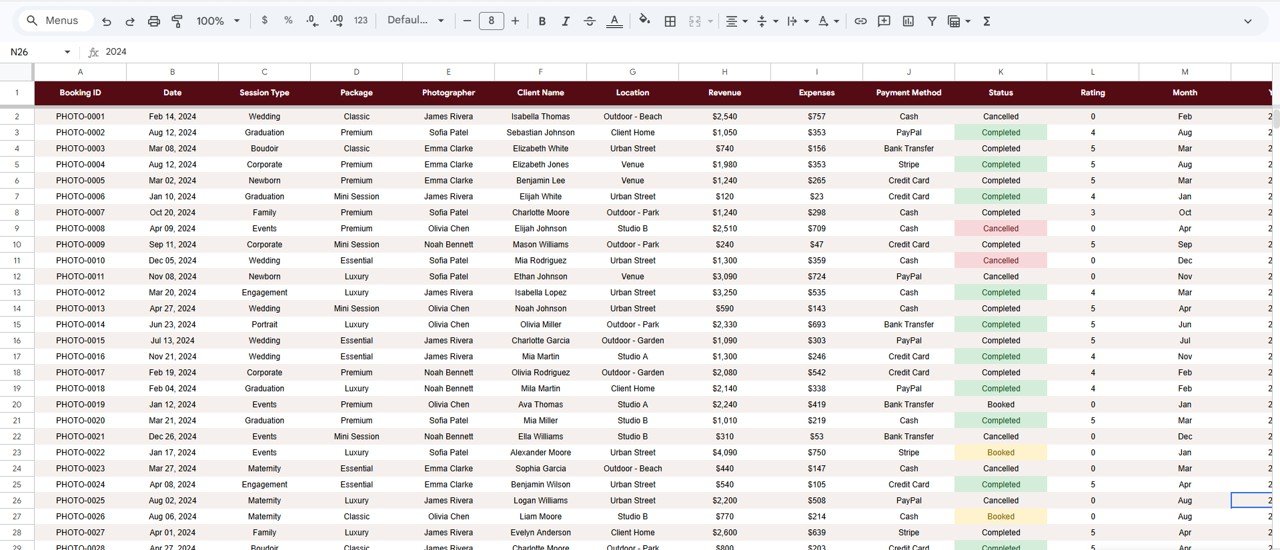
Editable data sheet: The Data tab is where you add your own records in the same format. Once your data follows the provided structure, the dashboard pages can refresh around your actual photography business activity.
What’s Inside the Photography Business Dashboard in Google Sheets
1. Overview Page
The Overview page starts with the main cards: Total Revenue, Total Bookings, Avg Booking Value, Avg Rating, Net Profit, Completed Sessions, Cancellation Rate, and Total Expenses. These KPIs help you understand revenue, profitability, workload, service quality, and delivery performance at a glance.
Revenue by Session Type: Shows which photography services bring in the most revenue, such as weddings, portraits, events, products, or commercial sessions. Use it to decide which session types deserve more marketing attention.
Revenue by Package: Compares revenue across packages so you can see whether basic, standard, premium, or custom offers are carrying the business. This helps you refine package pricing and promotion strategy.
Revenue and Bookings by Photographer: Shows both sales value and booking volume by photographer. It helps studio owners review utilization, assignment balance, and revenue contribution by team member.
Monthly Revenue Trend: Tracks revenue movement over time. Use it to spot seasonal demand, campaign impact, and slow months that need extra sales effort.
2. Bookings Sheet Tab
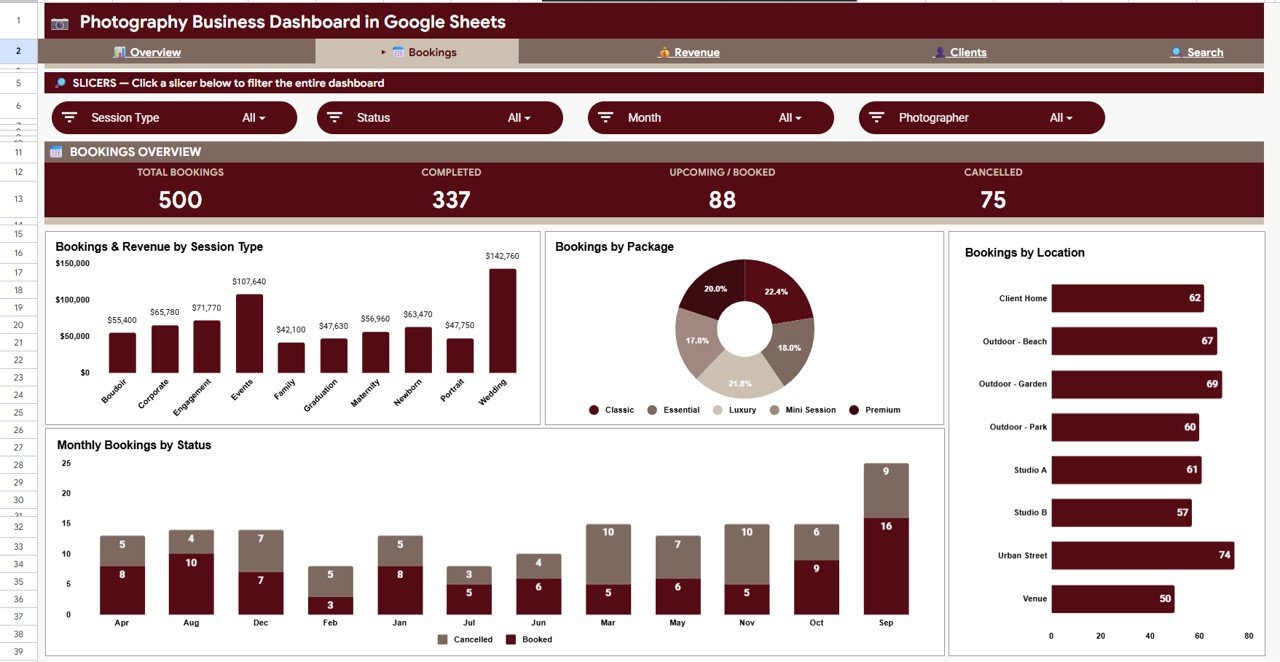
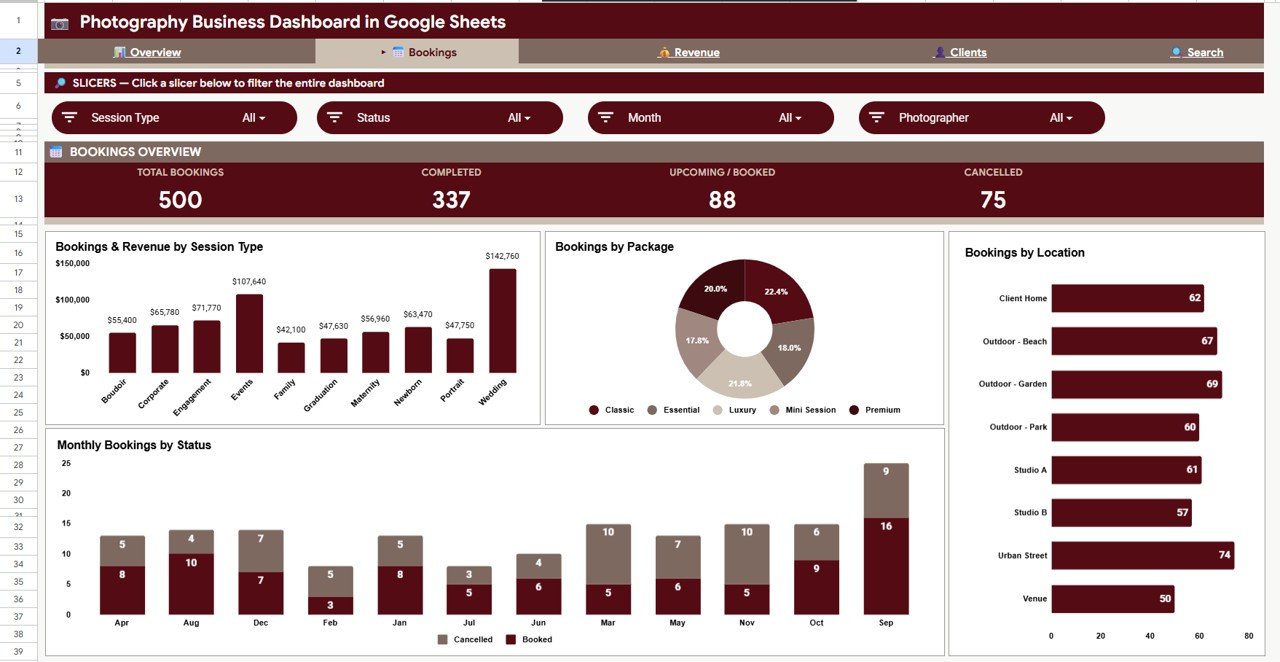
The Bookings tab focuses on demand and booking behavior. It includes Bookings and Revenue by Session Type, Bookings by Package, Bookings by Location, and Monthly Bookings by Status.
Bookings and Revenue by Session Type: Connects volume with revenue so you can see whether high-demand services are also financially meaningful. This is helpful for prioritizing your service menu.
Bookings by Package: Shows which packages clients choose most often. It can reveal if buyers are clustering around entry-level offers or upgrading into higher-value packages.
Bookings by Location: Breaks bookings down by location. Use it to identify your strongest local markets and plan travel, studio slots, or ad targeting.
Monthly Bookings by Status: Shows completed, pending, cancelled, or other status movement by month. This makes cancellation trends and delivery pipeline issues easier to see.
3. Revenue Sheet Tab
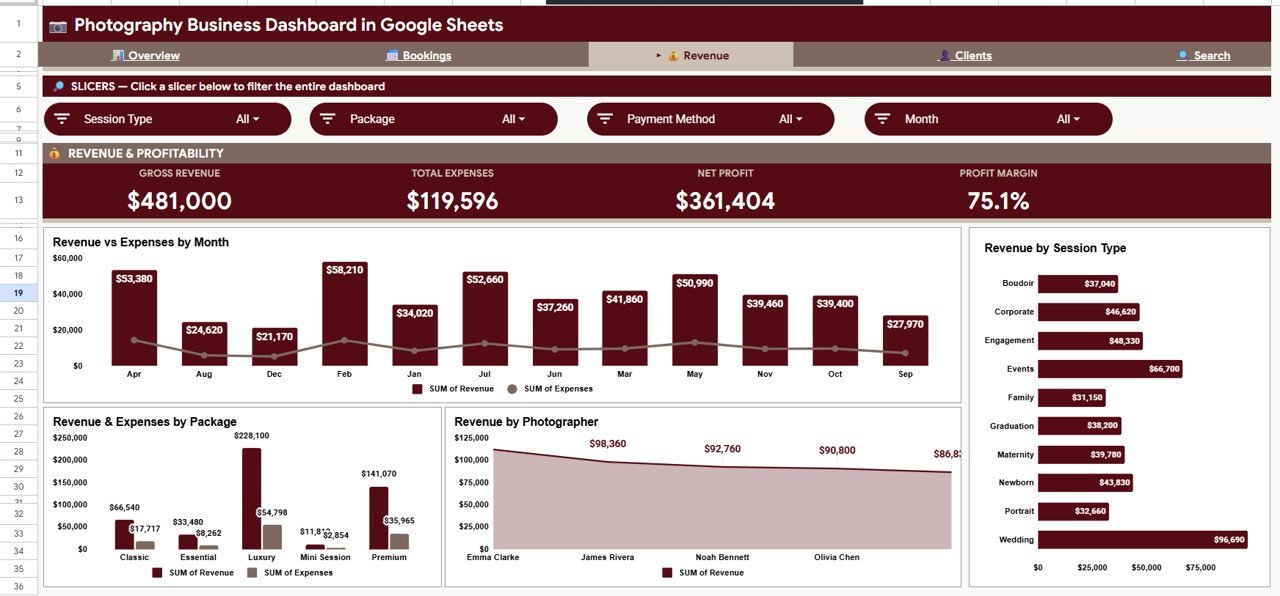
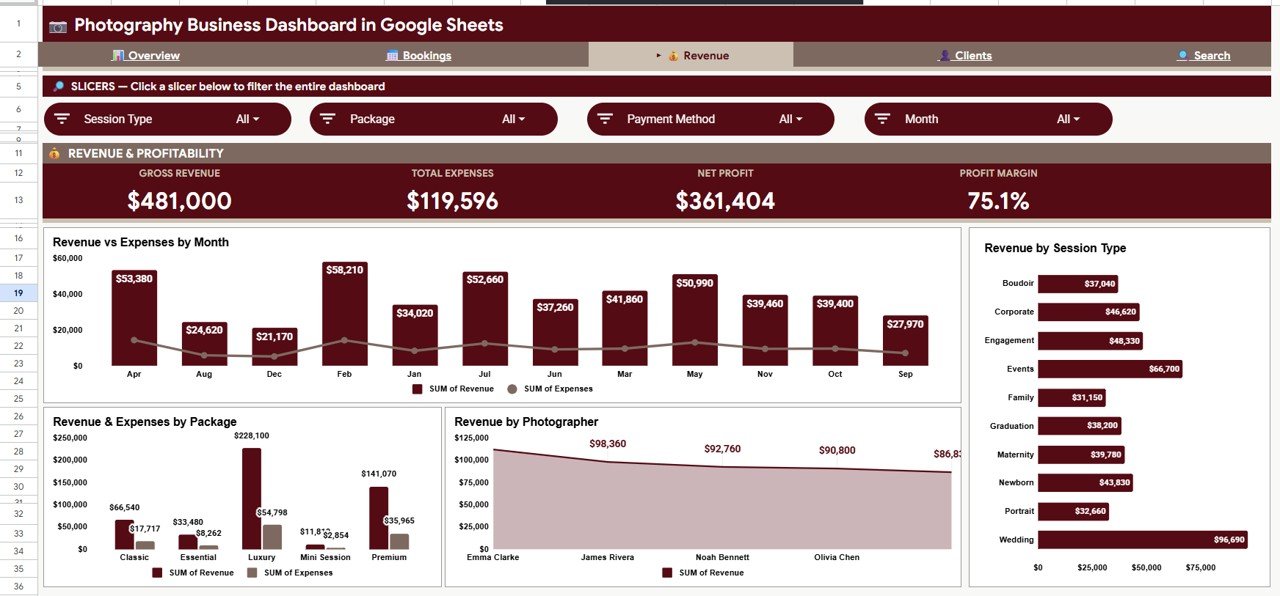
The Revenue tab is built for financial analysis. It includes Revenue vs Expenses by Month, Revenue and Expenses by Package, Revenue by Photographer, and Revenue by Session Type.
Revenue vs Expenses by Month: Compares income and cost over time. This helps you see whether busy months are actually profitable or just expensive.
Revenue and Expenses by Package: Compares package-level revenue against expenses. Use it to check which packages deserve a price increase or a cost review.
Revenue by Photographer: Shows the revenue contribution of each photographer. It supports better team planning, incentive design, and workload review.
Revenue by Session Type: Highlights the session categories that drive the most sales. This is useful for content planning, ad budget allocation, and service positioning.
4. Clients Sheet Tab
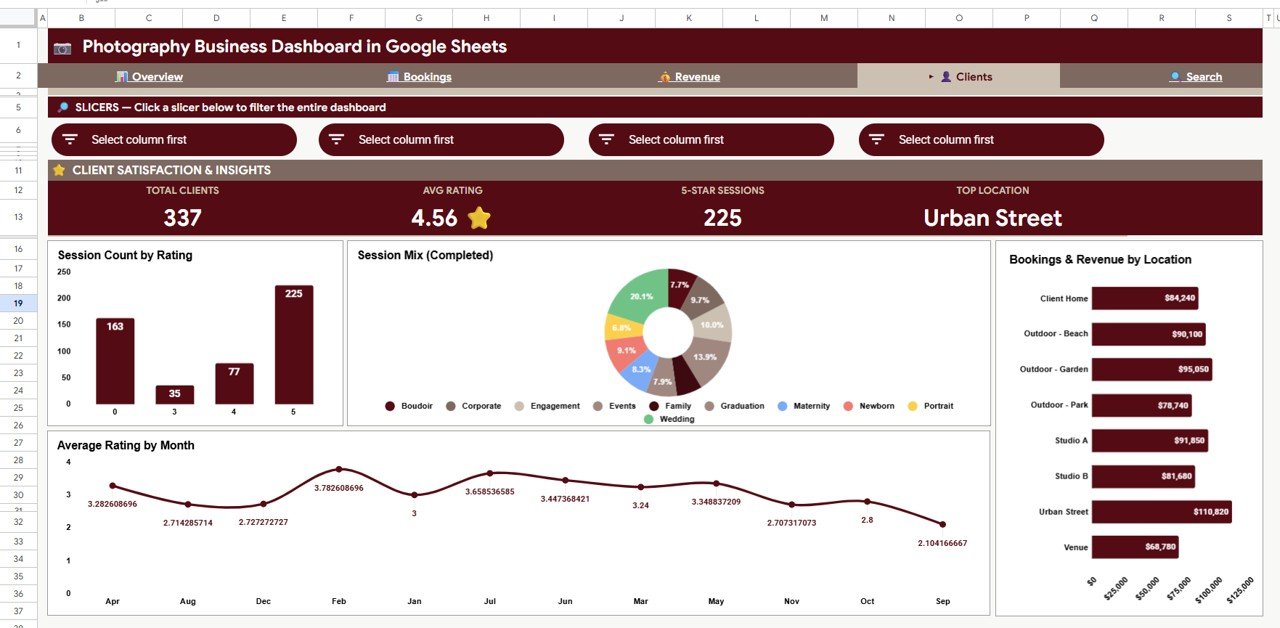
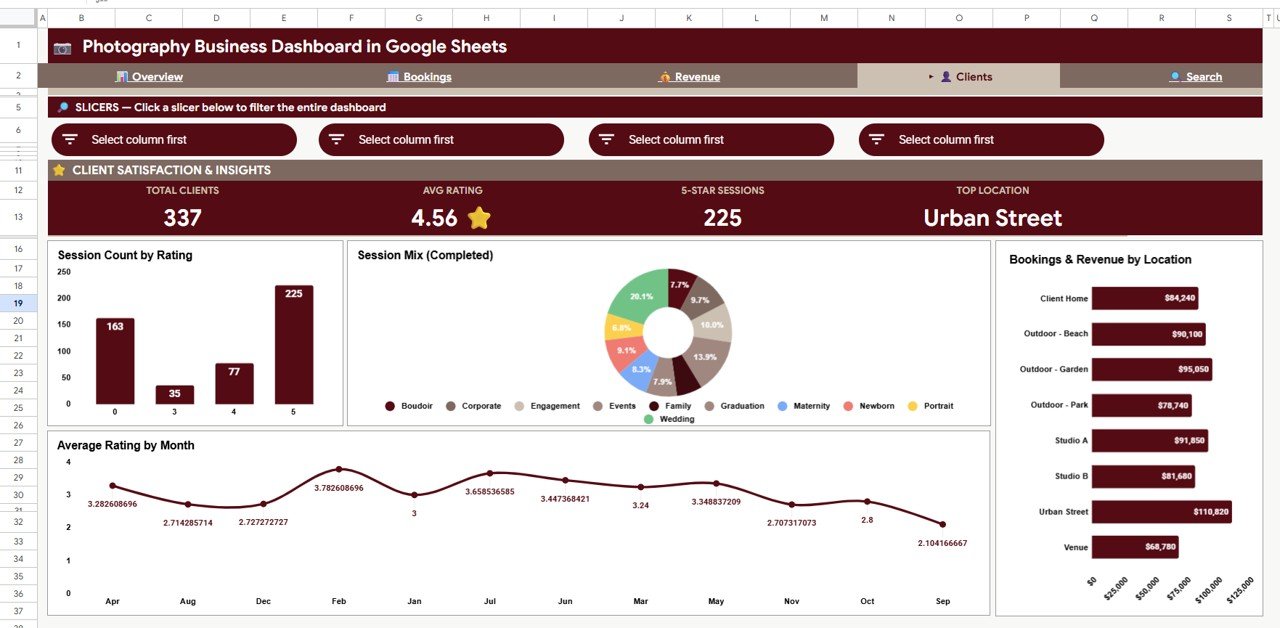
The Clients tab helps you understand booking quality and client behavior. It includes Session Count by Rating, Session Mix by Session Type, Bookings and Revenue by Location, and Average Rating by Month.
Session Count by Rating: Shows how many sessions fall into each satisfaction rating. This makes client experience patterns easier to monitor after delivery.
Session Mix by Session Type: Breaks down the type of work your studio is doing most often. Use it to balance your portfolio and marketing focus.
Bookings and Revenue by Location: Links location demand with revenue outcomes. This is useful when deciding where to run local campaigns or accept travel bookings.
Average Rating by Month: Tracks service quality over time. If ratings dip during high-volume months, it can point to scheduling or delivery pressure.
5. Search Sheet Tab
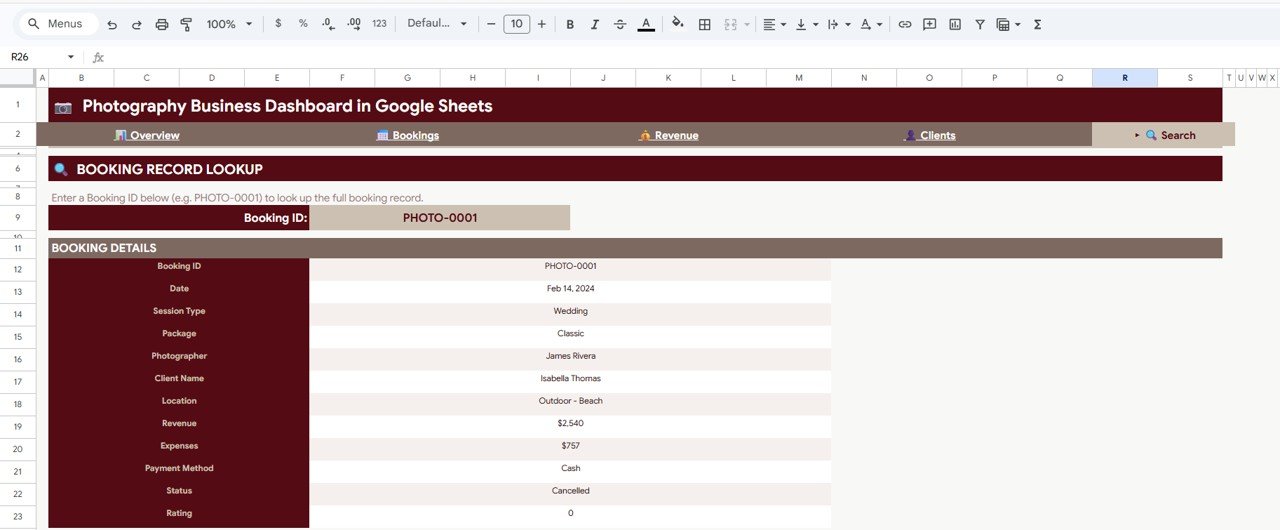
The Search tab lets you enter a Booking ID and look up the full booking record without scrolling through the data sheet. It returns details such as Booking ID, Date, Session Type, Package, Photographer, Client Name, Location, Revenue, Expenses, Payment Method, Status, and Rating.
6. Data Sheet Tab
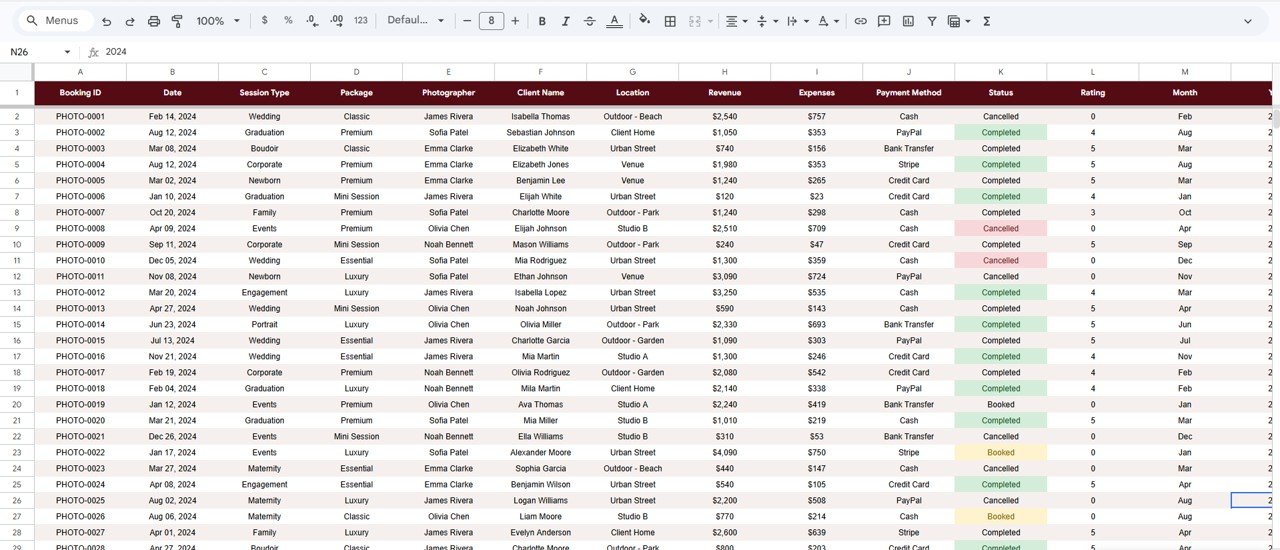
The Data sheet is where you add your photography booking data in the same format provided in the template. Keep the columns consistent so the cards, charts, slicers, and search lookup continue to work as expected.
Photography Business Dashboard in Google Sheets vs. Microsoft Excel Dashboard vs. Paid CRM/SaaS – Where This Fits
| Feature | Photography Business Dashboard in Google Sheets | Microsoft Excel Dashboard | Paid CRM/SaaS |
|---|---|---|---|
| Cost | $9.99 one-time sale price | One-time template cost | Usually monthly |
| Platform | Google Sheets in browser | Microsoft Excel desktop or web | Vendor cloud app |
| Setup time | Start by copying the sheet and replacing sample data | Open workbook and refresh pivots | Onboarding and configuration |
| Team collaboration | Native Google Sheets sharing | Best with OneDrive or SharePoint | Usually included |
| Mobile access | Google Sheets app | Excel app with limitations | Usually included |
| Customizable fields | Editable sheet structure | Editable workbook structure | Limited by vendor plan |
| Share with link | Yes, through Google Drive permissions | Yes, through Microsoft sharing | Depends on vendor |
| Year-1 cost at 5 users | $9.99 plus your Google account | Template cost plus Microsoft licensing if needed | Can run hundreds of dollars per year |
| Booking ID lookup | Included Search tab | Requires workbook design | Usually included |
| Photography-specific charts | Included | Depends on template | Often generic reporting |
Who This Template Is For – and Who It’s Not For
Best for: freelance photographers, wedding studios, portrait studios, commercial photography teams, event photographers, and small creative agencies that already track bookings in spreadsheets and want a cleaner reporting layer.
Not ideal for: teams needing contract signing, automated invoicing, client portals, online galleries, or payment processing inside the same system. For that, a photography CRM may be a better fit, and this dashboard can still support the analytics layer.
How to Use the Photography Business Dashboard in Google Sheets
- Open the included copy guide and create your own editable copy in Google Drive.
- Go to the Data sheet and replace the sample rows with your booking records.
- Keep the same column format for Booking ID, Date, Session Type, Package, Photographer, Client Name, Location, Revenue, Expenses, Payment Method, Status, and Rating.
- Use the Overview, Bookings, Revenue, and Clients tabs to review charts and KPI cards.
- Use slicers to filter the dashboard by the fields available in the workbook.
- Use the Search tab when you need to find one specific Booking ID quickly.
Real-World Use Cases
Maya, a wedding photographer: Maya reviews Monthly Revenue Trend and Bookings by Package each Friday to see whether premium wedding packages are growing. She uses the insight to adjust her website offer order.
Jordan, a portrait studio owner: Jordan tracks Average Rating by Month and Session Count by Rating after every campaign. If ratings drop during peak months, he changes scheduling before client experience suffers.
Priya, a small agency manager: Priya compares Revenue and Bookings by Photographer to balance work across her team. The dashboard helps her spot who is overbooked and who has room for new sessions.
Frequently Asked Questions
Does this template work in Google Sheets only?
Yes. This version is designed for Google Sheets. It is best used inside Google Drive with the native Google Sheets sharing and editing workflow.
Can I add my own session types and packages?
Yes. Add your own values in the Data sheet while keeping the same column structure. The dashboard is designed around the data fields, not fixed sample names.
Does the dashboard include a search feature?
Yes. The Search tab lets you enter a Booking ID and retrieve the matching booking record quickly.
Can my team use it together?
Yes. Since it runs in Google Sheets, you can share the file with team members through Google Drive permissions.
Is this a replacement for a full photography CRM?
No. It is a dashboard and lookup template. It helps with analytics, but it does not replace contracts, galleries, invoicing, or automated client workflows.
What should I update first?
Start with the Data sheet. Once your records are entered in the provided format, review the Overview cards, then move into Bookings, Revenue, Clients, and Search.
About the Author
Built by PK – Microsoft Certified Professional with 15+ years of Excel, Google Sheets, and Power BI experience. Founder of NextGenTemplates, reaching 300K+ subscribers across YouTube channels. Every template is hand-built and tested before release.
Explore Related Templates
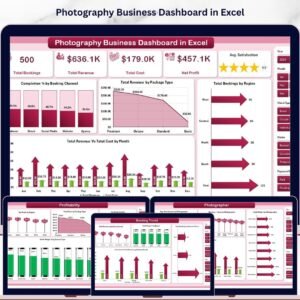
- Photography Business Dashboard in Excel
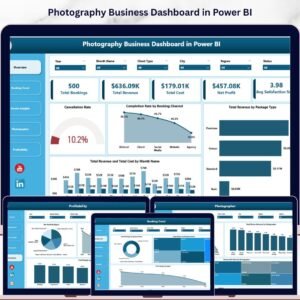
- Photography Business Dashboard in Power BI
- Photography Business KPI Dashboard in Google Sheets
- Browse all Google Sheets Dashboard Templates
Read the detailed blog post for Photography Business Dashboard in Google Sheets
Watch the step-by-step video tutorial:
One-time purchase. No monthly template subscription. Editable Google Sheets structure.
Last updated: May 2026
Compatibility and Requirements
- Works in Google Sheets. You need a free Google account and a web browser.
- The dashboard uses slicers and charts. Google explains chart setup in Add and edit a chart or graph.

















Reviews
There are no reviews yet.