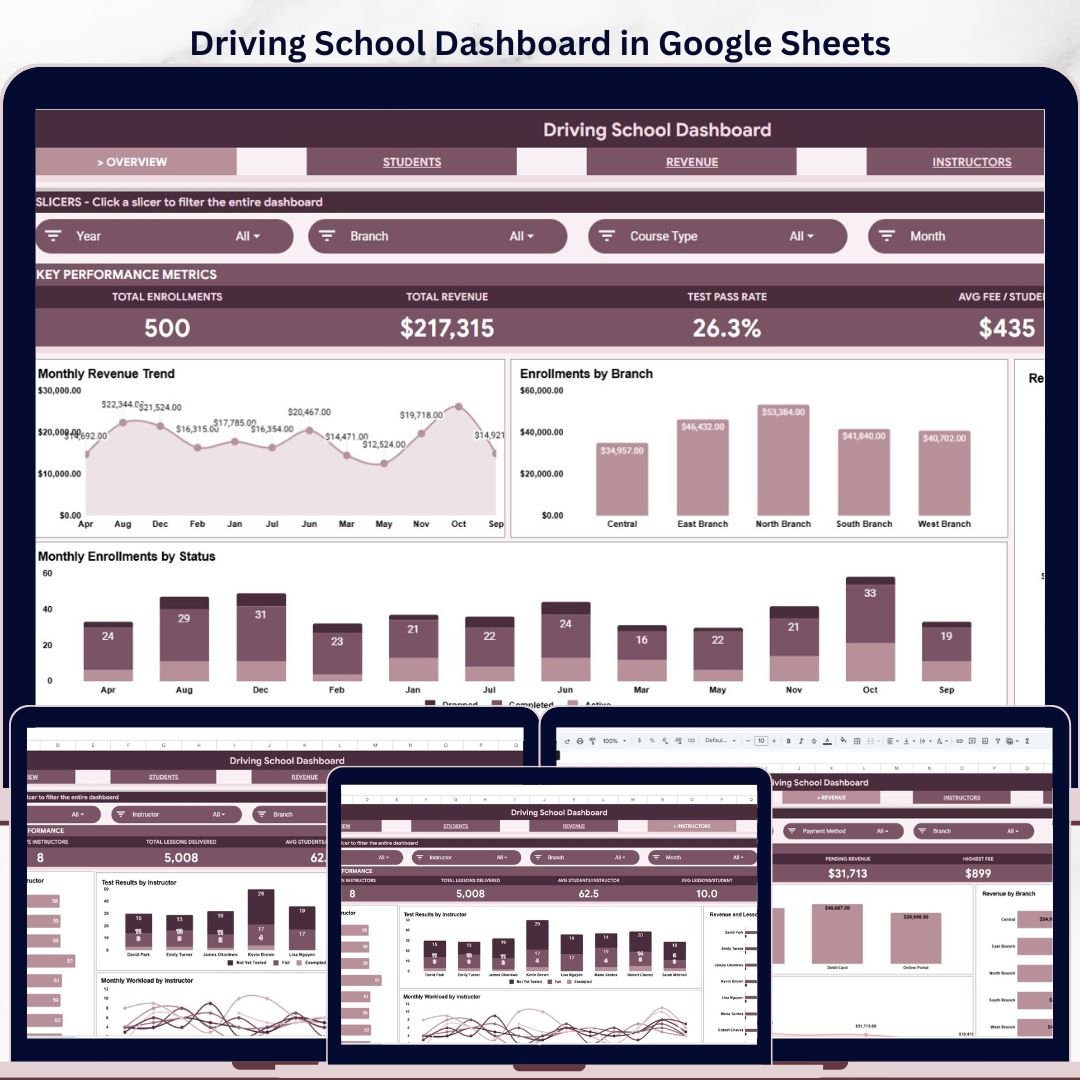


The Driving School Dashboard in Google Sheets gives driving school owners, branch managers, and training coordinators a 6-sheet reporting system for enrollments, revenue, test pass rates, instructor performance, and branch trends. For a one-time sale price of $9.99, it replaces hours of manual spreadsheet rebuilding with 4 KPI cards, 16 analysis charts, multiple slicers, a Search Sheet, and a clean Data Sheet. Built by NextGenTemplates, whose templates are used by 8,400+ teams in 40+ countries, this dashboard is a low-risk way to organize driving school reporting before paying for monthly driving school SaaS software.
Key Features of Driving School Dashboard in Google Sheets
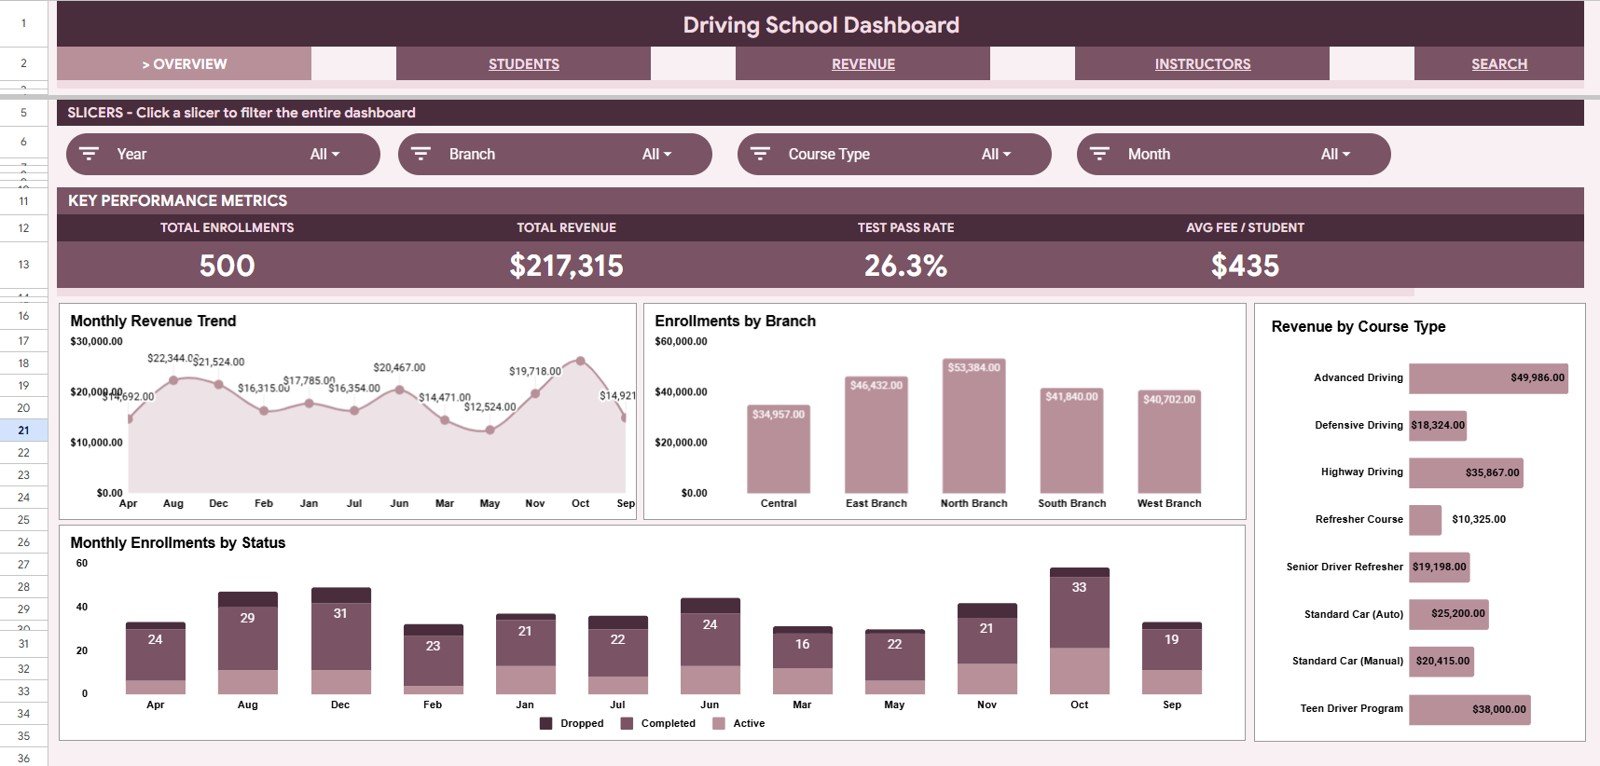
- 4 executive KPI cards for Total Enrollments, Total Revenue, Test Pass Rate, and Avg Fee per Student.
- 6 connected sheet tabs covering Overview, Students, Revenue, Instructors, Search Sheet, and Data Sheet.
- Multiple slicers so users can filter the dashboard quickly by branch, course type, status, instructor, payment method, or other available fields.
- 16 chart views across enrollment, revenue, pass rate, payment, instructor, and lesson trends.
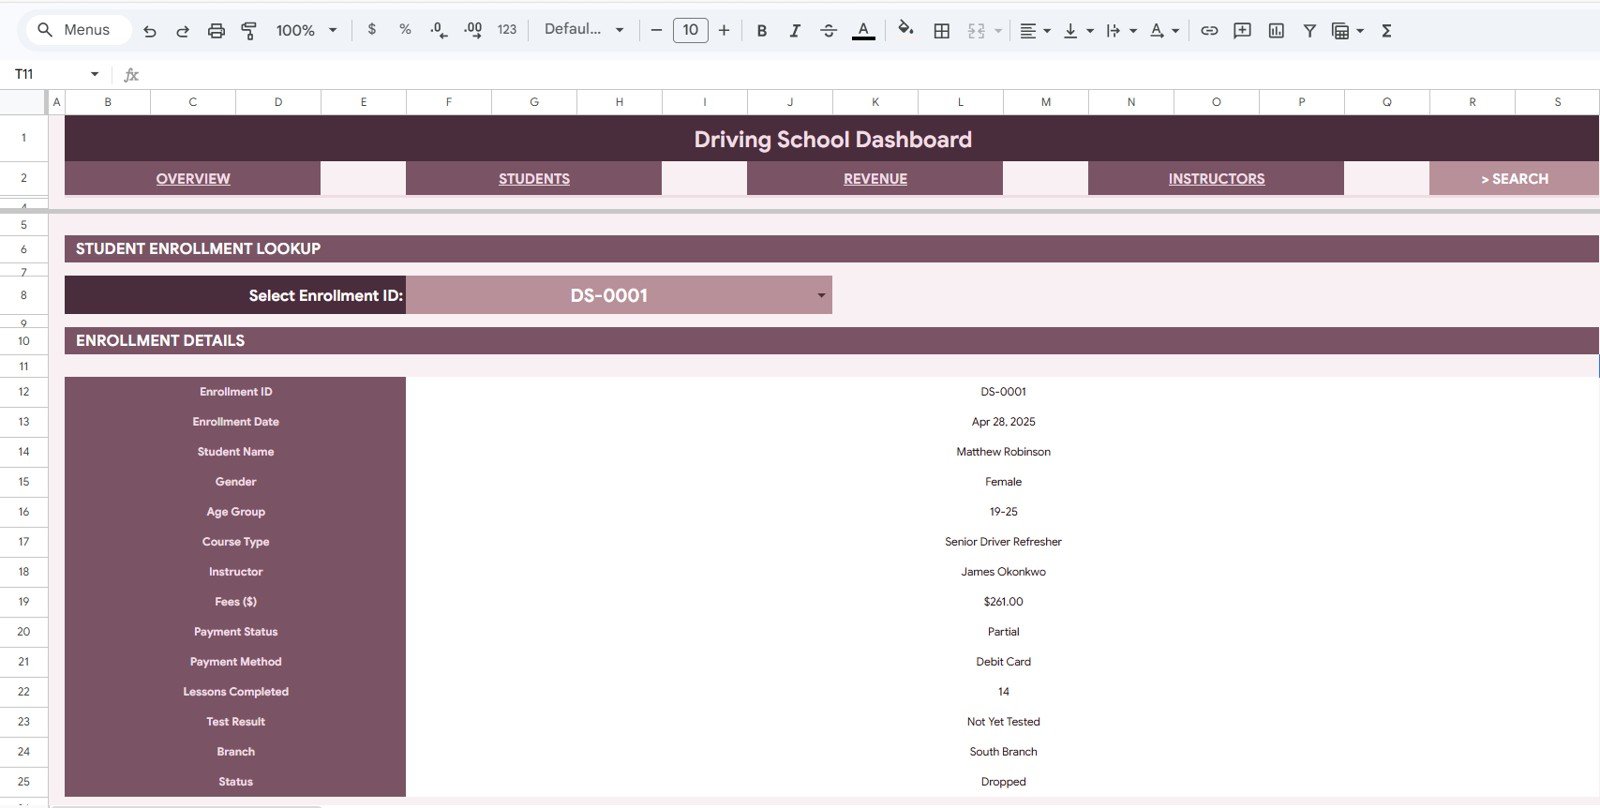
- Single-enrollment lookup from the Search Sheet using an Enrollment ID dropdown.
- Editable Google Sheets format that works in the browser and can be shared with office staff or branch managers.
What’s Inside the Driving School Dashboard in Google Sheets
Overview Page: The Overview page gives the high-level view with Total Enrollments, Total Revenue, Test Pass Rate, and Avg Fee per Student. The Revenue by Month chart shows whether tuition income is growing, flat, or seasonal. Enrollments by Branch compares training demand across locations. Revenue by Course Type highlights which driving courses generate the most income. Enrollments by Month and Status shows whether students are active, completed, pending, or cancelled across time.
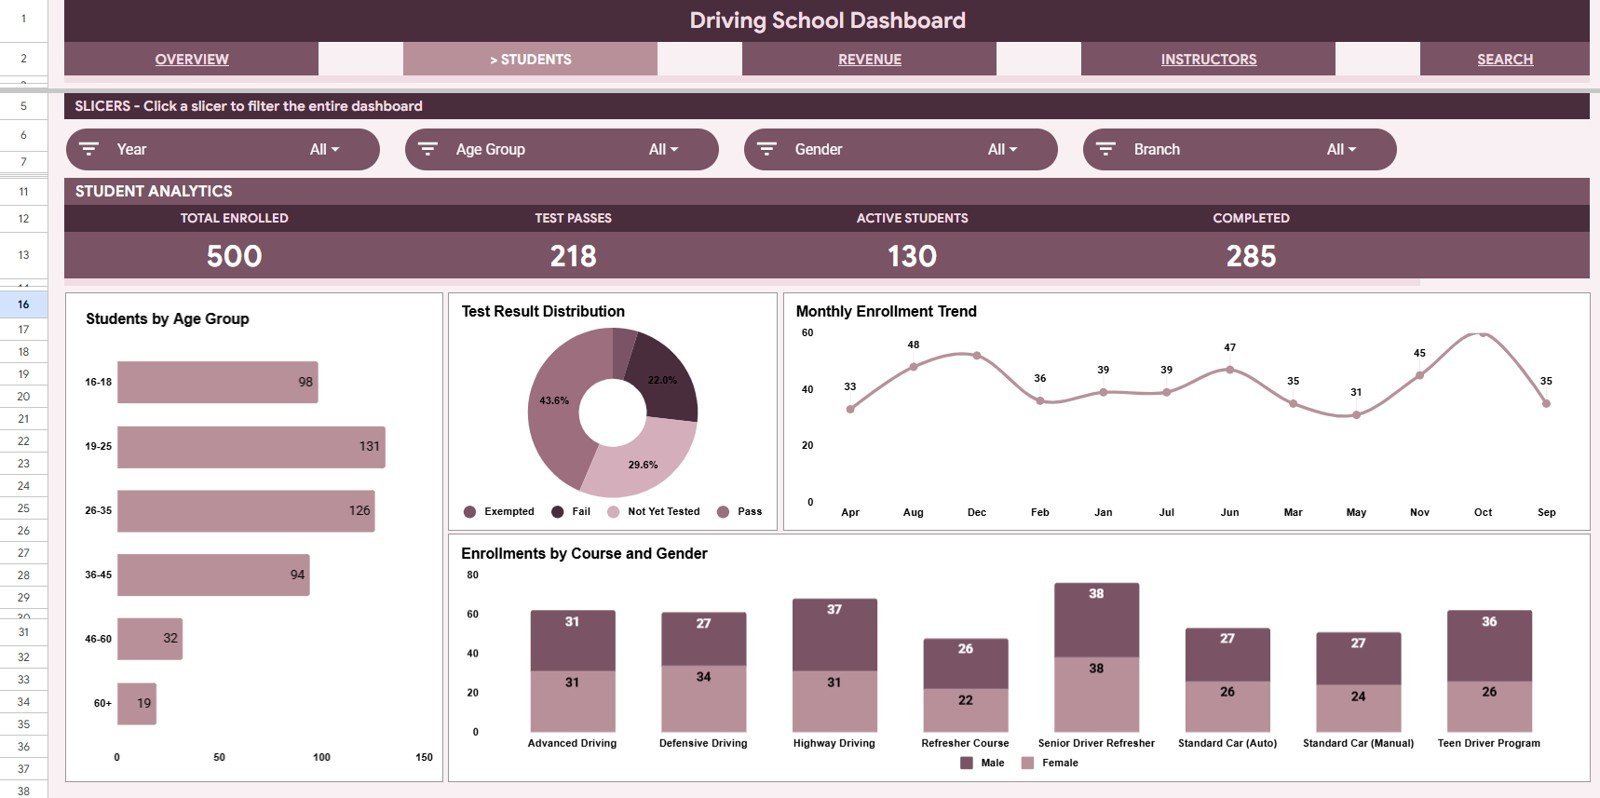
Students Sheet: The Students tab focuses on learner demographics and enrollment mix. Students by Age Group helps identify the dominant age segments in your learner base. Students by Test Result separates pass, fail, pending, and retest outcomes. Enrollments by Month shows student acquisition trends. Enrollments by Course Type and Gender helps compare course demand across student groups.

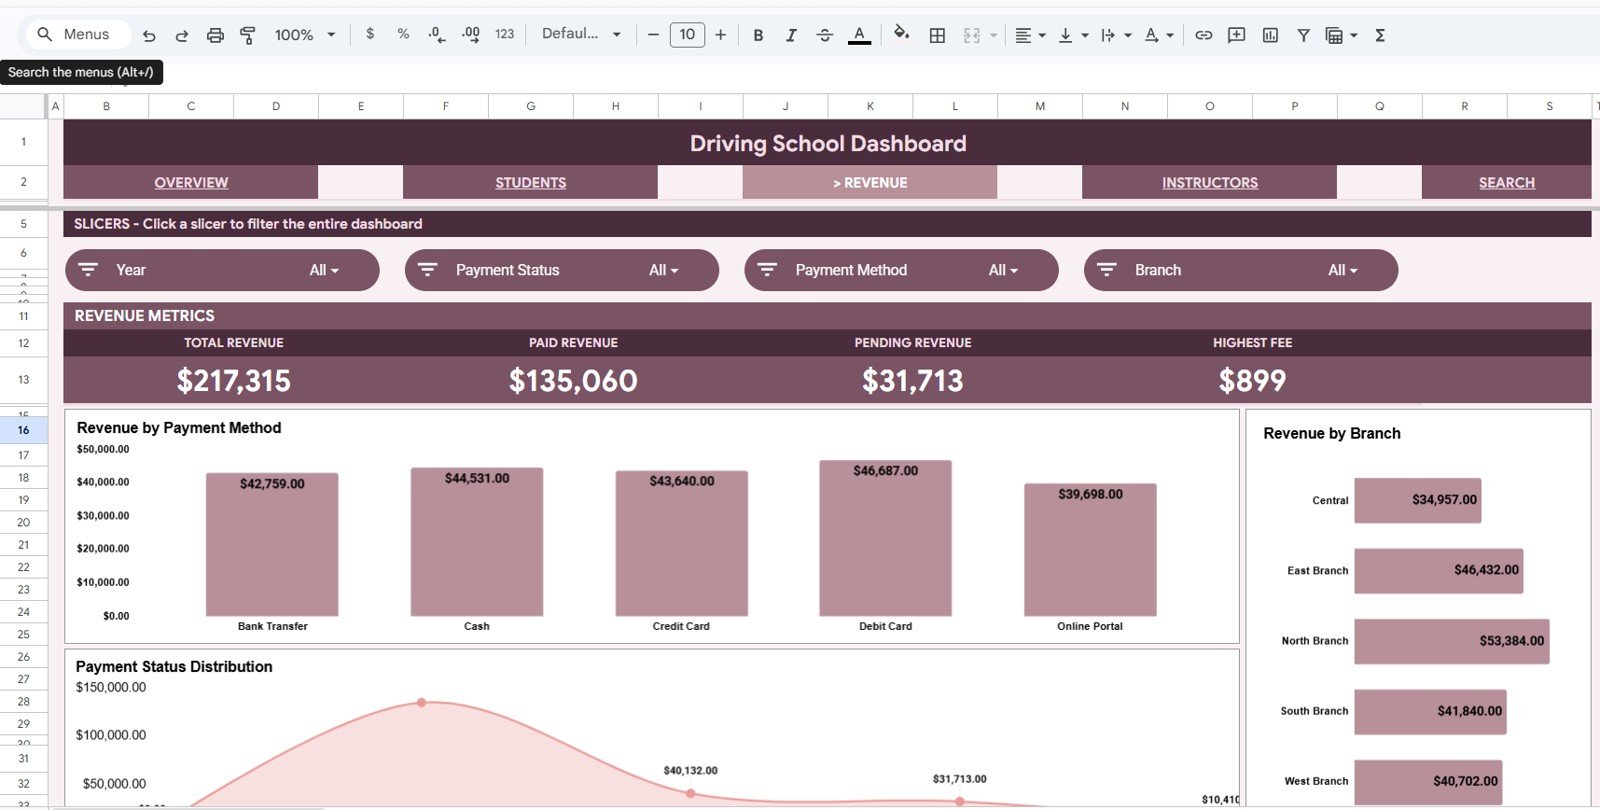
Revenue Sheet: The Revenue tab breaks down the financial side of the school. Revenue by Payment Method helps you review cash, card, online, and other payment channels. Revenue by Branch shows which locations contribute the most. Revenue by Payment Status separates paid, pending, partial, or overdue payments so follow-up becomes easier.
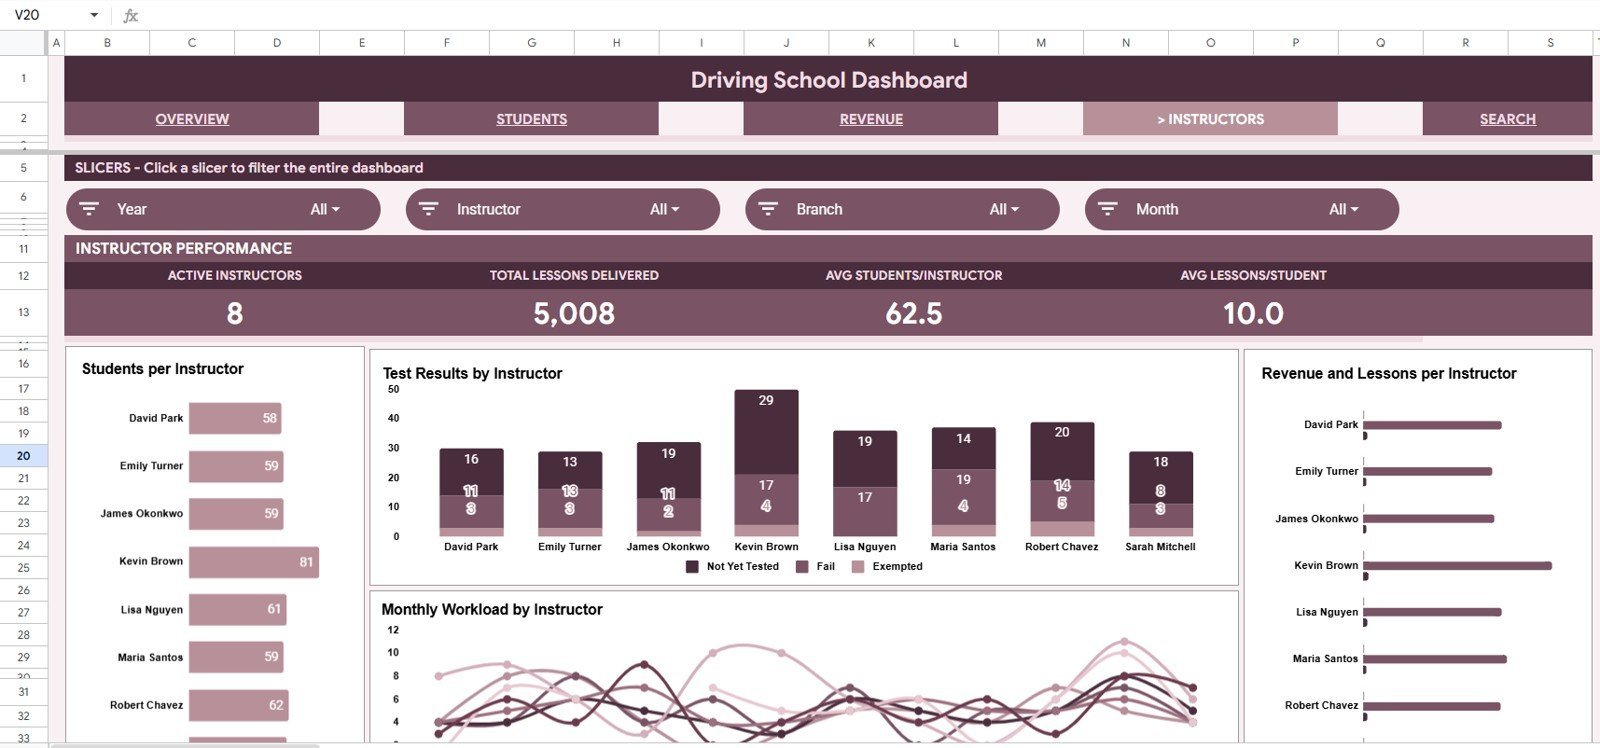
Instructors Sheet: The Instructors tab helps evaluate staff workload and training outcomes. Students by Instructor shows each instructor’s learner volume. Test Results by Instructor compares pass and fail outcomes. Lessons by Month and Instructor tracks teaching activity across time. Revenue and Lessons by Instructor connects training delivery to income contribution.

Search Sheet: Select an Enrollment ID from the dropdown and the sheet displays the full enrollment record, including enrollment date, student name, gender, age group, course type, instructor, fees, payment status, payment method, lessons completed, test result, branch, and current status.
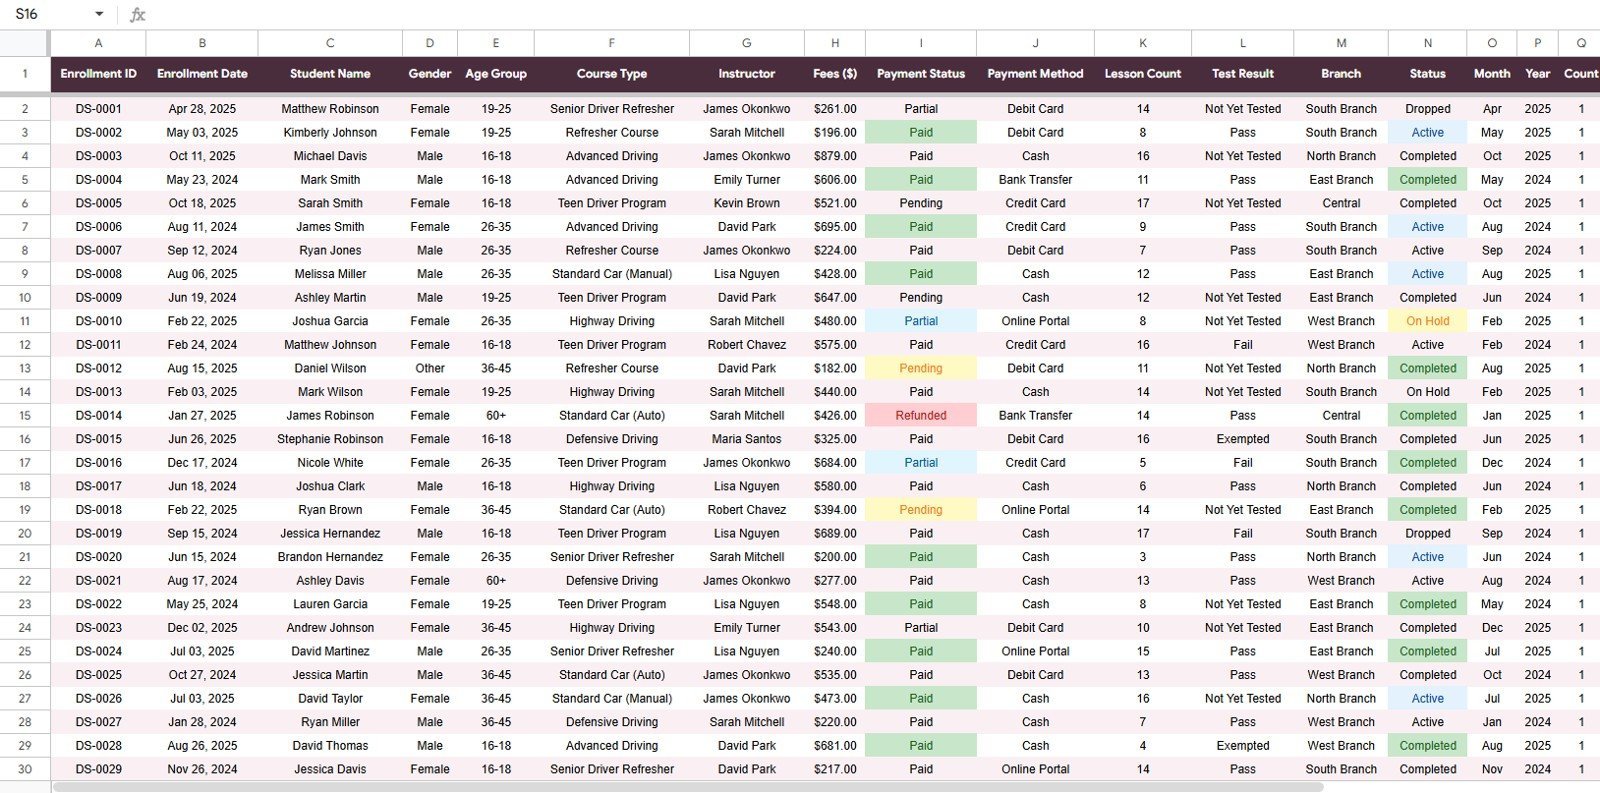
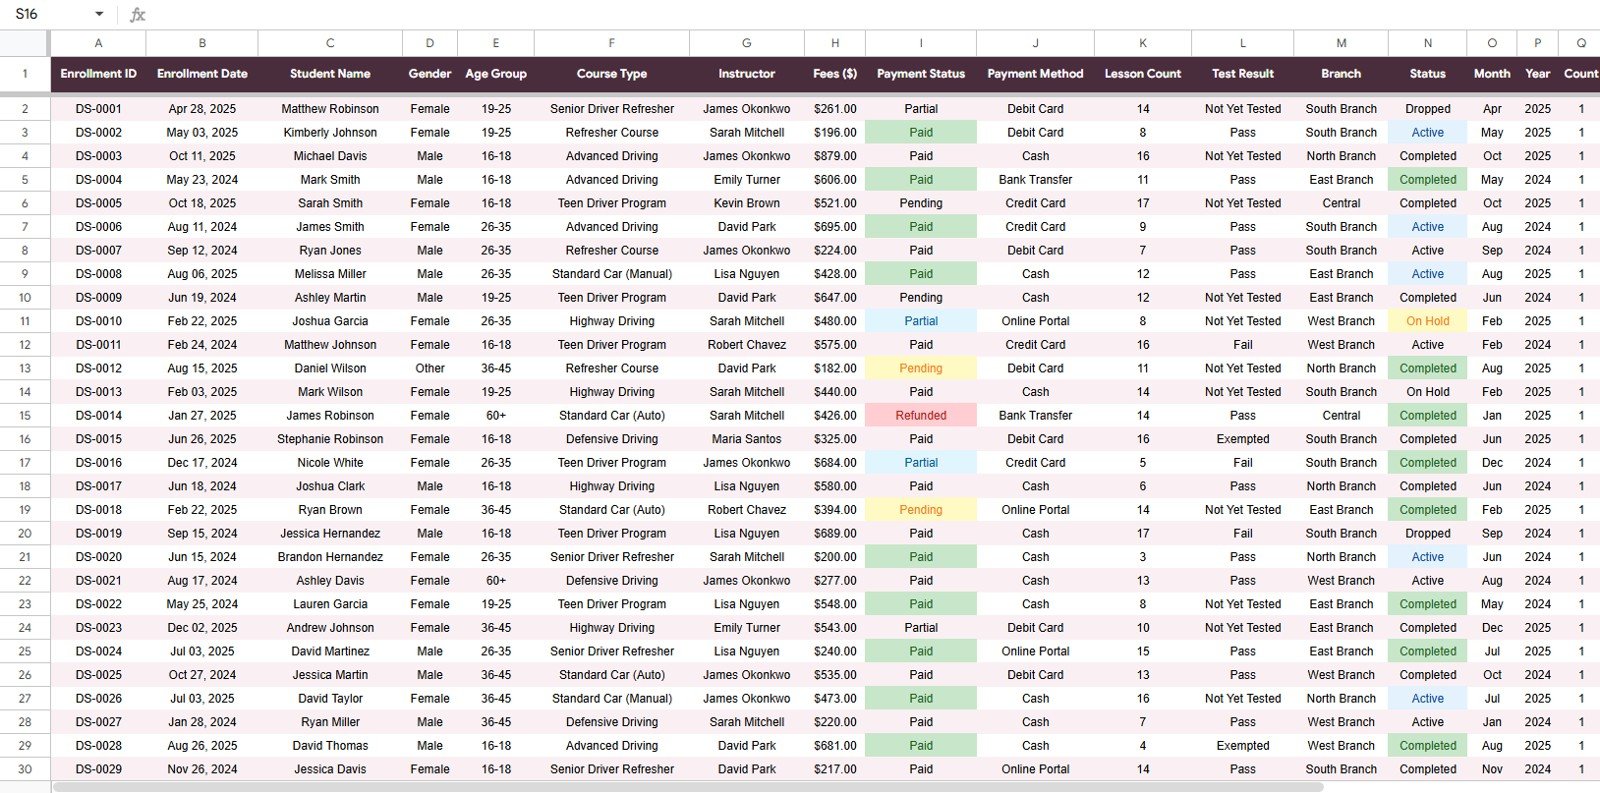
Data Sheet: The Data Sheet is the source table for the dashboard. Add new records in the same column format and the cards, charts, slicers, and lookup sheet can update from a consistent dataset.
Driving School Dashboard in Google Sheets vs. Microsoft Excel Dashboard vs. Paid Driving School SaaS – Where This Fits
| Feature | Driving School Dashboard in Google Sheets | Microsoft Excel Dashboard | Paid Driving School SaaS |
|---|---|---|---|
| Cost | $9.99 one-time sale price | Usually one-time, but may need desktop Excel | Often $49-$129 per month per branch |
| Platform | Google Sheets in any browser | Microsoft Excel desktop or Microsoft 365 | Vendor-hosted web app |
| Setup time | Copy the sheet, add data, use slicers | Open workbook, replace sample data | Usually onboarding, imports, and configuration |
| Real-time team collaboration | Built into Google Sheets sharing | Needs OneDrive or SharePoint | Available, usually tied to user seats |
| Mobile access | Google Sheets mobile app or browser | Limited mobile editing experience | Usually available through vendor app |
| Customizable fields | Editable columns, charts, and formulas | Editable workbook structure | Limited by vendor settings |
| Share with link | Yes, using Google permissions | Requires file sharing setup | Yes, inside the SaaS account |
| Year-1 cost at 5 users | $9.99 plus existing Google account | Template cost plus Microsoft license needs | Can exceed $1,500-$6,000 |
| Enrollment lookup | Built-in Search Sheet by Enrollment ID | Depends on workbook design | Usually included |
| Instructor reporting | Students, results, lessons, and revenue by instructor | Possible with pivots and charts | Usually included, but less editable |
Who This Template Is For – and Who It’s Not For
This template is built for small and mid-sized driving schools, driver training academies, multi-branch instructors, motorcycle training schools, commercial license training teams, and education-service operators who already track enrollments in spreadsheets. It is especially useful when you want a shared Google Sheets dashboard without asking every branch to buy a new system.
It is not a full booking system, payment processor, student portal, SMS reminder tool, or compliance management platform. If you need online lesson scheduling, instructor calendar dispatch, payment gateway automation, or government reporting integrations, a dedicated driving school SaaS product may still be needed.
How to Use the Driving School Dashboard in Google Sheets
- Open the PDF guide included with your purchase and use the Google Sheets copy link.
- Create your own editable copy in Google Drive.
- Go to the Data Sheet and replace the sample rows with your enrollment records.
- Keep the same column format for enrollment date, student details, course type, instructor, fees, payment fields, lessons, test result, branch, and status.
- Open the Overview, Students, Revenue, and Instructors tabs to review cards and charts.
- Use slicers to filter quickly by branch, course, instructor, payment status, or other available dimensions.
- Use the Search Sheet when you need one complete enrollment record.
Real-World Use Cases
Ravi, driving school owner: Ravi uses the Overview page every Monday to compare Total Revenue, Total Enrollments, and Test Pass Rate across his branches. The branch chart helps him see where local marketing is working.
Melissa, training coordinator: Melissa reviews Test Results by Instructor and Lessons by Month before assigning new learners. She can balance workload without digging through raw enrollment rows.
Arjun, finance assistant: Arjun checks Revenue by Payment Status and Revenue by Payment Method to follow up on partial or pending fees before month-end reporting.
Frequently Asked Questions
What does the Driving School Dashboard in Google Sheets track?
It tracks enrollments, revenue, test pass rate, average fee per student, student demographics, course type, instructor activity, lesson completion, payment status, branch performance, and enrollment status.
Does this dashboard work without Microsoft Excel?
Yes. It is built for Google Sheets, so it works in a browser with a Google account. You do not need Microsoft Excel to use the main template.
Can I filter the dashboard by branch or instructor?
Yes. The dashboard includes multiple slicers so you can filter quickly and review charts for a specific branch, instructor, course type, payment status, or available field.
Can I look up one student’s enrollment record?
Yes. The Search Sheet lets you select an Enrollment ID and display the full record, including student details, course, instructor, fee, payment, lessons, result, branch, and status.
Can I customize the Data Sheet?
Yes. You can edit the Google Sheet, but keep the core column structure aligned with the dashboard formulas and pivot logic unless you are comfortable updating the calculations.
Is this a replacement for driving school software?
It is a reporting dashboard, not a booking or student portal system. It works best for teams that already have enrollment data and want clear Google Sheets reporting at a low one-time cost.
About the Author
Built by PK – Microsoft Certified Professional with 15+ years of Excel, Google Sheets, and Power BI experience. Founder of NextGenTemplates, reaching 300K+ subscribers across YouTube channels. Every template is hand-built and tested before release.
Explore Related Templates
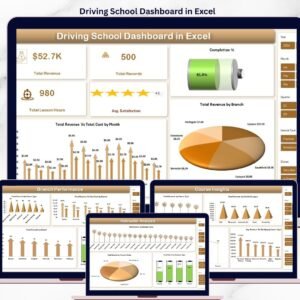
- Driving School Dashboard in Excel – Excel version for users who prefer desktop workbook reporting.
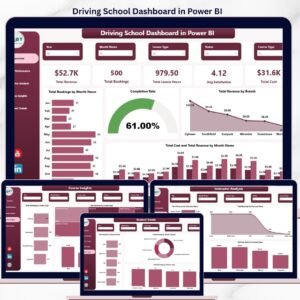
- Driving School Dashboard in Power BI – Power BI version for richer report publishing and cross-filtering.
- School Admin Dashboard in Google Sheets – education administration dashboard for grades, attendance, and fees.
- Student Enrollment KPI Scorecard in Excel – scorecard-style enrollment KPI tracking.
- Music School Dashboard in Power BI – education-services analytics for music academies.
Watch the step-by-step video tutorial:
Ready to organize enrollments, payments, instructors, and pass-rate analysis in one shared spreadsheet? Download the Driving School Dashboard in Google Sheets and start replacing scattered manual reports with a clean, filterable dashboard.
Last updated: May 20, 2026


Reviews
There are no reviews yet.