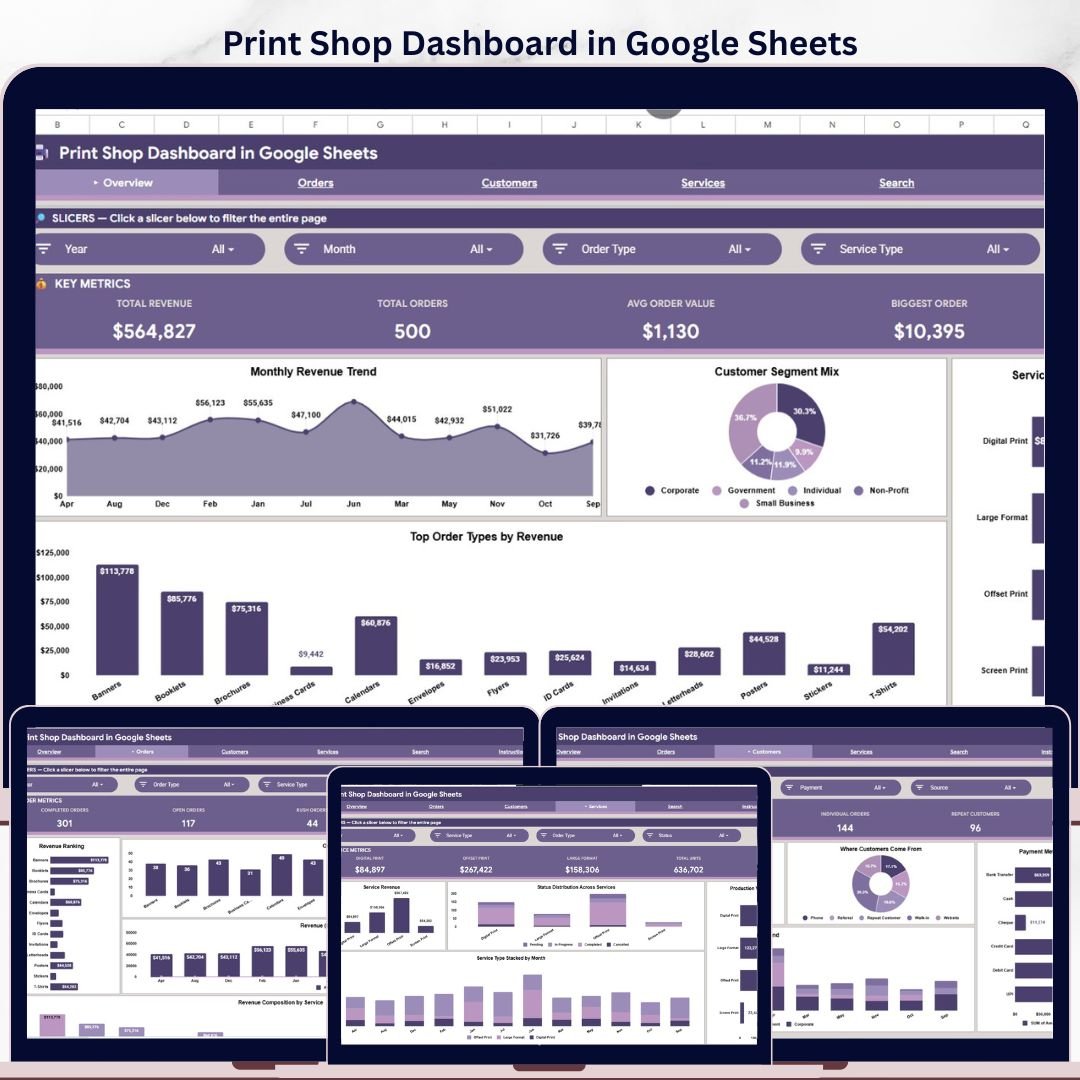
The Print Shop Dashboard in Google Sheets tracks 4 executive cards, 16 revenue and order charts, a dedicated order lookup sheet, and a clean Data sheet for replacing spreadsheet chaos with a browser-based dashboard. Setup takes under 10 minutes: paste your print shop orders into the Data sheet and use slicers to filter revenue, orders, customers, services, payment methods, and status instantly. Join 8,400+ teams in 40+ countries using NextGenTemplates for one-time-purchase dashboards with no subscription, no per-user fees, and lifetime access.
Key Features of Print Shop Dashboard in Google Sheets
- 6 connected sheet tabs covering Overview, Orders Analysis, Customers Analysis, Services Analysis, Search Sheet, and Data Sheet.
- 4 high-level KPI cards: Total Revenue, Total Orders, Avg Order Value, and Biggest Order.
- 16 ready-made charts for monthly revenue, order type, service type, customer segment, payment method, order source, and production volume.
- Slicer-based filtering so managers can segment the dashboard by service, customer group, order status, month, and source without changing formulas.
- Order ID search sheet that returns every field for one order, including date, service type, description, amount, quantity, payment method, source, and status.
- Native Google Sheets sharing, so owners, sales staff, and production teams can work from the same cloud file.
What’s Inside the Print Shop Dashboard in Google Sheets
Overview Page
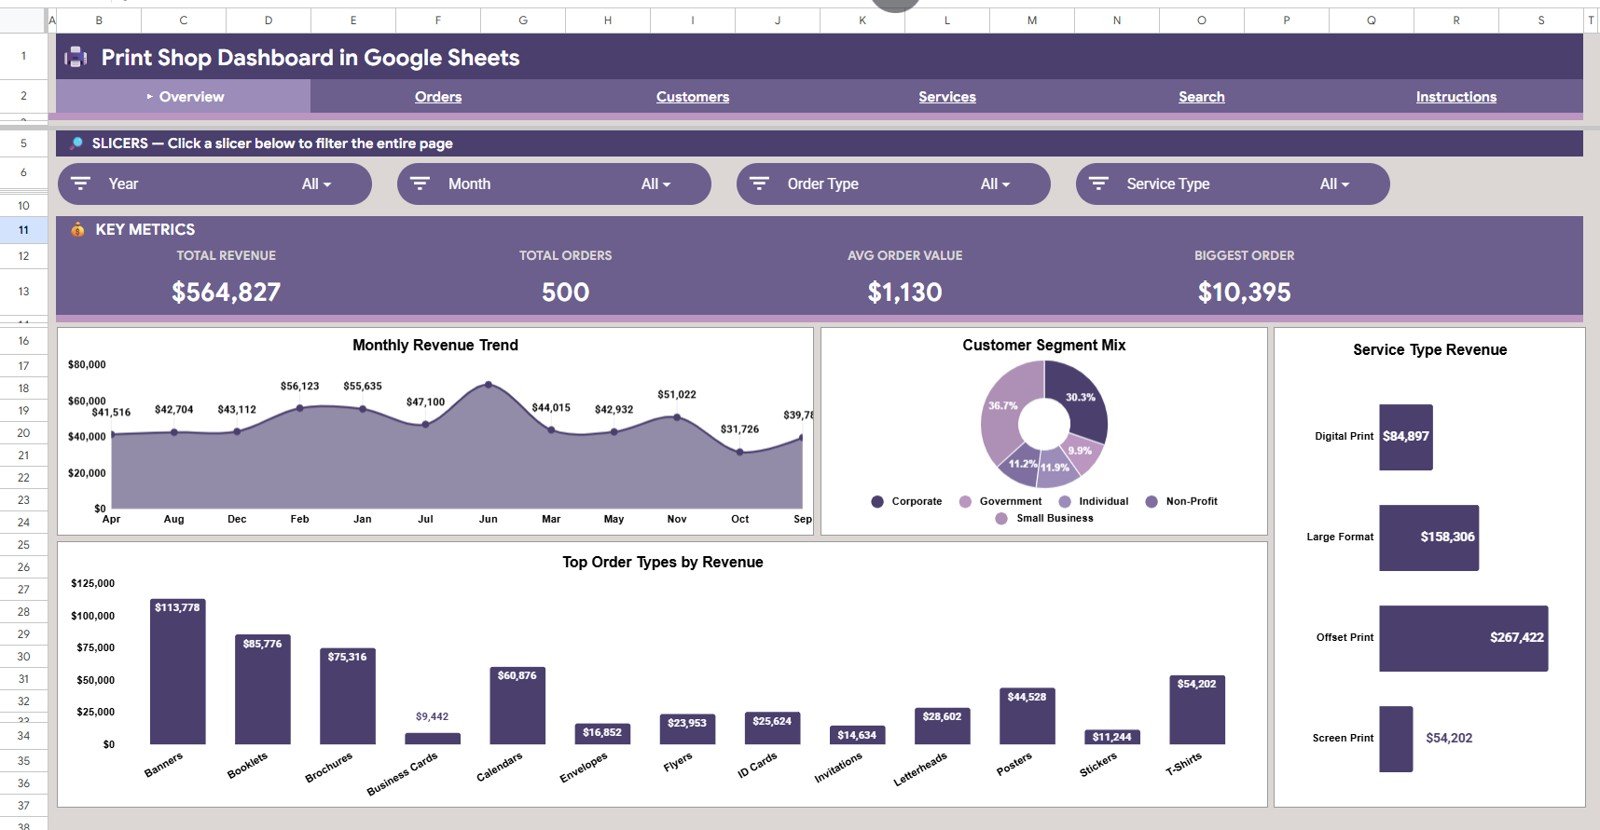
The Overview page gives owners the high-level pulse of the print shop. The top cards show Total Revenue, Total Orders, Avg Order Value, and Biggest Order, while slicers let you narrow the view to a specific month, order type, service type, customer segment, or status.
Revenue by Month shows seasonal order value and helps identify stronger and slower months. Use it to plan promotions, production staffing, and material purchasing before demand changes.
Revenue by Customer Segment compares how much comes from retail, corporate, repeat, or other customer groups. This makes it easier to focus on the customer segments that support the highest revenue.
Revenue by Service Type separates services such as digital printing, offset printing, large format, binding, and design. It shows which services deserve more sales attention and which may need pricing review.
Revenue by Order Type compares standard, rush, bulk, and custom orders. It helps owners understand whether premium order types are contributing enough revenue to justify extra production pressure.
Print Shop Dashboard in Google Sheets
Orders Analysis
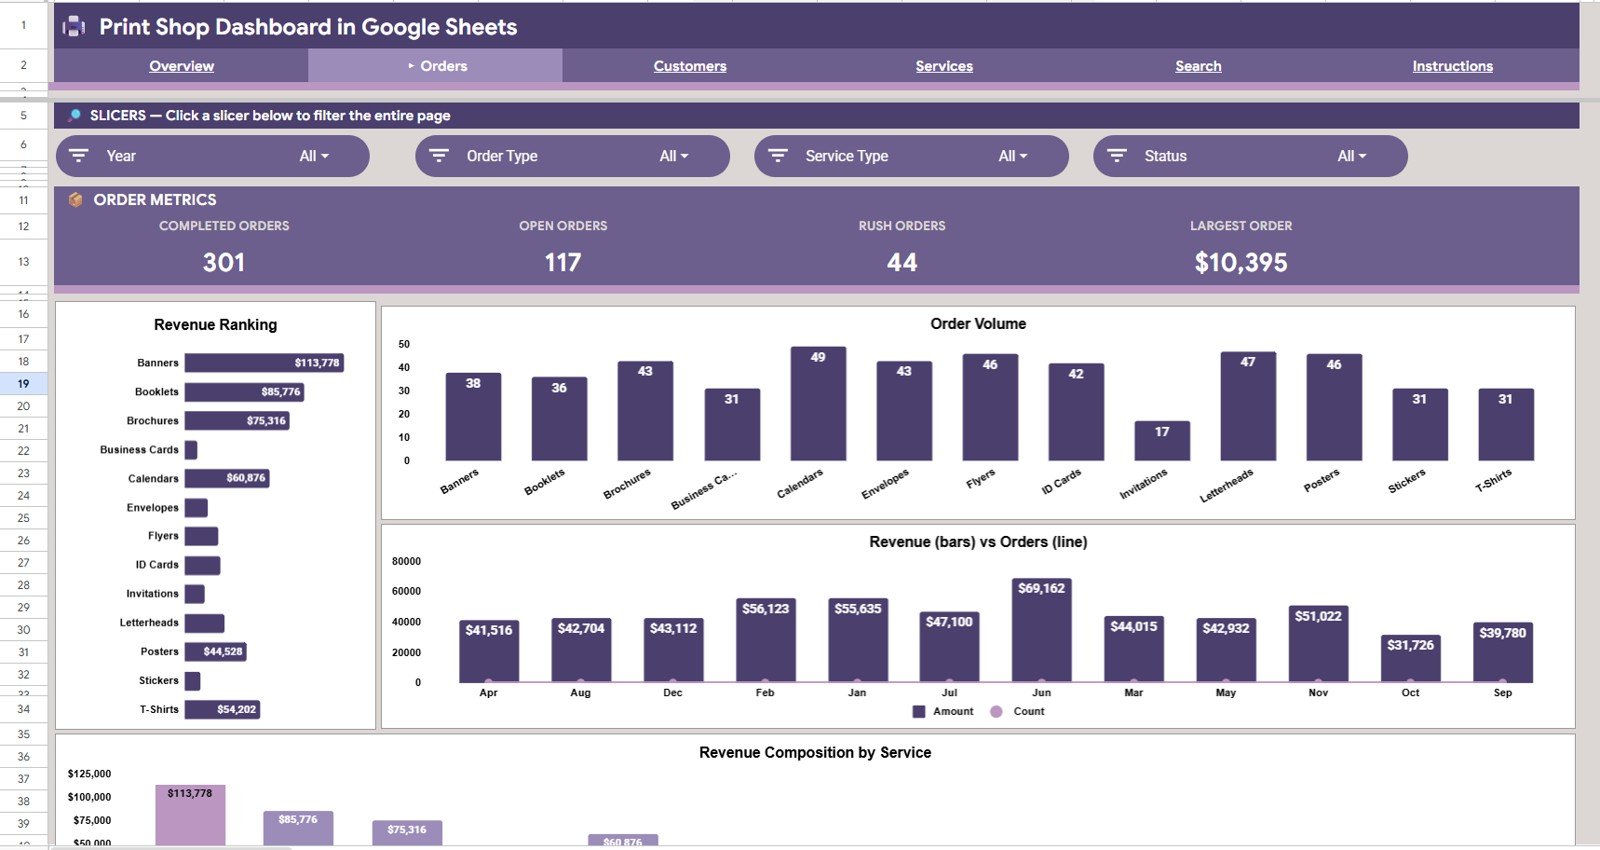
The Orders Analysis tab focuses on how order volume and revenue behave by type, month, and service. It is useful for reviewing which jobs are coming in, where revenue is concentrated, and whether order mix is changing over time.
Revenue by Order Type identifies which order types bring in the most money. This helps separate high-volume low-value work from fewer but higher-value order categories.
Order Count by Order Type shows how many jobs each order type contributes. When compared with revenue, it reveals whether some order types consume too much production time for too little revenue.
Revenue and Orders by Month combines demand and sales value on a time trend. It helps spot months where order count rose but average value fell, or where fewer jobs generated better revenue.
Revenue by Service Type shows which print services drive order income. It gives managers a service-level view for pricing, bundling, and sales focus.
Orders Analysis
Customers Analysis
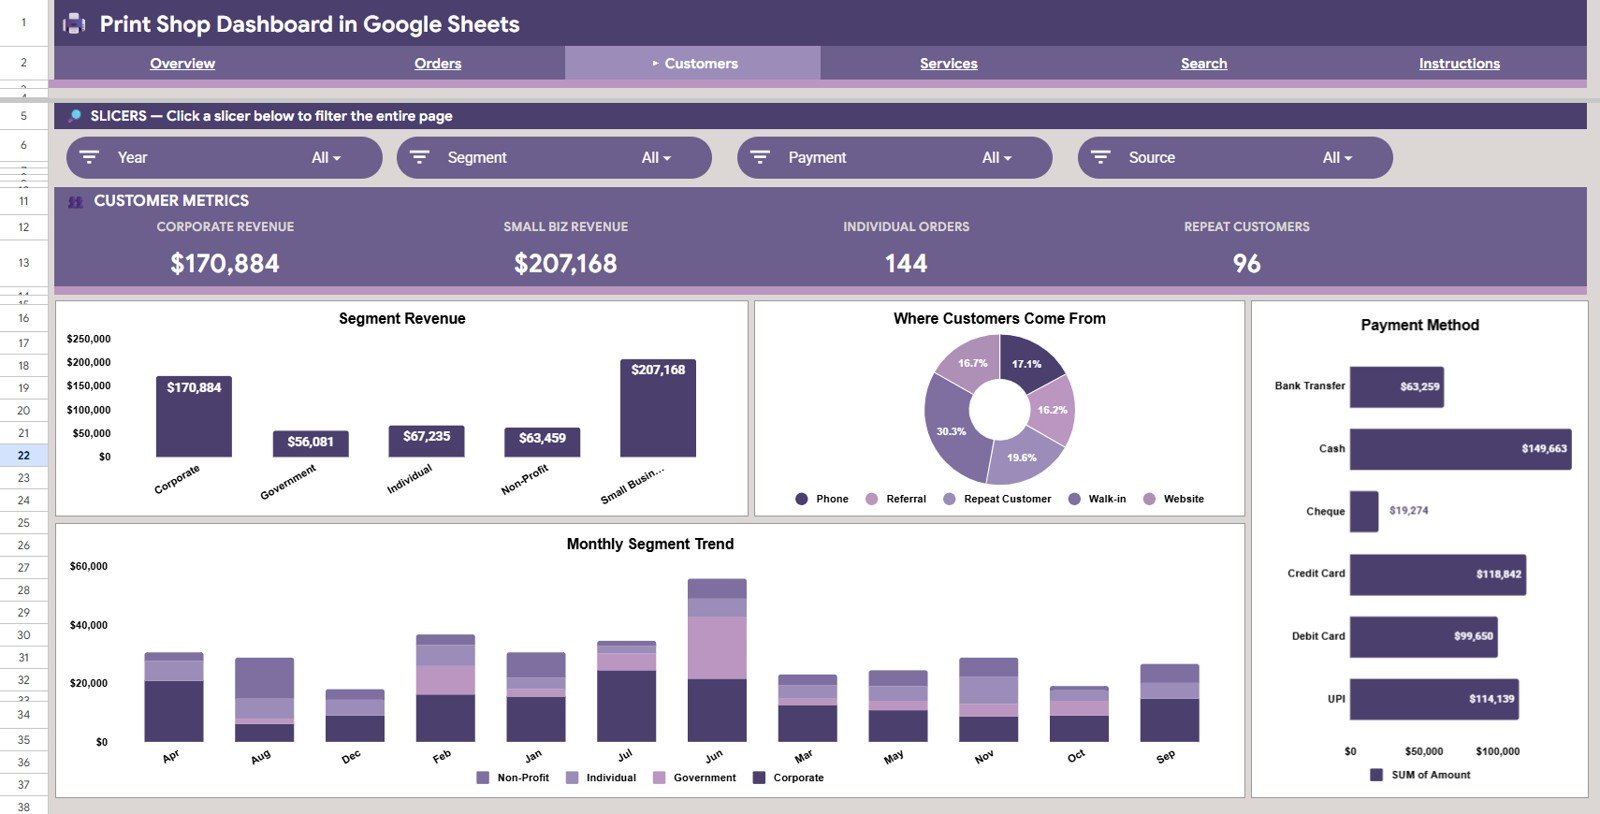
The Customers Analysis tab shows where revenue comes from by segment, source, and payment method. It is designed for owners who want to understand customer quality, acquisition channels, and payment behavior.
Revenue by Customer Segment compares revenue across customer groups. It tells you which segment is most valuable and where retention or upsell efforts should focus.
Order Count by Order Source tracks how many jobs come from walk-ins, referrals, online requests, social media, or other channels. This gives practical insight into which acquisition sources are actually producing work.
Revenue by Payment Method compares cash, card, bank transfer, UPI, or other payment modes. It supports reconciliation and helps owners understand customer payment preferences.
Revenue by Customer Segment by Month shows segment performance over time. Use it to identify whether corporate or repeat customers are growing, flat, or declining month by month.
Customers Analysis
Services Analysis
The Services Analysis tab looks at service performance from both revenue and operations angles. It helps print shops understand which services generate income, which create production volume, and which have status issues.
Revenue by Service Type ranks service categories by sales value. This gives a quick view of the most important offerings in the print shop.
Order Status by Service Type shows how jobs are moving through statuses for each service. It can reveal bottlenecks in a specific service line before delays become customer complaints.
Production Volume by Service Type compares the quantity handled by each service. It helps production teams understand workload, not just revenue.
Revenue by Service Type by Month tracks service revenue trends across months. This is useful for seasonal planning, staffing, and service-level marketing.
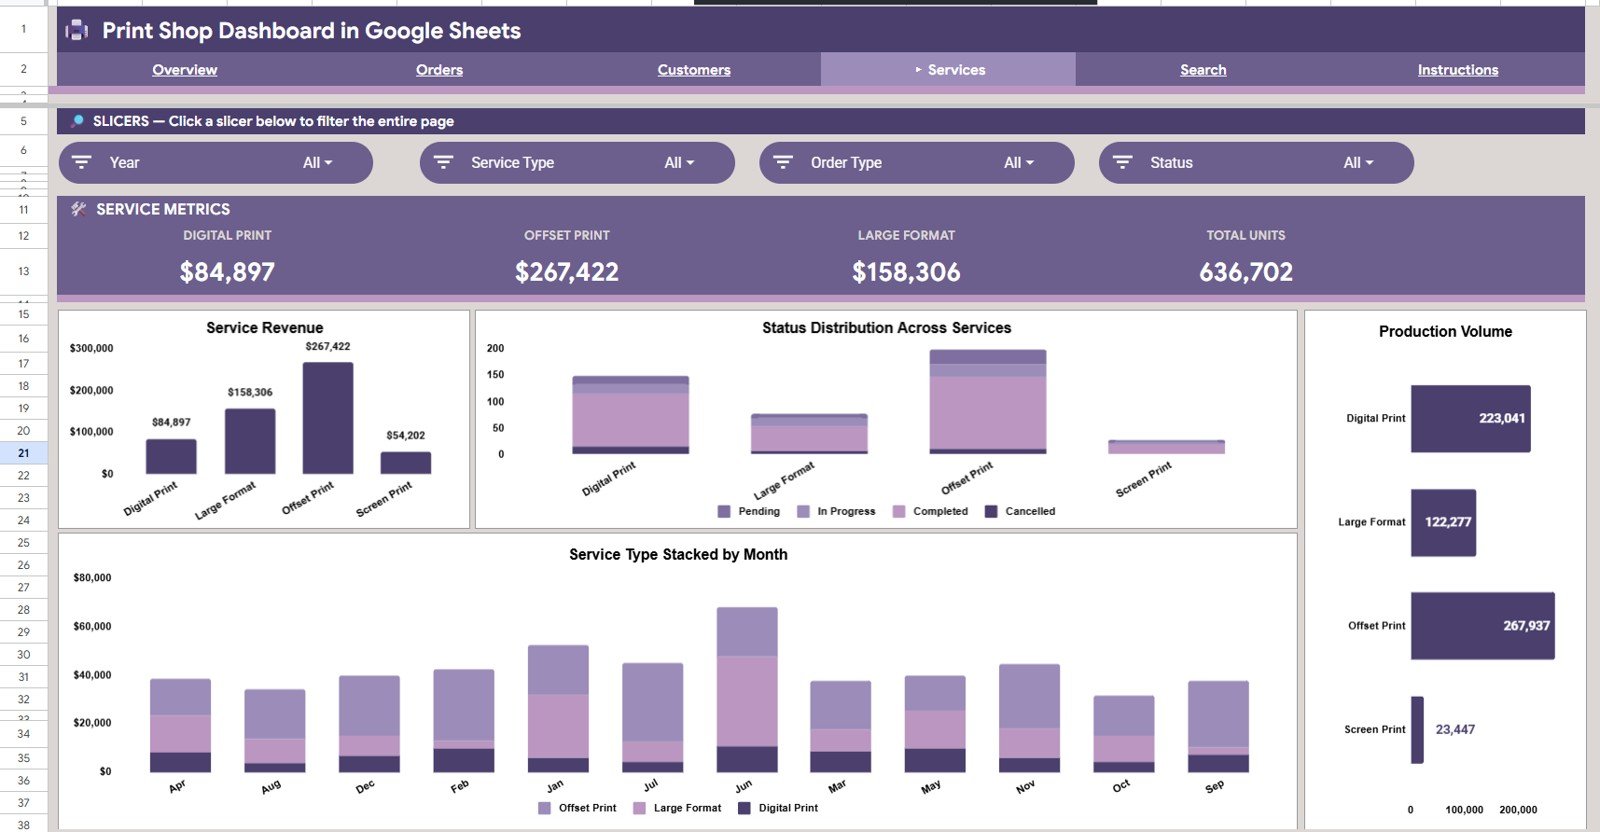
Services Analysis
Search Sheet
The Search Sheet gives you a one-order lookup. Enter an Order ID at the top and the sheet instantly returns Order ID, Date, Order Type, Service Type, Customer Segment, Customer Name, Description, Amount, Quantity, Payment Method, Order Source, and Status. This is useful when a customer calls about one job and you do not want to scroll through the full data set.
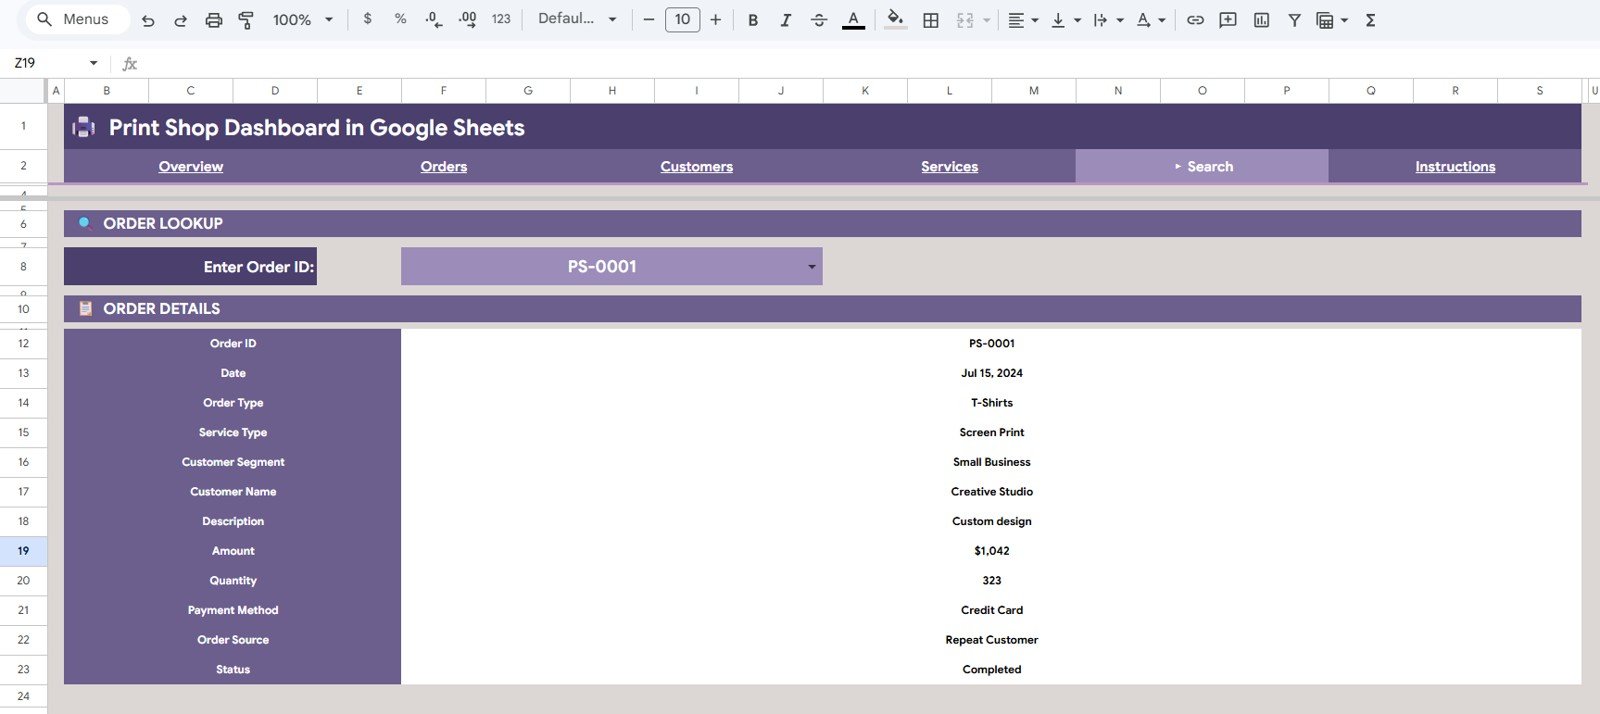
Search Sheet tab
Data Sheet
The Data sheet is where you add or replace the source records. Keep the same column format, paste new order rows, and the connected dashboard pages refresh from the same structure.
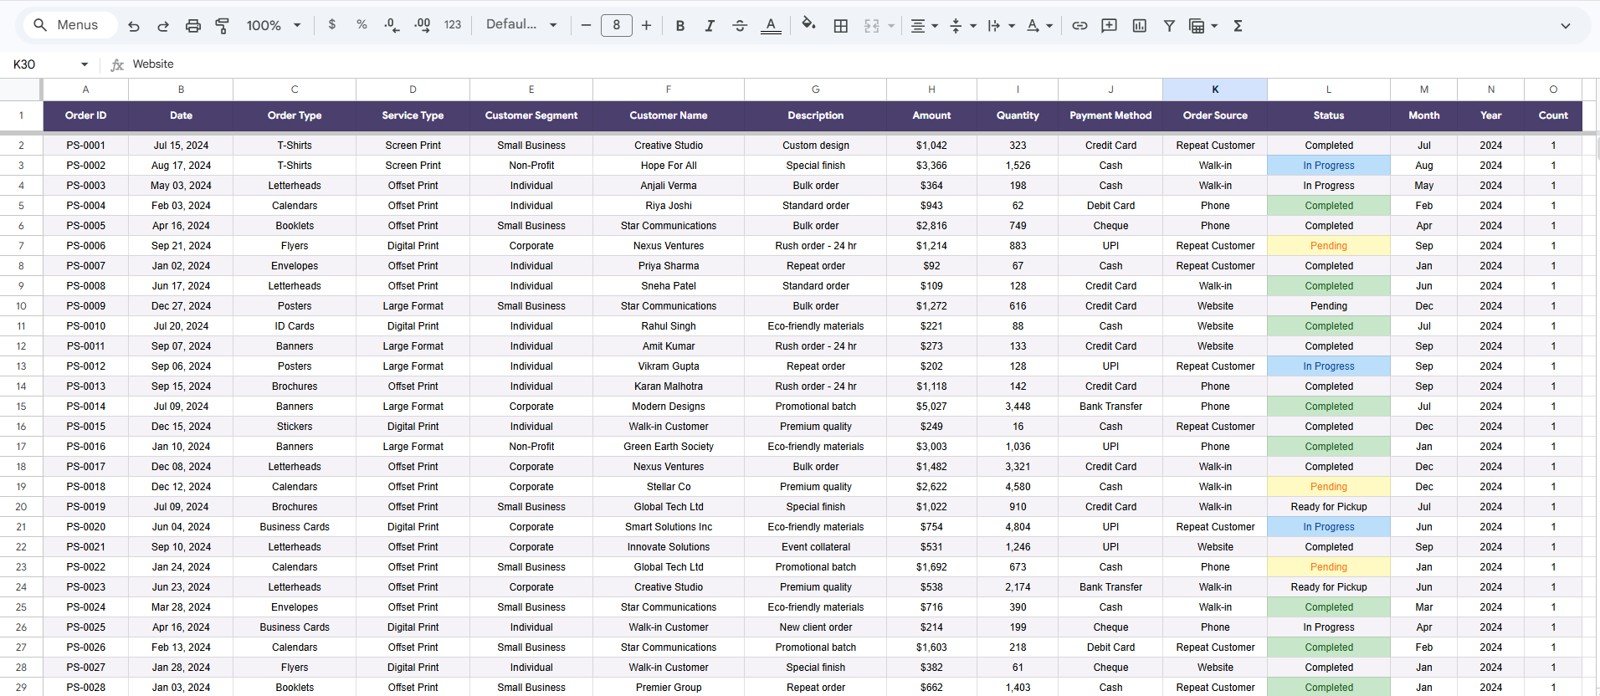
Data Sheet tab
Print Shop Dashboard in Google Sheets vs. Microsoft Excel vs. Paid CRM/SaaS – Where This Fits
| Feature | Print Shop Dashboard in Google Sheets | Microsoft Excel Dashboard | Printavo / PrintSmith / SaaS |
|---|---|---|---|
| Cost | $9.99 one-time | $17.99 one-time plus Excel license | $89-$299 per month |
| Platform | Google Sheets in browser | Excel desktop | Cloud SaaS |
| Setup time | Under 10 minutes | Under 10 minutes | Days to weeks |
| Real-time team collaboration | Built into Google Sheets | Requires OneDrive or SharePoint | Included on paid plans |
| Mobile access | Google Sheets mobile app | Limited in Excel mobile | Included on paid plans |
| Customizable fields | Fully editable sheet structure | Fully editable workbook | Vendor-controlled fields |
| Share with link | Yes | Varies by Microsoft 365 setup | Account-based access |
| Order lookup | Built-in Search Sheet | Usually formula-based | Included in job workflow systems |
| Year-1 cost at 5 users | $9.99 | $17.99 plus licenses | $1,068-$3,588+ |
Who This Template Is For – and Who It’s Not For
This template is built for print shop owners, production managers, small business analysts, and back-office teams who want to track revenue, order volume, services, customers, and individual order details inside Google Sheets.
It is not for shops that need live POS sync, automated job tickets, inventory procurement, customer portals, machine telemetry, or enterprise-level permissions. For those needs, use a dedicated print management system and treat this file as a reporting layer.
How to Use the Print Shop Dashboard in Google Sheets
- Open the PDF guide from your download and use the copy link to create your own Google Sheets file.
- Go to the Data sheet and replace the sample records with your print shop order data.
- Keep the same column headers for Order ID, Date, Order Type, Service Type, Customer Segment, Customer Name, Description, Amount, Quantity, Payment Method, Order Source, and Status.
- Open the Overview, Orders Analysis, Customers Analysis, and Services Analysis tabs to review the refreshed charts.
- Use the slicers to filter by order type, service type, customer segment, payment method, source, or status.
- Use the Search Sheet when you need to investigate one specific Order ID.
Real-World Use Cases
Rajan owns a five-person print shop. He uses the Overview page each Monday to compare monthly revenue and biggest order value before deciding which services to promote that week.
Divya manages production. She opens the Services Analysis tab to compare production volume and order status by service type, then follows up on the services with the most pending jobs.
Marco runs sales for a commercial printer. He uses Customers Analysis to see whether corporate clients, walk-ins, referrals, or online sources are bringing the best order value.
Frequently Asked Questions
What does the Print Shop Dashboard in Google Sheets track?
It tracks Total Revenue, Total Orders, Avg Order Value, Biggest Order, revenue trends, order type performance, customer segments, service types, payment methods, order sources, service status, production volume, and individual order details.
Do I need a paid Google Workspace account?
No. The dashboard works in Google Sheets with a free Google account. A paid Workspace account is only needed if your organization uses business-grade admin controls.
Can multiple people edit the dashboard?
Yes. Because the template runs in Google Sheets, you can share it with team members and control whether they can view, comment, or edit.
Can I customize the fields?
Yes. You can add supporting fields and modify charts, but keep the core data columns intact unless you are comfortable updating the formulas and ranges behind the dashboard.
Is this the same as print shop management software?
No. This template is an analytics dashboard, not a full job ticketing or CRM system. It is best for reporting, order analysis, and management review.
Is there an Excel or Power BI version?
Yes. You can also use the Print Shop Dashboard in Excel or the Print Shop Dashboard in Power BI depending on your platform preference.
About the Author
Built by PK – Microsoft Certified Professional with 15+ years of Excel, Google Sheets, and Power BI experience. Founder of NextGenTemplates, reaching 300K+ subscribers across YouTube channels. Every template is hand-built and tested before release.
Explore Related Templates
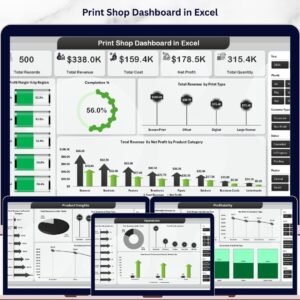
- Print Shop Dashboard in Excel – the Excel version for desktop spreadsheet users.
- Print Shop Dashboard in Power BI – the Power BI version for DAX-driven business intelligence.
- Printing and Publishing Dashboard in Power BI – broader print and publishing performance analytics.
- Receipt Template in Google Sheets – a useful companion for small business receipts.
- Browse all Google Sheets Dashboard Templates.
Click here to read the detailed blog post
Ready to track print shop revenue, orders, services, and customers in Google Sheets? Download the Print Shop Dashboard in Google Sheets and turn order data into a shareable management dashboard.
Watch the step-by-step video tutorial:
Last updated: May 2026


Reviews
There are no reviews yet.