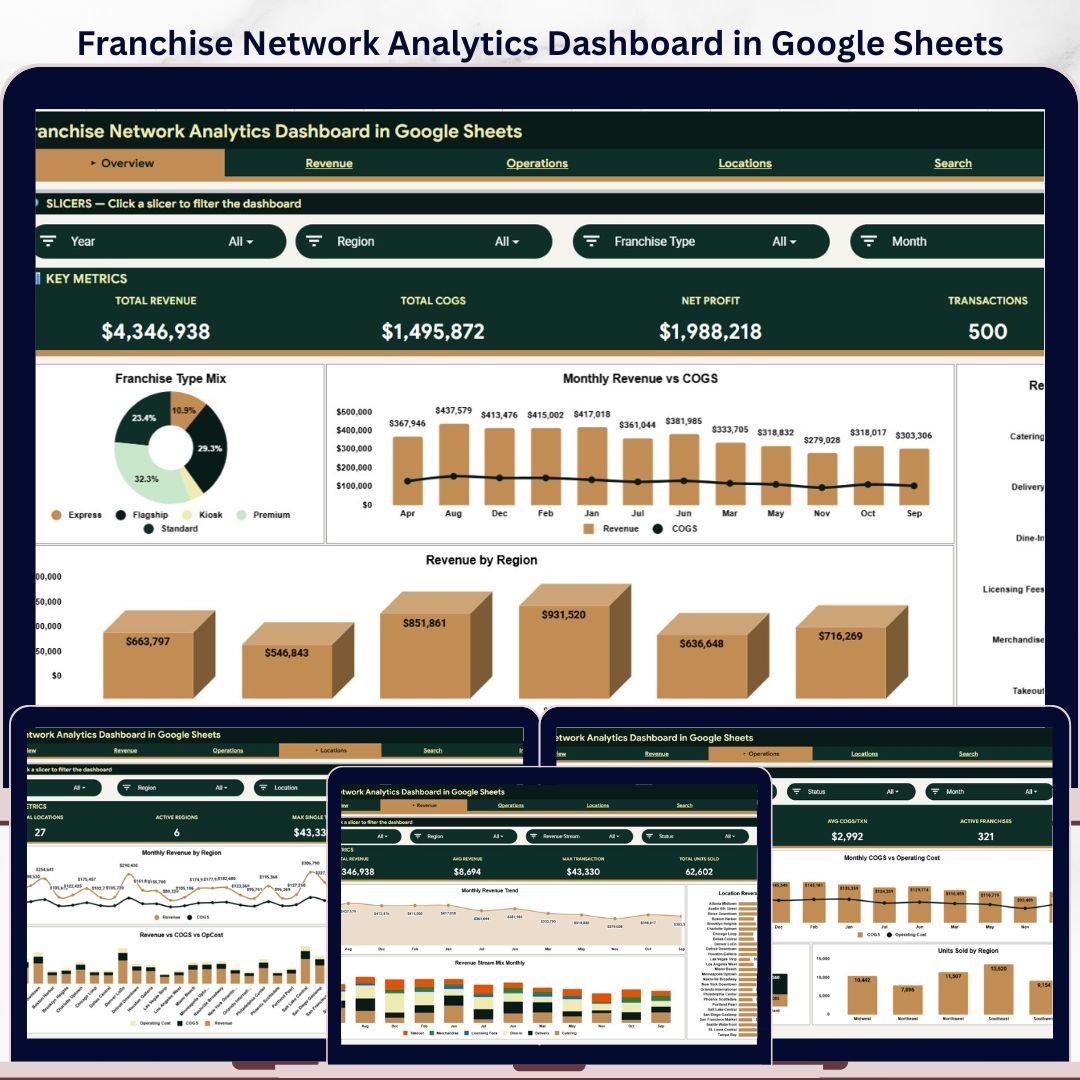


Franchise Network Analytics Dashboard in Google Sheets gives franchise owners a ready-to-use reporting file with 4 KPI cards, 6 worksheet tabs, 14 analysis charts, slicer-based filtering, a structured Data sheet, and a Franchise ID lookup page. This template uses a familiar spreadsheet environment to help multi-location teams track revenue, COGS, net profit, transactions, units sold, operating cost, region performance, and location-level results without a monthly analytics subscription.
Join 8,400+ teams in 40+ countries using NextGenTemplates to replace recurring SaaS dashboards with editable Excel, Google Sheets, Power BI, and HTML templates. This product is a one-time purchase with lifetime access, no per-user fee, and a draft-ready structure that your team can review before publishing.
Key Features of Franchise Network Analytics Dashboard in Google Sheets
- Overview KPI cards: Total Revenue, Total COGS, Net Profit, and Transactions give leadership a fast snapshot of franchise network health.
- 14 pre-built charts: Review franchise type mix, monthly revenue and COGS, revenue streams, regional performance, location contribution, operating cost, and units sold.
- Multiple slicers: Filter pages quickly by franchise type, region, location, revenue stream, status, or period depending on the tab structure.
- Revenue analysis tab: Focus on monthly revenue, revenue stream trends, and location-level revenue performance.
- Operations analysis tab: Track franchise count by status, COGS, operating cost, franchise type, and units sold by region.
- Location analysis tab: Compare revenue, COGS, and operating cost by region and location to identify strong and weak branches.
- Data and Search tabs: Add records in a consistent format, then select a Franchise ID to see full transaction details instantly.
What’s Inside the Franchise Network Analytics Dashboard in Google Sheets
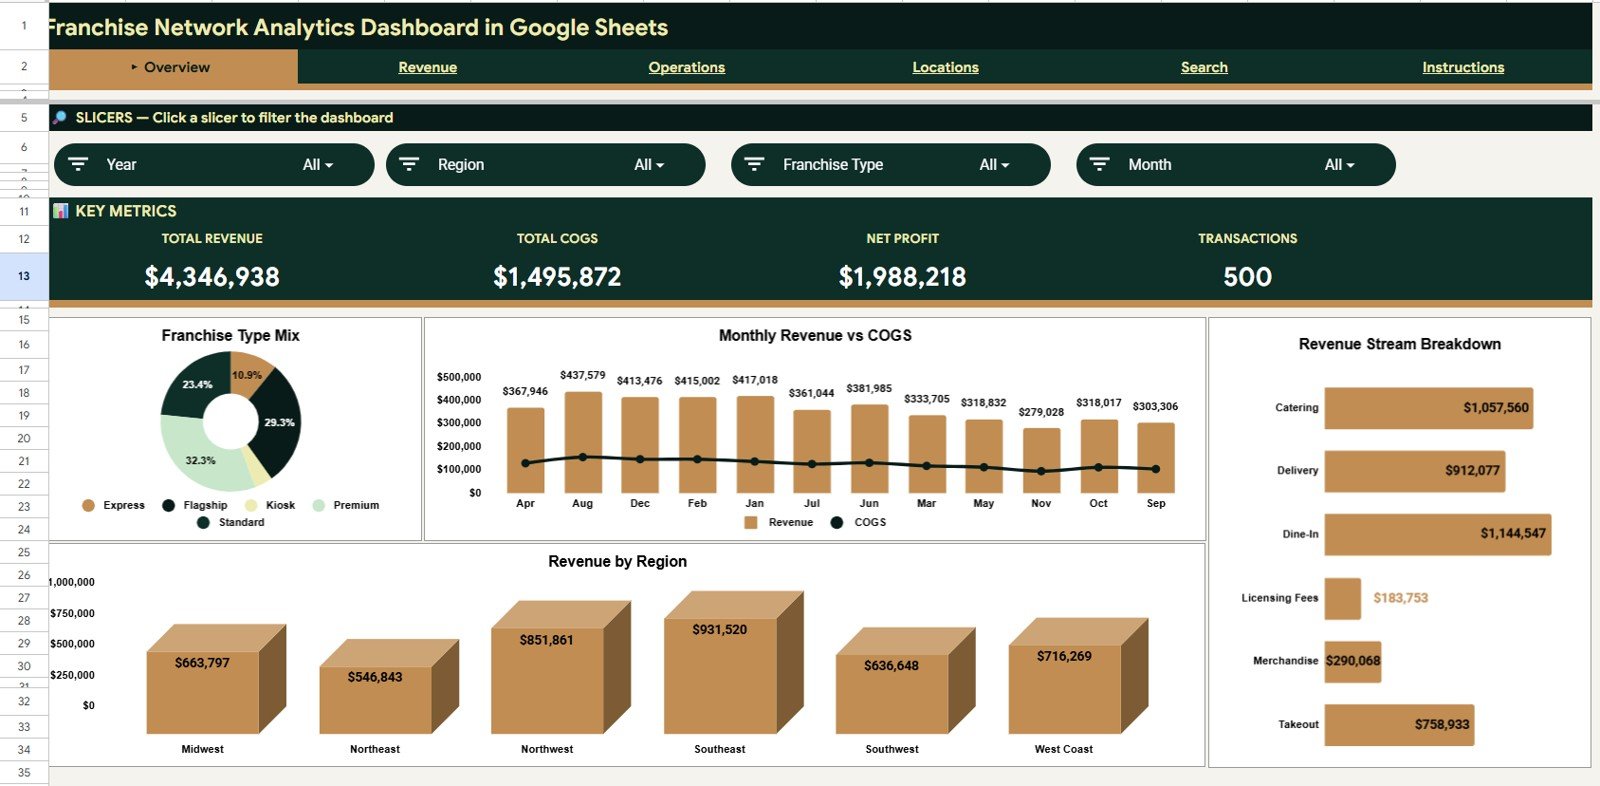
1. Overview Page
The Overview page displays Total Revenue, Total COGS, Net Profit, and Transactions across the top of the sheet. The chart area includes Franchise Type Mix by Franchise Type, Revenue and COGS by Month, Revenue by Region, and Revenue by Revenue Stream, making this the best page for weekly owner review meetings.
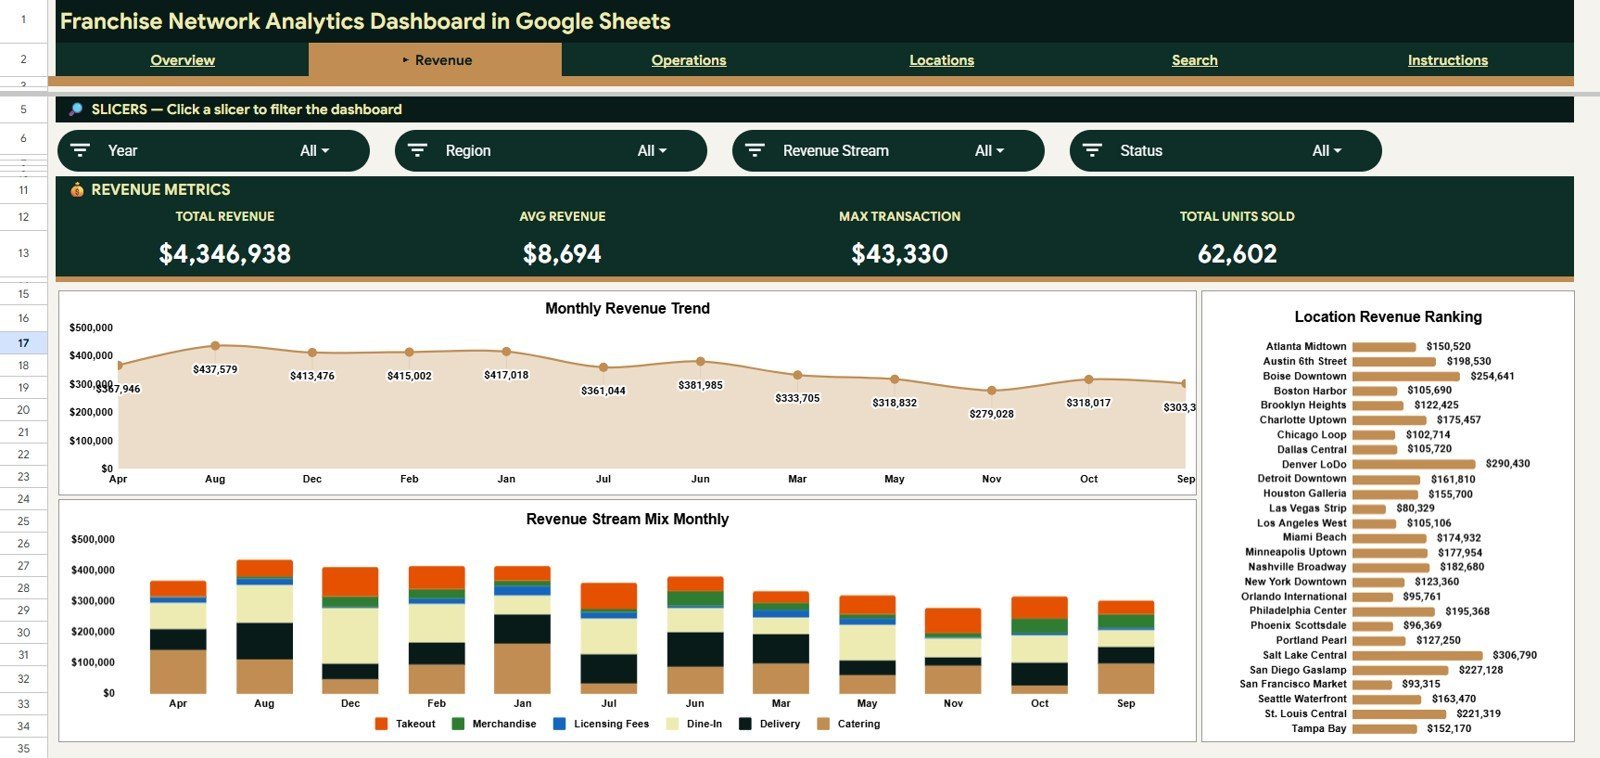
2. Revenue Page
The Revenue sheet focuses on income trends. Total Revenue by Month shows whether the network is growing or slowing; Revenue by Revenue Stream and Month compares channels over time; and Revenue by Location highlights the branches creating the highest top-line contribution.

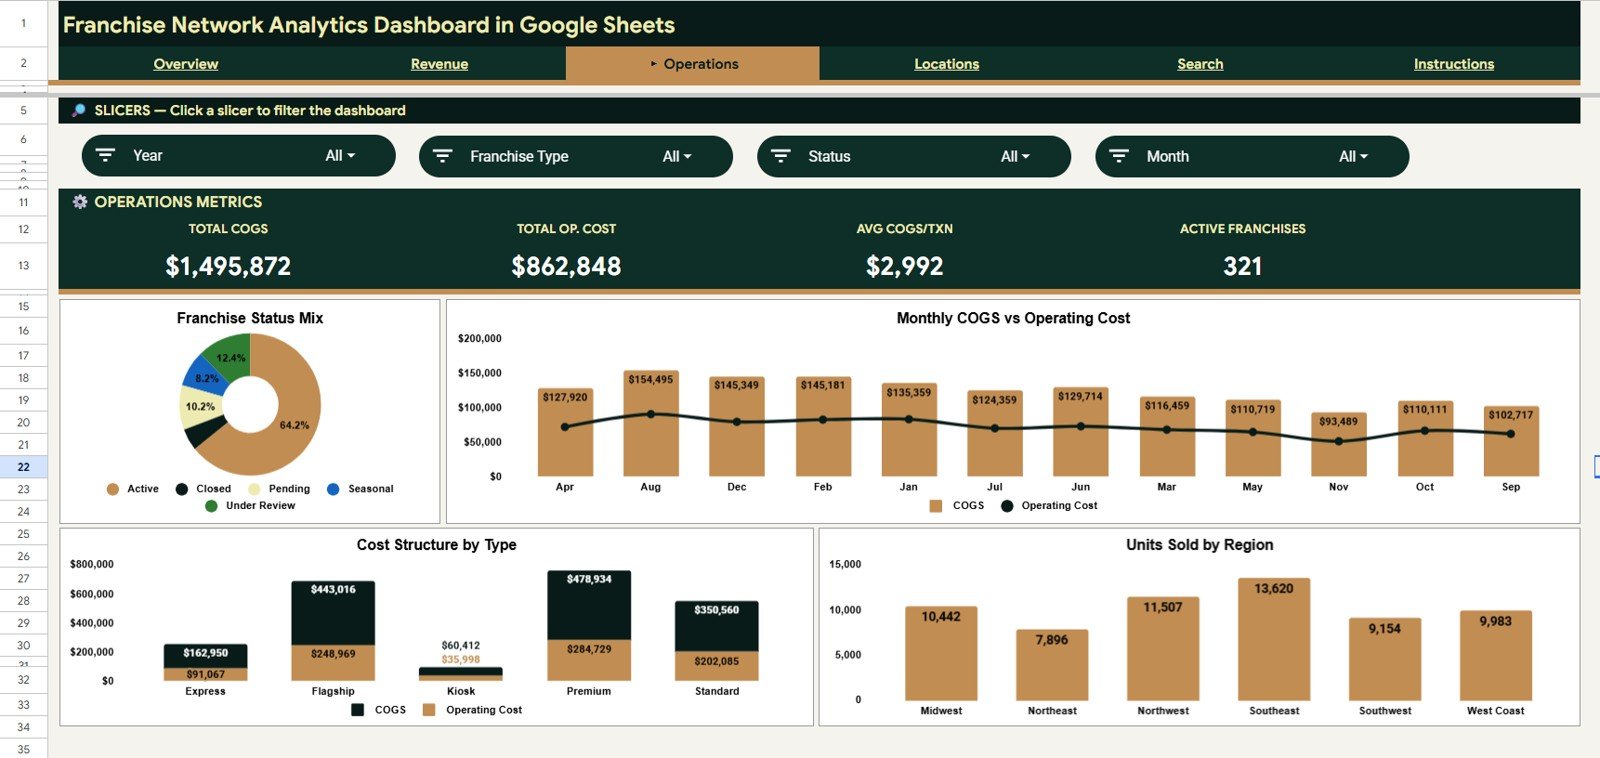
3. Operations Page
The Operations tab is built for cost and activity control. Franchise Count by Status shows active, pending, or closed operating states; COGS and Operating Cost by Month reveals cost movement; COGS and Operating Cost by Franchise Type compares franchise models; and Units Sold by Region helps managers connect volume with cost structure.
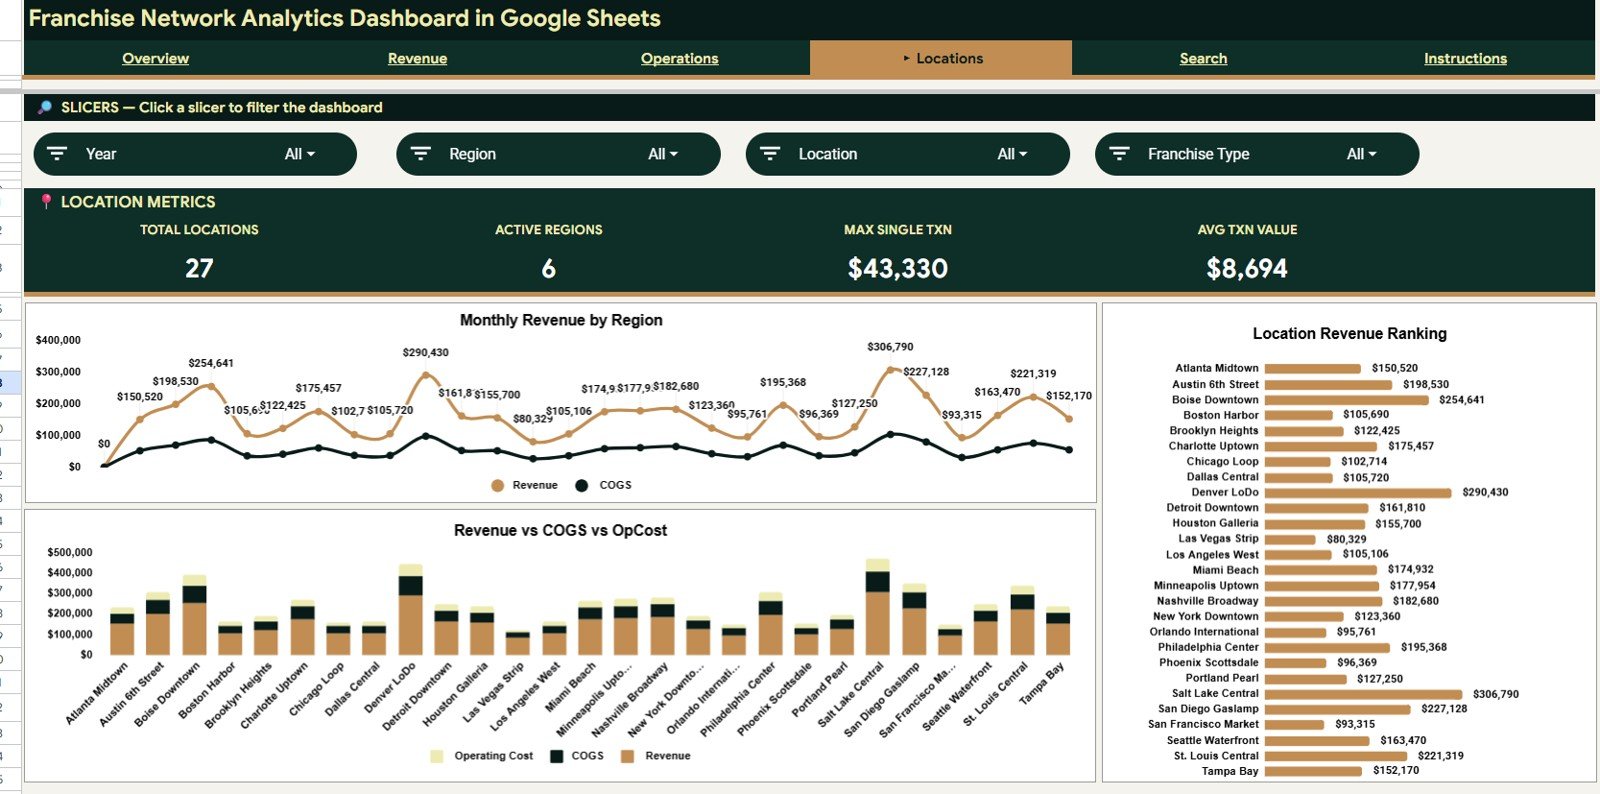
4. Locations Page
The Locations sheet compares the network geographically. Revenue and COGS by Region shows regional margin pressure, Revenue COGS and Operating Cost by Location ranks branches by financial contribution, and Revenue by Location makes top and bottom performers easy to spot.
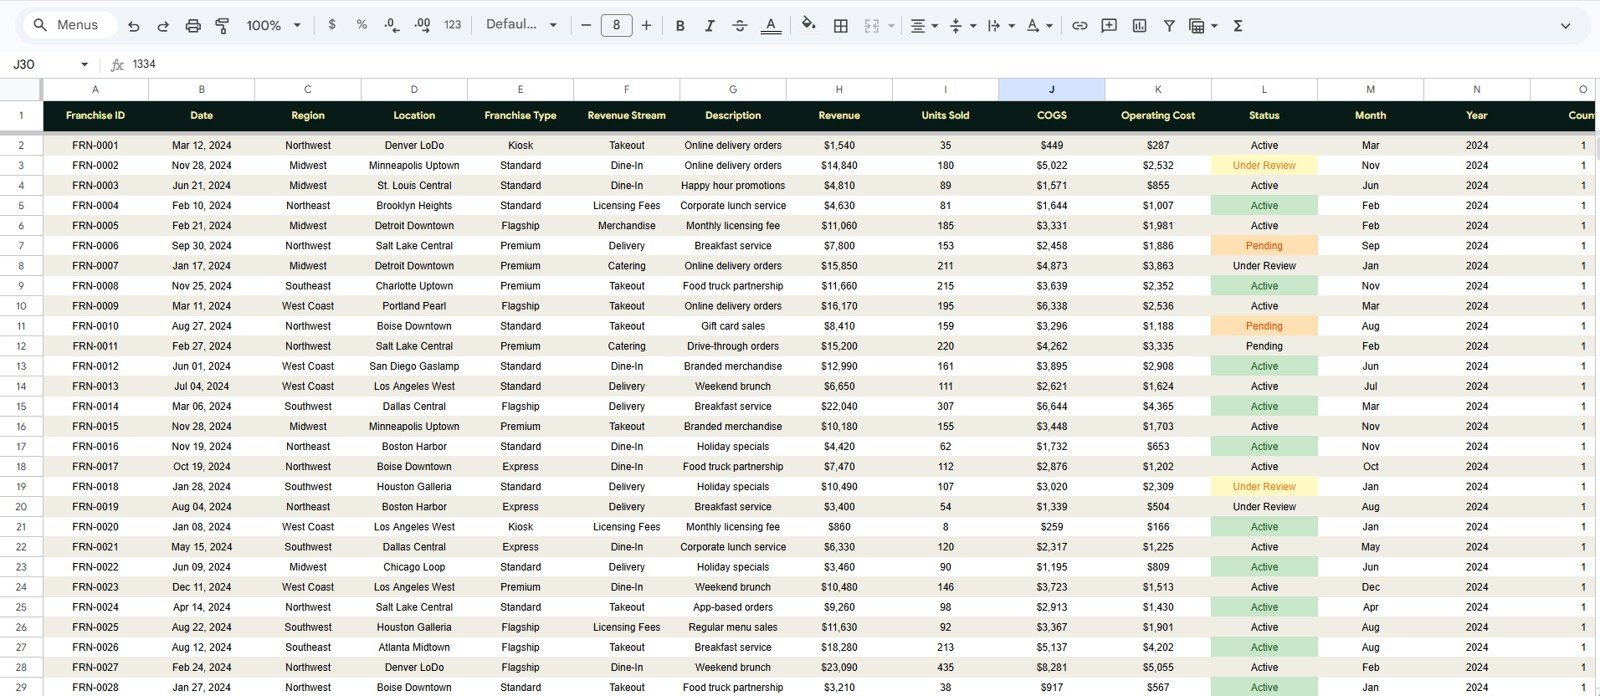
5. Data Sheet Tab
The Data sheet is where users add franchise transactions in the same column format. Keeping the structure consistent lets the KPI cards, slicers, charts, and lookup formulas continue updating correctly after new records are pasted.

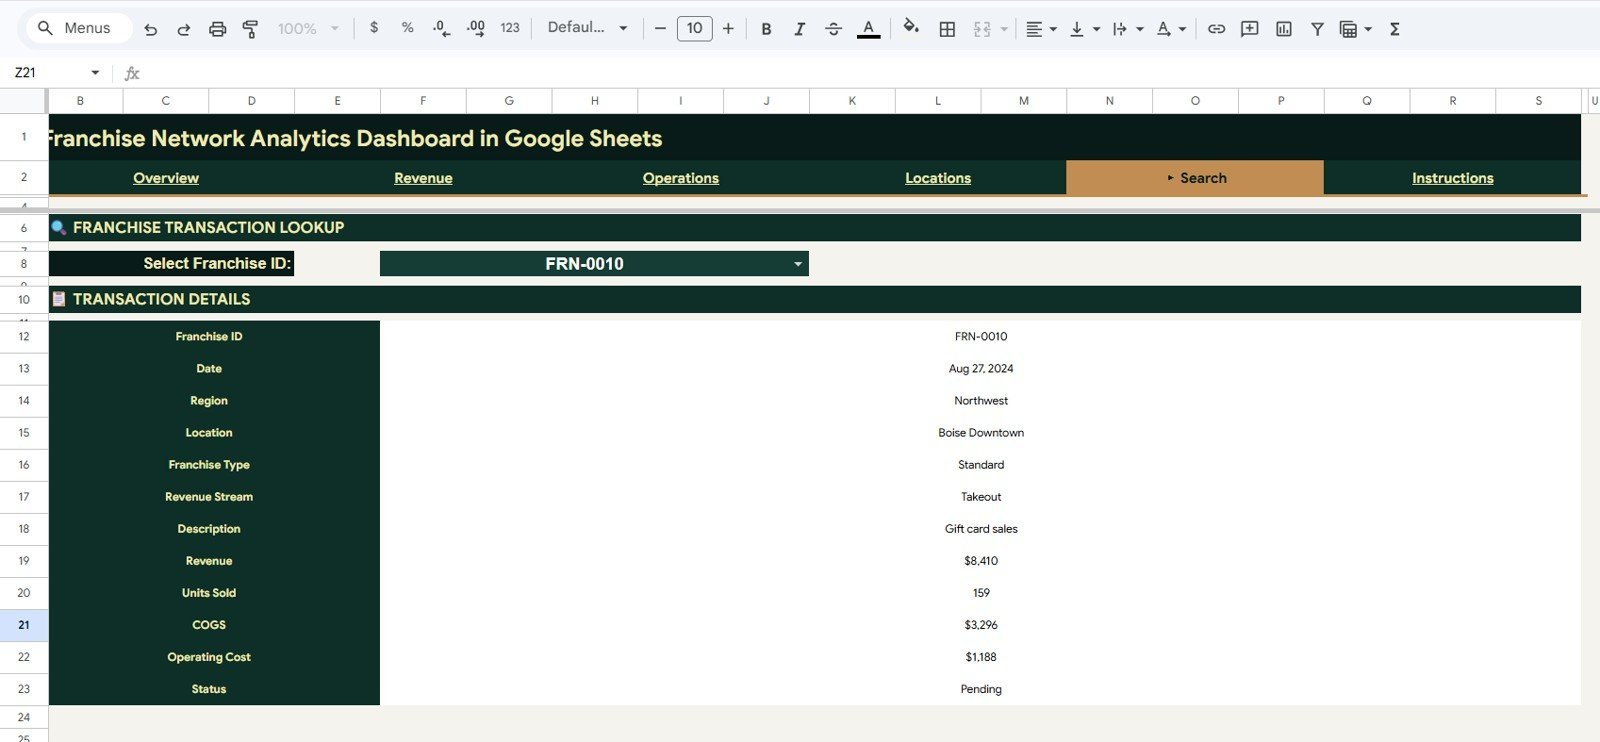
6. Search Sheet Tab
The Search sheet works as a franchise transaction lookup page. Select a Franchise ID and instantly view date, region, location, franchise type, revenue stream, description, revenue, units sold, COGS, operating cost, and status without scrolling through raw records.

Franchise Network Analytics Dashboard in Google Sheets vs. Microsoft Excel Dashboard vs. Paid Franchise SaaS – Where This Fits
| Feature | This Google Sheets Dashboard | Microsoft Excel Dashboard | Paid Franchise SaaS |
|---|---|---|---|
| Cost | $9.99 one-time | One-time template plus Excel access | Recurring software subscription |
| Platform | Google Sheets in browser | Excel desktop or Microsoft 365 | Vendor-hosted cloud platform |
| Setup time | Under 10 minutes with matching data | Under 10 minutes | Onboarding and configuration required |
| Real-time collaboration | Native Google Sheets sharing | Requires OneDrive or SharePoint setup | Usually included |
| Mobile access | Google Sheets app or browser | Limited editing experience | Usually included |
| Customizable fields | Fully editable formulas, charts, and tabs | Fully editable workbook | Vendor controlled |
| Franchise ID lookup | Included Search sheet | Possible with formulas or VBA | Usually available |
| Year-1 cost at 5 users | $9.99 plus your Google account | Template price plus licenses | Recurring plan and user/location costs |
Who This Template Is For – and Who It’s Not For
This template is for franchise owners, regional managers, QSR operators, retail network leaders, franchise consultants, and finance teams that need a clean shared dashboard for revenue, COGS, operating cost, transactions, units sold, status, and location performance.
It is not a replacement for POS integration, royalty automation, franchisee onboarding portals, compliance workflow software, or enterprise data warehouses. Larger networks with live operational feeds can still use it as a reporting layer after exporting standardized data.
How to Use the Franchise Network Analytics Dashboard in Google Sheets
- Open the PDF guide from the product download and use the Google Sheets copy link.
- Create your own editable copy in Google Drive.
- Go to the Data sheet and replace the sample rows with your franchise transaction records.
- Keep the same columns for Franchise ID, date, region, location, franchise type, revenue stream, revenue, units sold, COGS, operating cost, and status.
- Review the Overview, Revenue, Operations, and Locations pages.
- Use slicers to filter the dashboard quickly during review meetings.
- Use the Search sheet to investigate one Franchise ID at a time.
Real-World Use Cases
Amit, QSR Franchise Owner: Amit tracks revenue and COGS by month across 18 food locations and uses the Locations page to find which branch needs food-cost coaching.
Sarah, Retail Area Manager: Sarah filters by region during weekly reviews and compares units sold, operating cost, and revenue streams before visiting underperforming stores.
Carlos, Franchise Consultant: Carlos replaces the sample records with client data and uses the dashboard as a low-cost review pack for franchise operators who are not ready for expensive SaaS implementation.
Frequently Asked Questions
What does the Franchise Network Analytics Dashboard in Google Sheets track?
It tracks Total Revenue, Total COGS, Net Profit, Transactions, revenue streams, franchise type mix, location performance, units sold, operating cost, status, and transaction-level lookup details.
Can I use this with a free Google account?
Yes. The template runs in Google Sheets using standard spreadsheet features. For very large files, review Google Drive and Sheets file limits before adding extensive historical data.
How many pages are included?
The template includes Overview, Revenue, Operations, Locations, Data Sheet, and Search Sheet tabs.
Can I customize the charts?
Yes. You can edit charts, formulas, slicers, fields, colors, and worksheet tabs because the file is delivered as an editable Google Sheets template.
Is this a POS or royalty management system?
No. It is an analytics dashboard. Use it to review exported franchise data, not to process sales, collect payments, manage royalty billing, or run franchisee workflows.
How does the Search sheet work?
The user selects a Franchise ID and the sheet returns the full transaction details, including date, region, location, franchise type, revenue stream, revenue, units sold, COGS, operating cost, and status.
About the Author
Built by PK – Microsoft Certified Professional with 15+ years of Excel, Google Sheets, and Power BI experience. Founder of NextGenTemplates, reaching 300K+ subscribers across YouTube channels. Every template is hand-built and tested before release.
Explore Related Templates
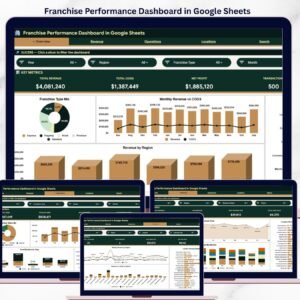
- Franchise Performance Dashboard in Google Sheets – a closely related franchise dashboard for revenue, COGS, and location analysis.
- Franchise Management KPI Dashboard in Google Sheets – KPI-focused MTD and YTD tracking for franchise networks.
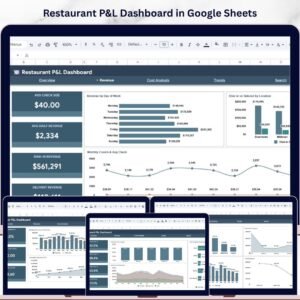
- Restaurant P&L Dashboard in Google Sheets – profit-and-loss tracking for restaurant franchise operators.
- Food Truck Dashboard in Google Sheets – mobile food business revenue and location analytics.
- Browse all Google Sheets Dashboard Templates.
Ready to review franchise revenue, COGS, operating cost, transactions, and locations in one shared spreadsheet? Download the Franchise Network Analytics Dashboard in Google Sheets and start replacing manual reporting with a cleaner dashboard workflow.
Watch the step-by-step video tutorial:
Last updated: May 20, 2026.


Reviews
There are no reviews yet.