

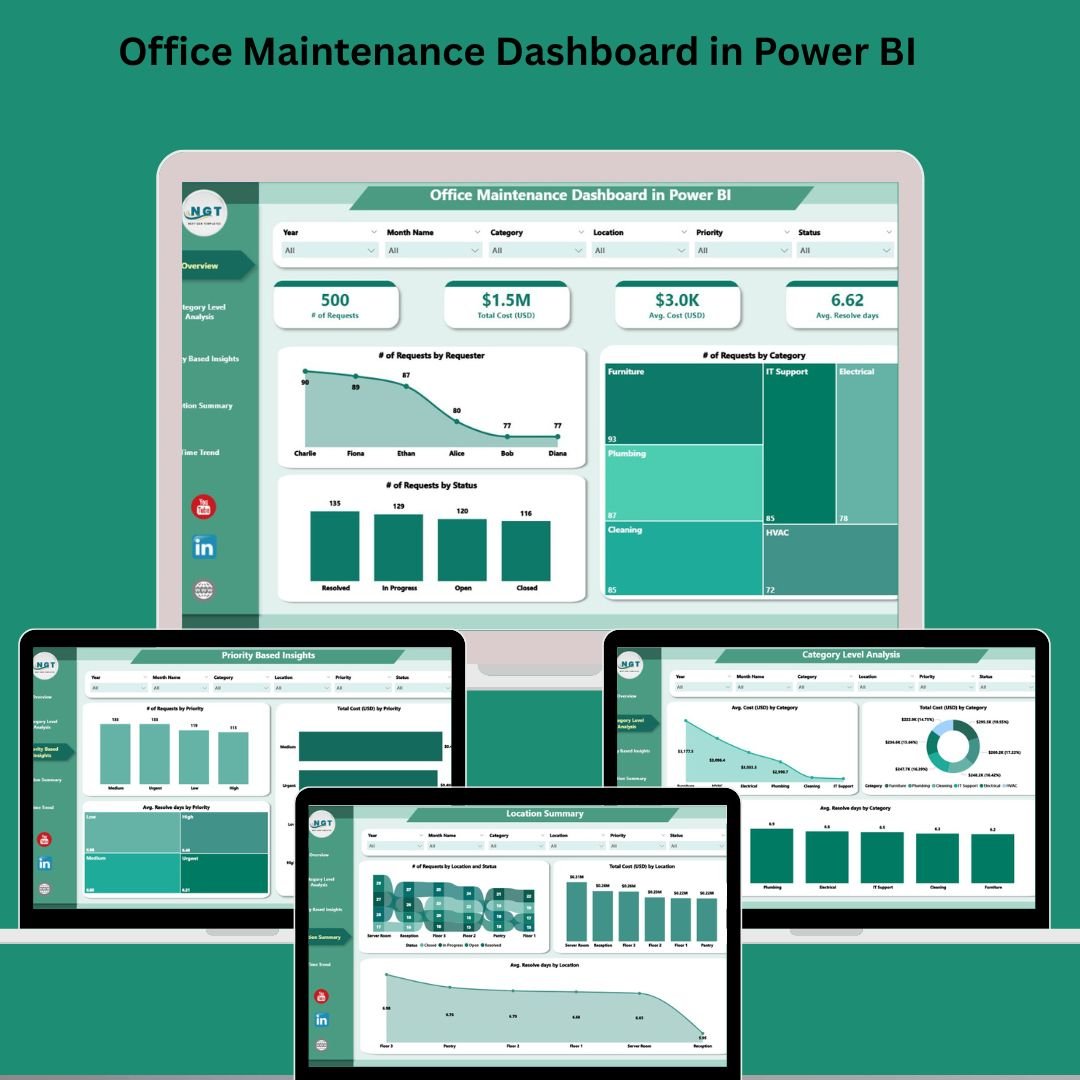

In the modern business world, office maintenance is no longer just about fixing what’s broken — it’s about proactive planning, efficient workflows, and cost control. Introducing the Office Maintenance Dashboard in Power BI — your all-in-one, interactive tool for tracking and managing office maintenance operations in real-time! 🔧📊
🛠️ Key Features of Office Maintenance Dashboard in Power BI
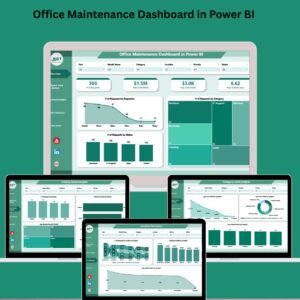
✅ Overview Page
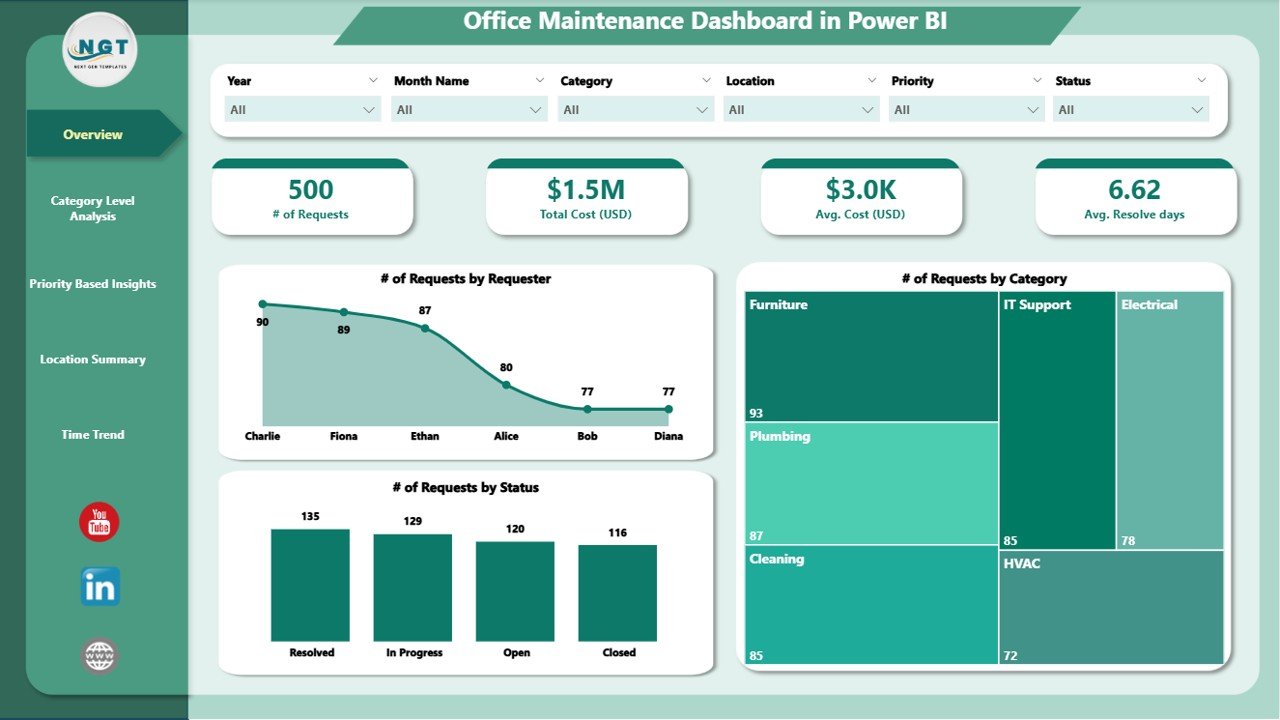
Get a clear snapshot of your maintenance ecosystem:
🎯 6 dynamic slicers for tailored filtering
🧾 5 KPI cards showcasing requests by Requestor, Category, and Status
📍 Instantly understand the volume and distribution of tasks
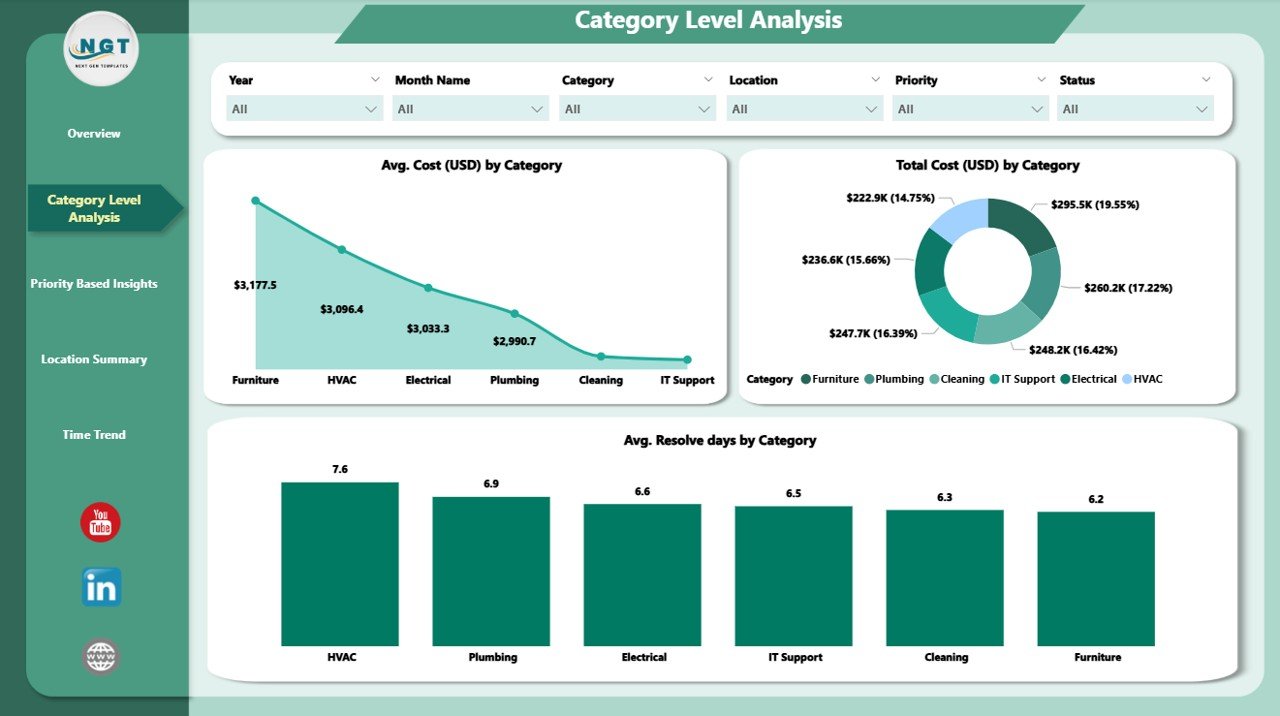
📂 Category Level Analysis
Break down expenses and resolution times by category:
💸 Avg. Cost (USD) by Category
📊 Total Cost (USD) by Category
⏳ Avg. Resolve Days by Category
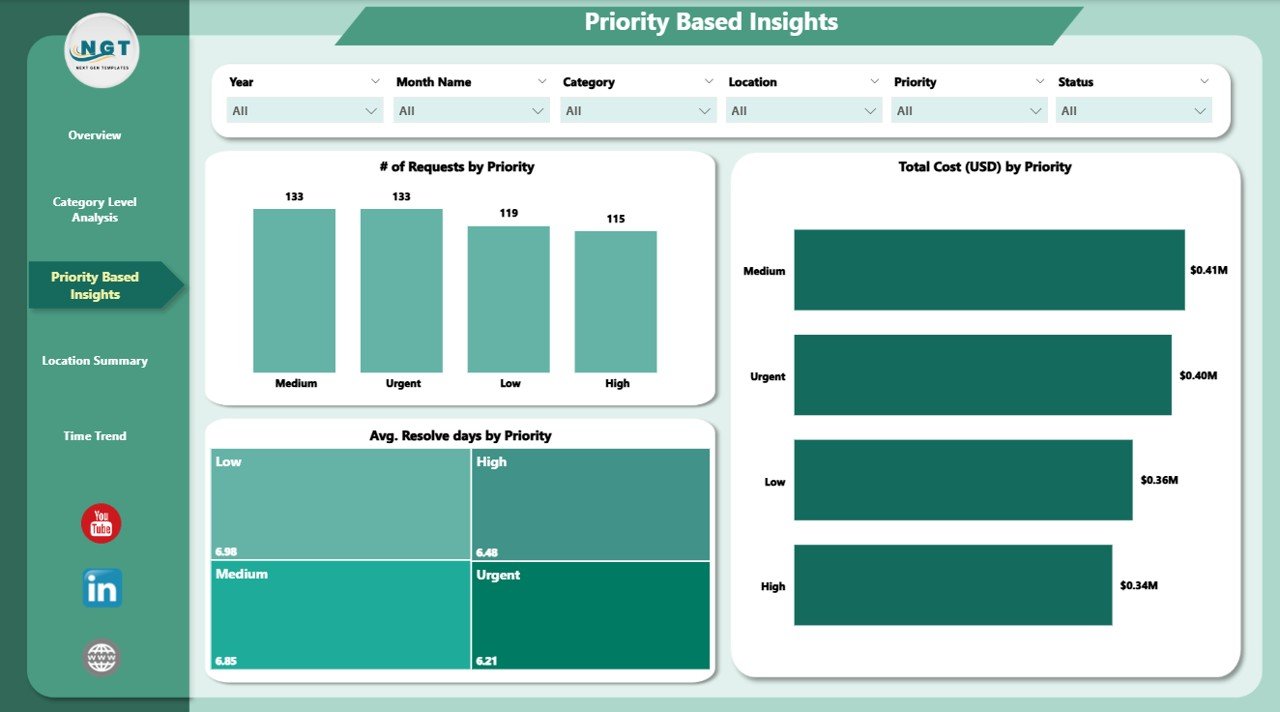
🔥 Priority-Based Insights
See how tasks are prioritized and how quickly they’re handled:
🚨 # of Requests by Priority
💰 Total Cost by Priority
⏱️ Avg. Resolve Days by Priority
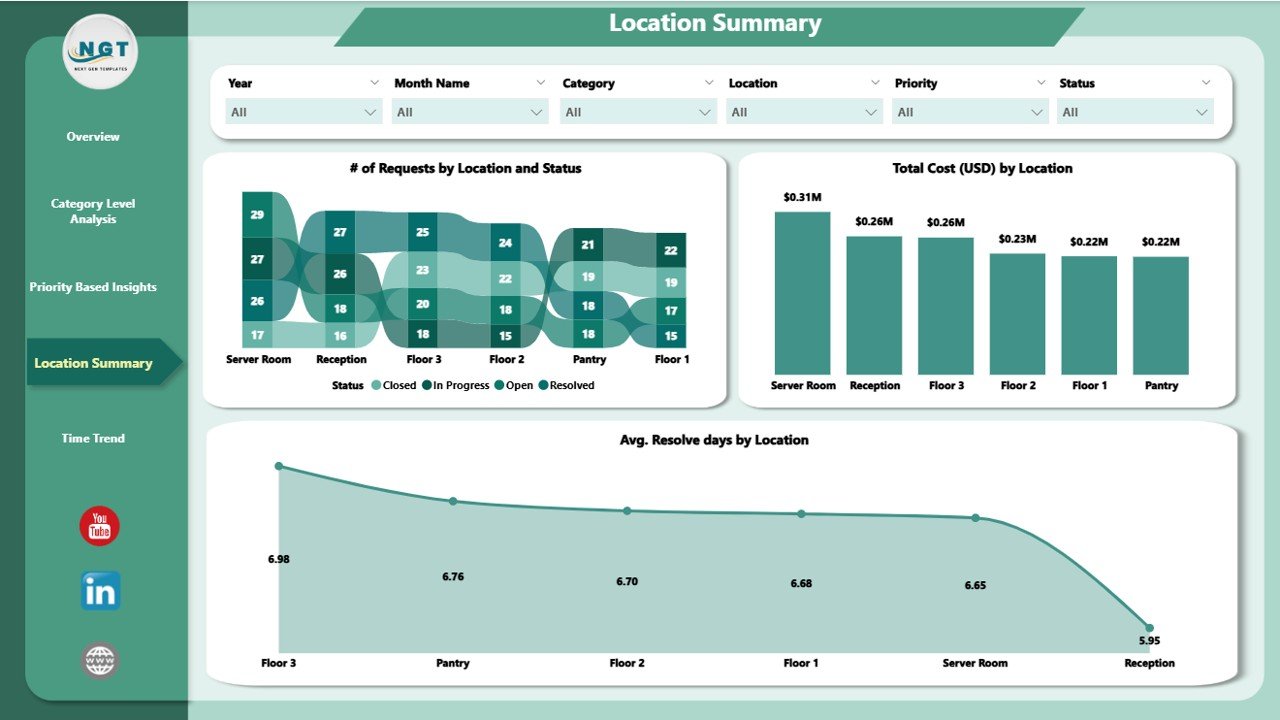
📍 Location Summary
Track what’s happening across all your office branches:
🗺️ # of Requests by Location and Status
💵 Total Cost by Location
⌛ Avg. Resolve Days by Location
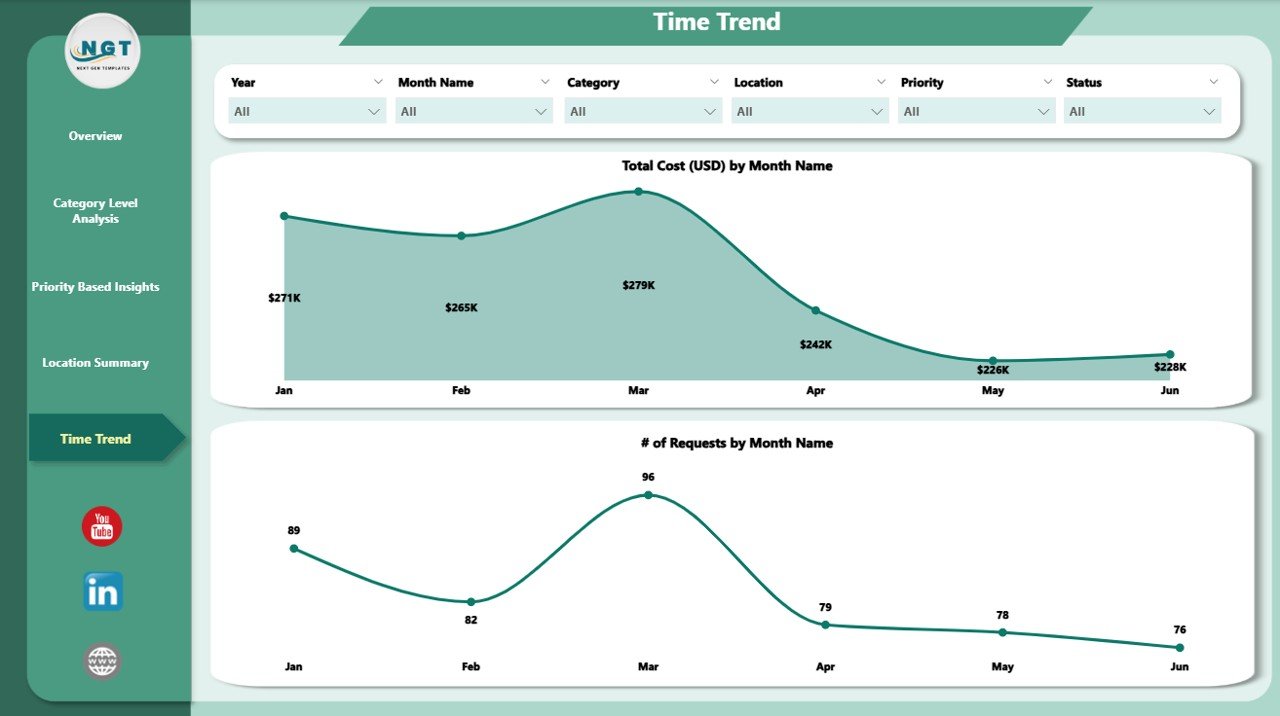
📅 Time Trend Tracking
Visualize maintenance trends across months:
📆 # of Requests by Month
💲 Total Cost by Month
📉 Easily identify peak maintenance periods
📦 What’s Inside the Office Maintenance Dashboard?
This ready-to-use Power BI template includes:
🧭 Interactive slicers on every page
🔎 Drill-down capabilities for detailed analysis
🏷️ Dynamic charts categorized by priority, location, category, and time
📤 Built-in filters and visual-level slicers
💼 Power-packed 5-page layout for full coverage
📁 Data fields to manage requests, cost, timeline, status & resolution
💡 How to Use the Office Maintenance Dashboard
It’s as easy as 1-2-3! 🙌
📥 Import your data: Use Excel or connected data sources to populate request information.
🎛️ Filter your view: Use slicers to explore by category, priority, or location.
🧠 Take action: Identify high-cost areas, overdue tickets, and improvement points using visual cues.
🔄 Update regularly to keep insights fresh and actionable. You can also set up automated data refreshes!
👥 Who Can Benefit from This Dashboard?
Whether you’re a facilities manager or part of a corporate admin team, this dashboard is made for:
🏢 Office Administrators who want to centralize task tracking
🧑🔧 Maintenance Managers looking to boost team productivity
💼 Business Analysts monitoring trends and costs
🌍 Multi-location Facility Teams needing a location-by-location breakdown
💡 Decision Makers aiming for better cost optimization and faster resolutions
🔗 Click here to read the Detailed Blog Post
📺 Visit our YouTube channel to learn step-by-step video tutorials
🔗 Youtube.com/@PKAnExcelExpert
Watch the step-by-step video tutorial:
Compatibility and Requirements
- Works in Power BI Desktop, which is free to download. Microsoft explains how to get it in Get Power BI Desktop.
- The dashboard reads request data from Excel or other connected data sources.
Frequently Asked Questions
How many pages does the dashboard have?
Five pages: Overview, Category Level Analysis, Priority-Based Insights, Location Summary and Time Trend Tracking.
What can I filter by?
The Overview page has 6 slicers, and the other pages have slicers and visual-level filters. You can narrow the view by category, priority, location and more.
Which costs and times does it track?
Average cost, total cost and average resolve days by category, priority and location. It also shows the number of requests and total cost by month.
Can I use it for more than one office location?
Yes. The Location Summary page shows requests by location and status, total cost by location and average resolve days by location.
Is there an Excel or Google Sheets version?
Yes. See the Office Maintenance Dashboard in Excel and the Office Maintenance Dashboard in Google Sheets.
Related Office and Maintenance Templates
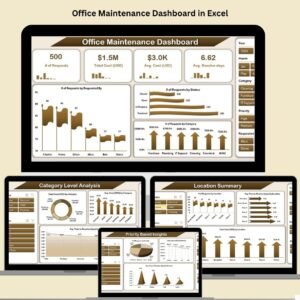
- Office Maintenance Dashboard in Excel: the same dashboard for Excel users
- Office Maintenance Dashboard in Google Sheets: a browser-based edition
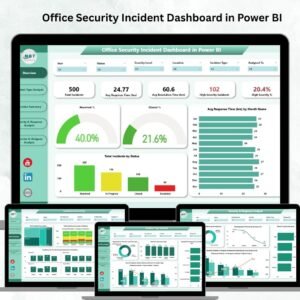
- Office Security Incident Dashboard in Power BI: another office dashboard in Power BI
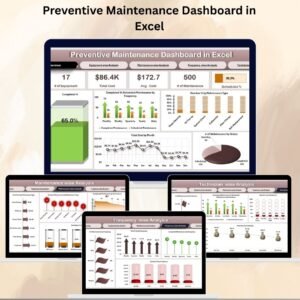
- Preventive Maintenance Dashboard in Excel: planned maintenance tracking
- Equipment Maintenance Log Tracker in Excel: a log for equipment servicing
Browse all Power BI dashboards.






























Reviews
There are no reviews yet.