

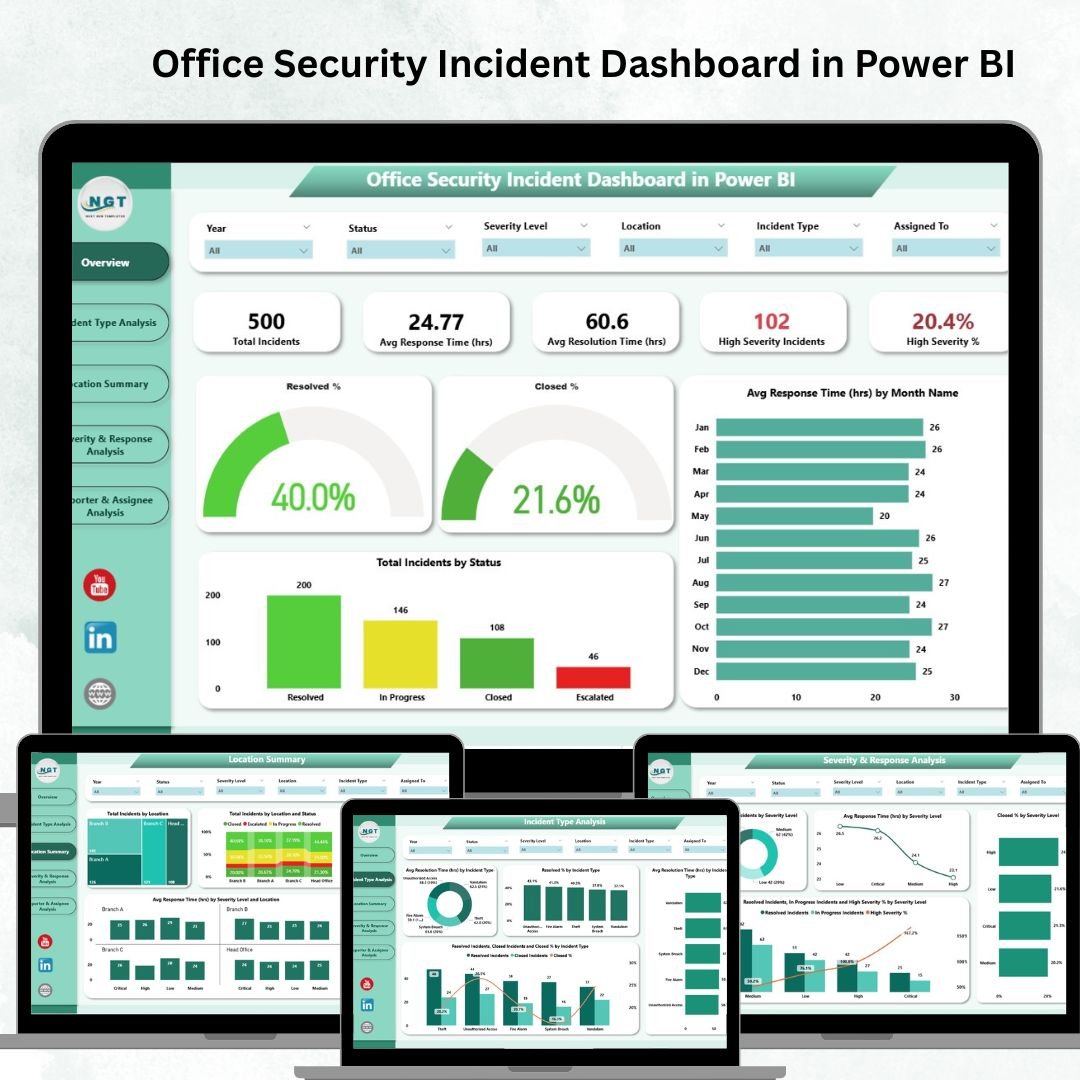

Maintaining a safe and secure office environment is no longer optional—it’s essential. With rising risks, organizations need real-time visibility into incidents, response times, and team efficiency. That’s where the Office Security Incident Dashboard in Power BI comes in. This powerful, ready-to-use dashboard empowers security teams, facility managers, and executives to monitor, analyze, and manage incidents with ease.
Instead of drowning in spreadsheets or delayed reports, your team gets a live, interactive view of office security metrics—helping you prevent risks, resolve incidents faster, and build a culture of safety.
✨ Key Features of the Office Security Incident Dashboard
📌 Centralized Incident Tracking: Consolidate all reported incidents into one interactive dashboard.
⚡ Real-Time Insights: See incidents as they happen and track metrics instantly.
🚨 Severity Analysis: Monitor high-severity cases, escalation rates, and resolution efficiency.
🌍 Location-Based Tracking: Identify high-risk areas and trends by office location.
📈 Performance Monitoring: Track response times and closure rates across your security team.
🎯 Customizable Filters: Drill down by incident type, location, severity, or reporter for tailored insights.
📂 What’s Inside the Office Security Incident Dashboard
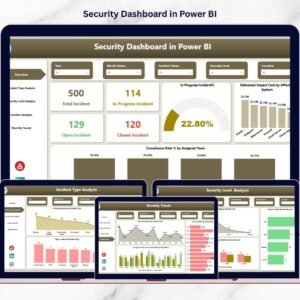
The dashboard includes multiple Power BI pages, each designed for actionable insights:
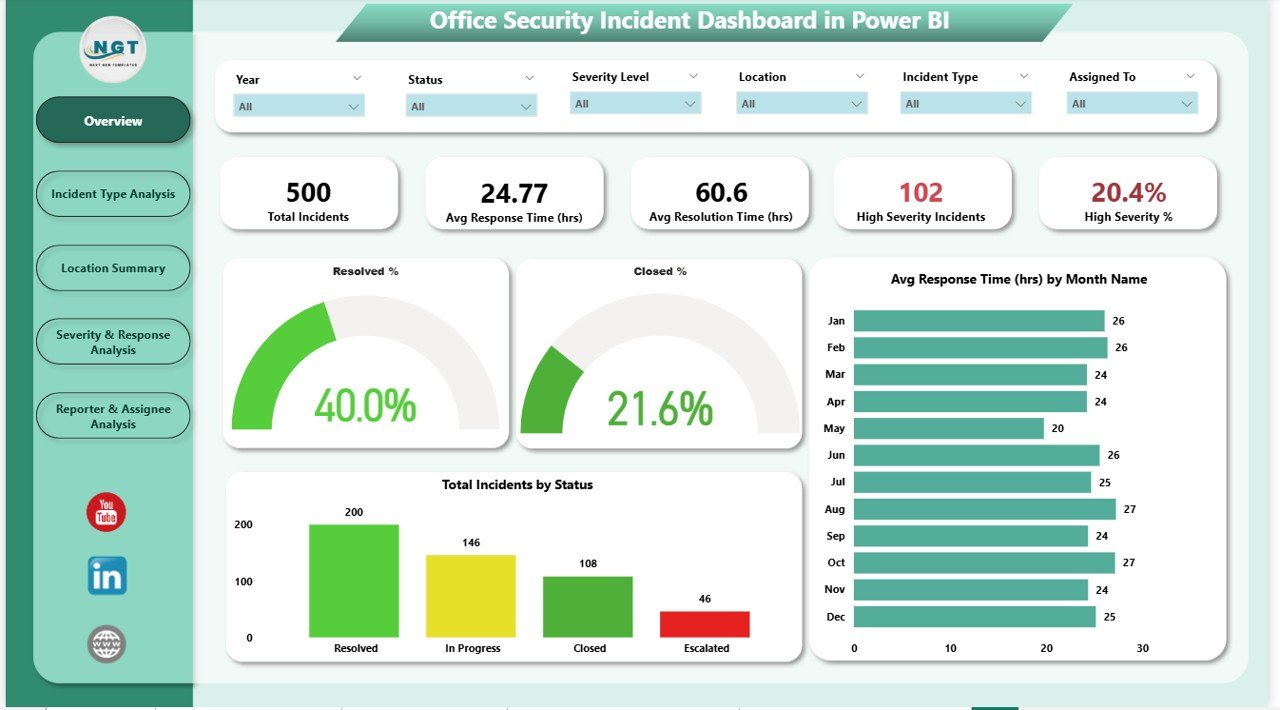
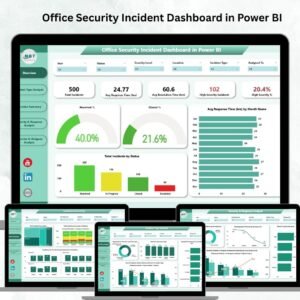
Overview Page:
Total Incidents
Avg. Response & Resolution Times
High Severity % & Incident Counts
Charts for status, trends, and closure rates
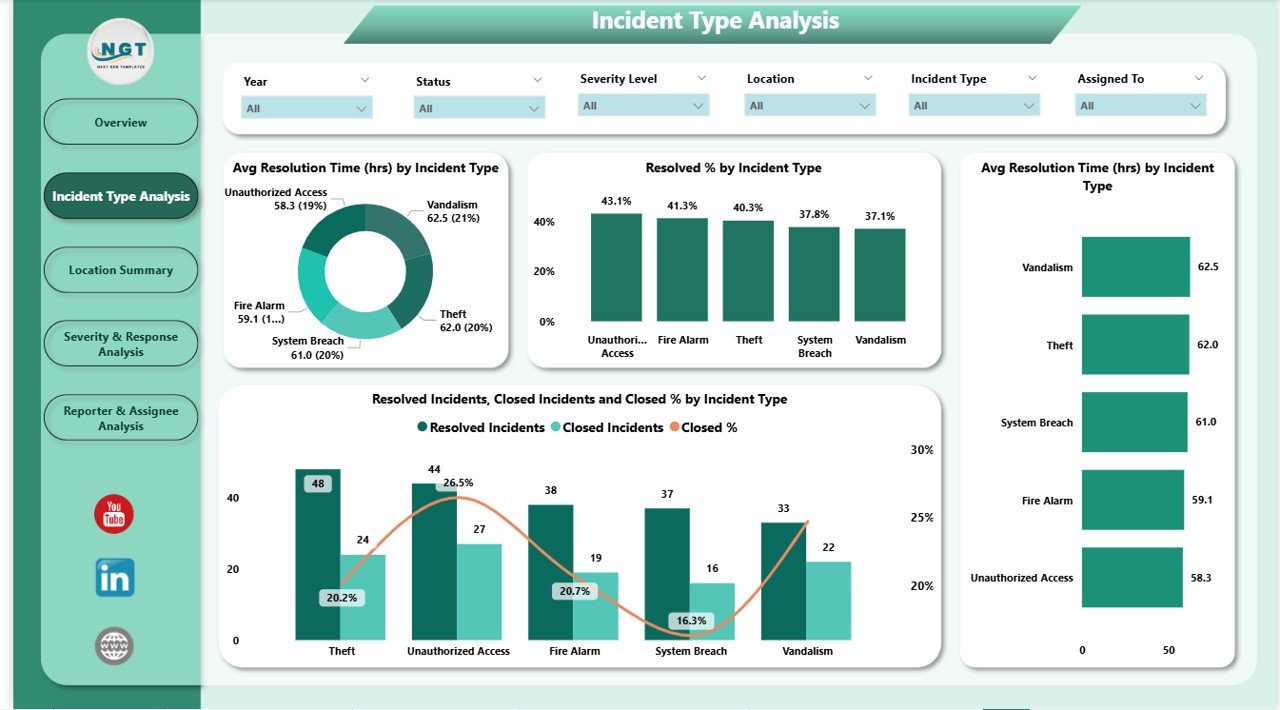
Incident Type Analysis:
Compare resolution success rates by incident type
Identify areas needing process improvements
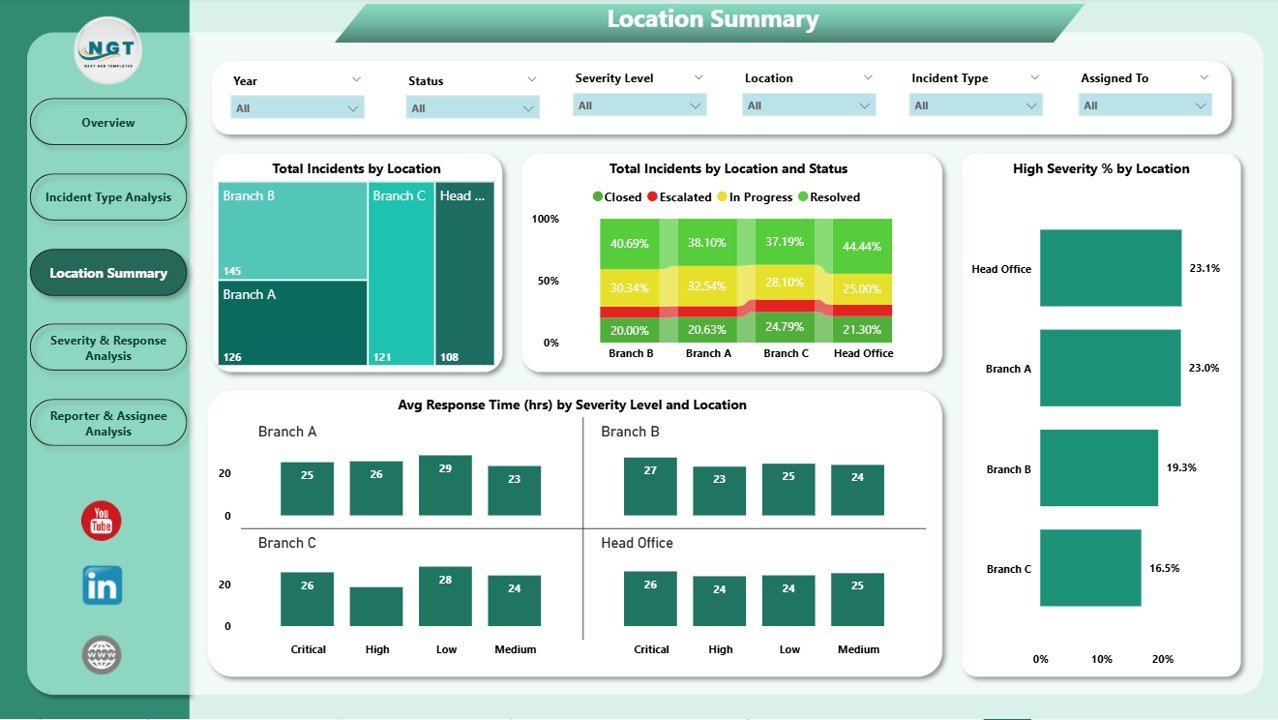
Location Summary:
Track incidents geographically
See efficiency by severity and location
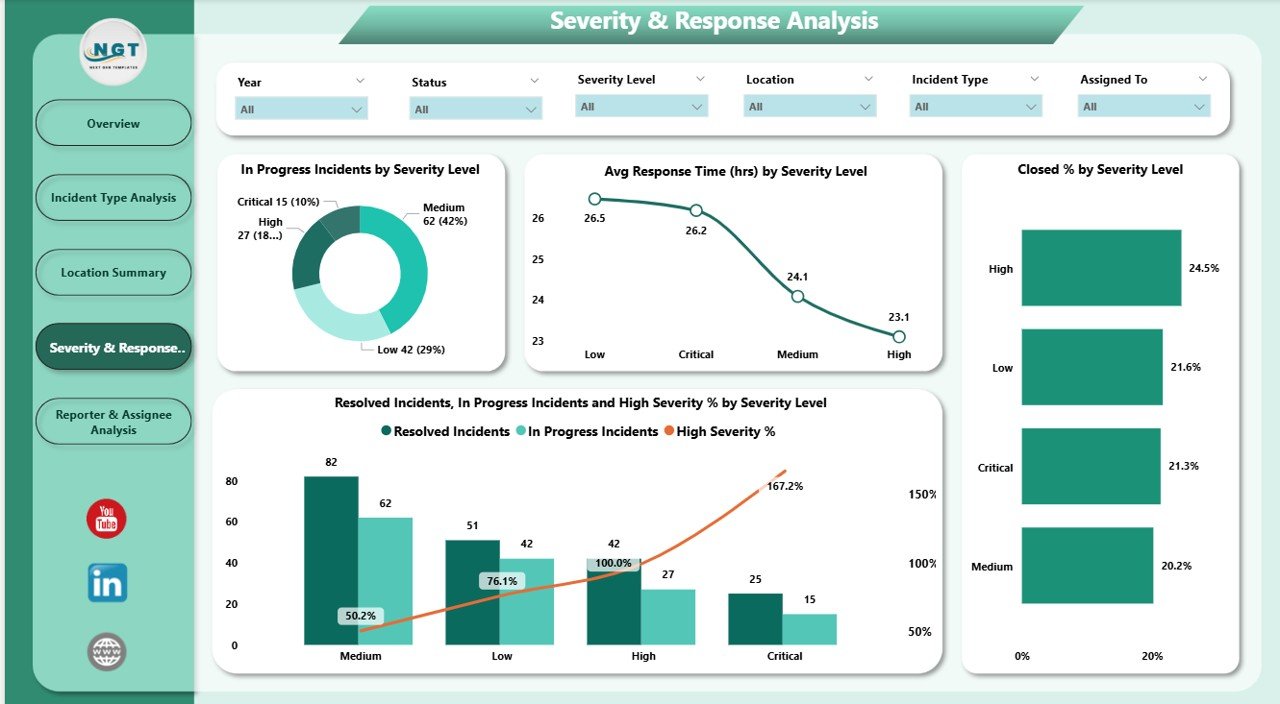
Severity & Response Analysis:
Monitor workload distribution by severity
Track closure efficiency and delays
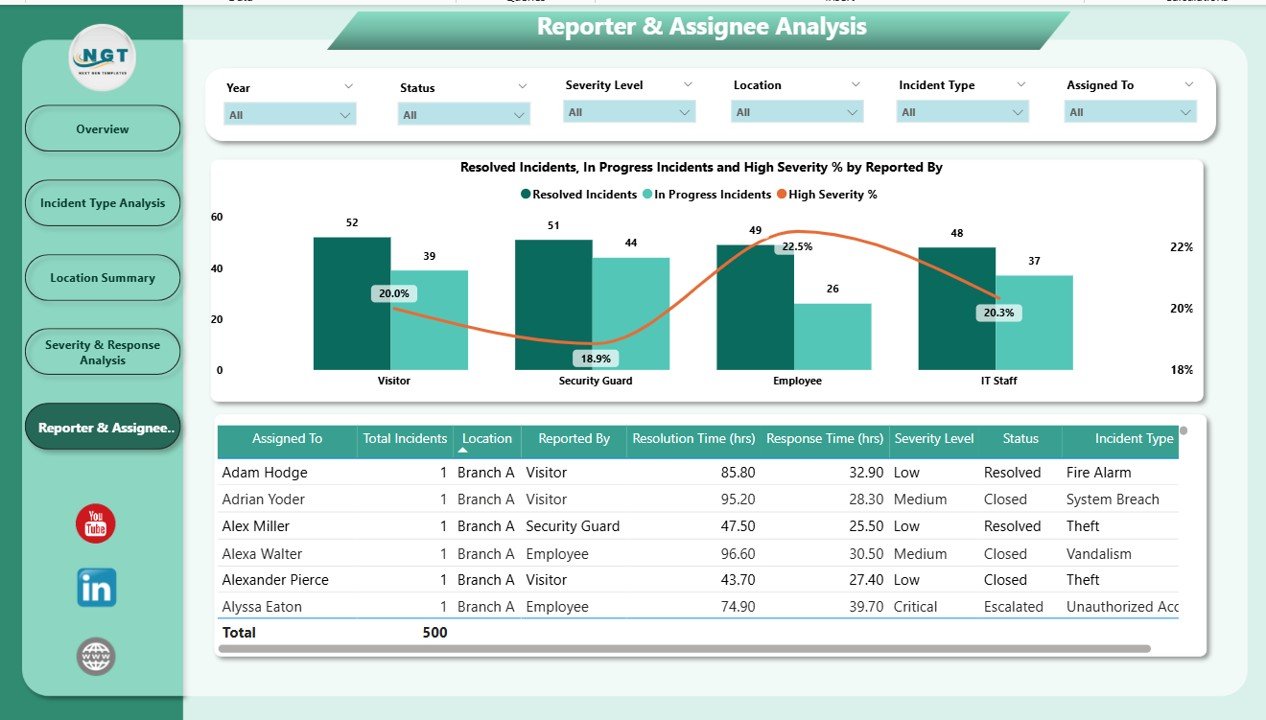
Reporter Analysis:
Measure reporting effectiveness by department/person
Optimize accountability and response
🛠 How to Use the Office Security Incident Dashboard
Connect Your Data: Link your incident log or security reports to Power BI.
Refresh in Real-Time: Ensure your dataset updates regularly (daily or live).
Use Filters & Drill-Throughs: Focus on specific incidents, regions, or severity levels.
Set Benchmarks: Define KPIs like max response time or resolution SLA.
Share Insights: Export or share live dashboards with leadership for better decision-making.
Within minutes, you’ll turn raw incident data into clear, actionable intelligence.
👥 Who Can Benefit from This Dashboard?
HR & Facility Managers 🏢 – Ensure workplace safety and compliance.
Security Teams 🚓 – Monitor efficiency, reduce delays, and prioritize high-risk cases.
Executives & Leadership 👔 – Gain transparency into security performance.
IT & Compliance Teams 💻 – Use insights to strengthen security protocols.
Multi-Location Offices 🌍 – Track incidents across branches for global security oversight.
🚀 Advantages of Using This Dashboard
Reduce Risk Exposure: Spot recurring issues before they escalate.
Improve Team Performance: Track response and resolution KPIs.
Enhance Reporting: Replace static reports with interactive insights.
Boost Efficiency: Save time with real-time tracking instead of manual logs.
Proactive Management: Anticipate high-risk trends with monthly analytics.
✅ Best Practices for Maximum Results
Update incident data daily or in real-time.
Focus on high-severity metrics for risk prioritization.
Segment data by type, location, and reporter for deeper insights.
Use monthly and quarterly trend reviews to strengthen safety strategies.
Integrate with ERP/incident systems for seamless updates.
📌 Click here to read the Detailed Blog Post
Watch the step-by-step video Demo:
📺 Visit our YouTube channel to learn step-by-step video tutorials → PKAnExcelExpert
Compatibility and Requirements
- Open the report in Power BI Desktop, which is free. Get it from Microsoft here: Get Power BI Desktop.
- You link your own incident log or security reports to the report and refresh it.
Frequently Asked Questions
Which pages does the Office Security Incident Dashboard include?
Overview, Incident Type Analysis, Location Summary, Severity and Response Analysis, and Reporter Analysis.
What does the Overview page show?
Total incidents, average response and resolution times, high severity % and incident counts, plus charts for status, trends and closure rates.
Can I filter by location or severity?
Yes. Filters and drill-throughs let you focus on incident type, location, severity or reporter.
Can I track performance by office location?
Yes. The Location Summary page tracks incidents by location and shows efficiency by severity and location.
Related Security and Incident Templates
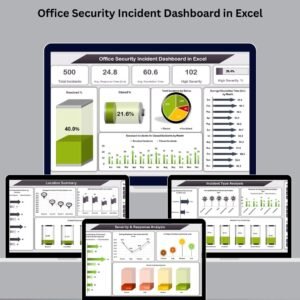
- Office Security Incident Dashboard in Excel: the same topic built in Excel
- Office Security Incident Report Tracker in Excel: log each incident as it happens
- Incident Report Tracker in Excel: a general incident log
- Workplace Safety and Incident Management Dashboard in Google Sheets: a Google Sheets view of safety incidents
- IT and Cybersecurity Operations Bundle: 8 IT and security templates in one bundle
Browse all Power BI dashboards or the Excel health and safety templates.




















Reviews
There are no reviews yet.