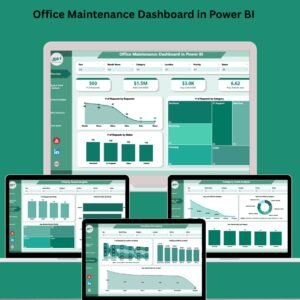
In the modern business world, office maintenance is no longer just about fixing what’s broken — it’s about proactive planning, efficient workflows, and cost control. Introducing the Office Maintenance Dashboard in Power BI — your all-in-one, interactive tool for tracking and managing office maintenance operations in real-time! 🔧📊
🛠️ Key Features of Office Maintenance Dashboard in Power BI
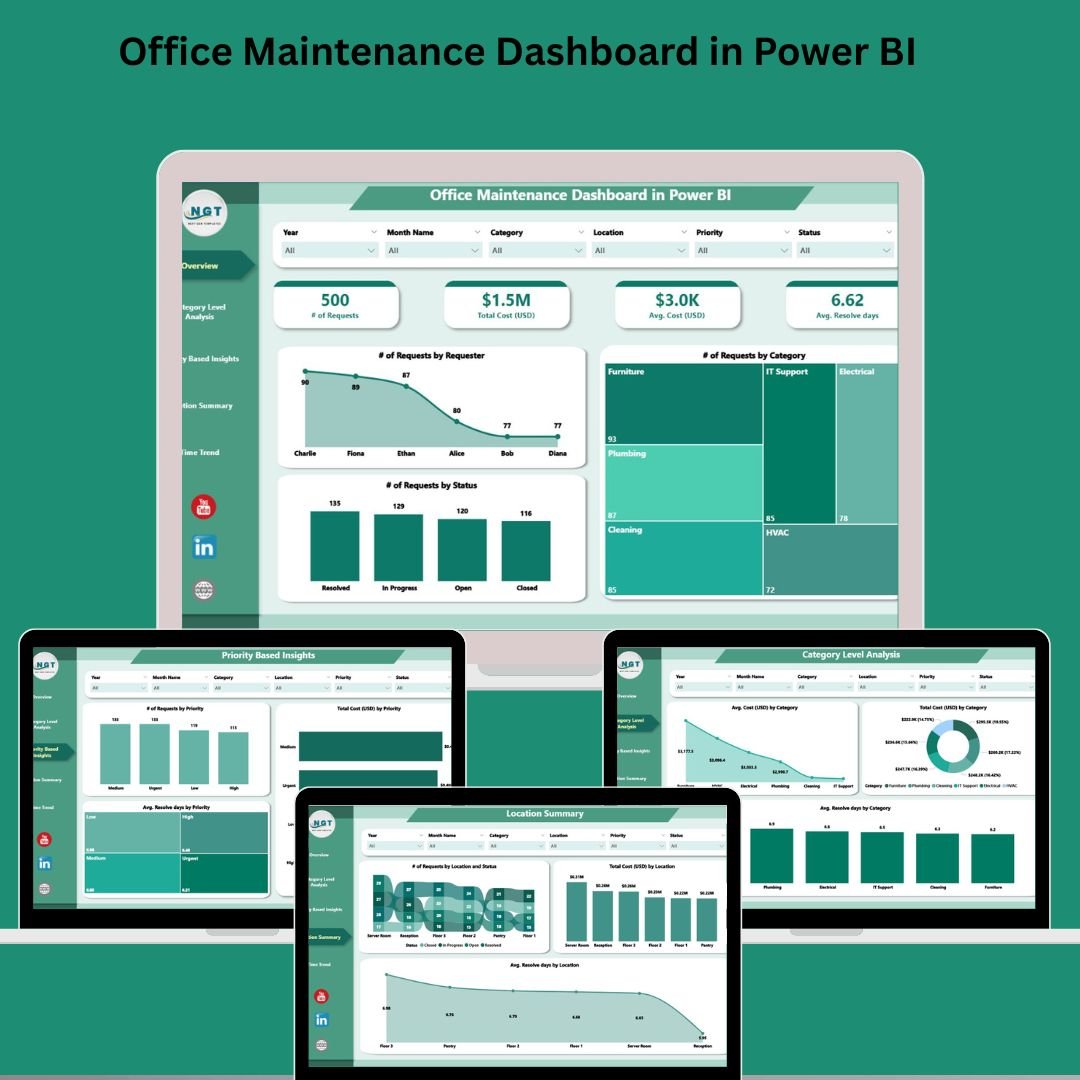
✅ Overview Page
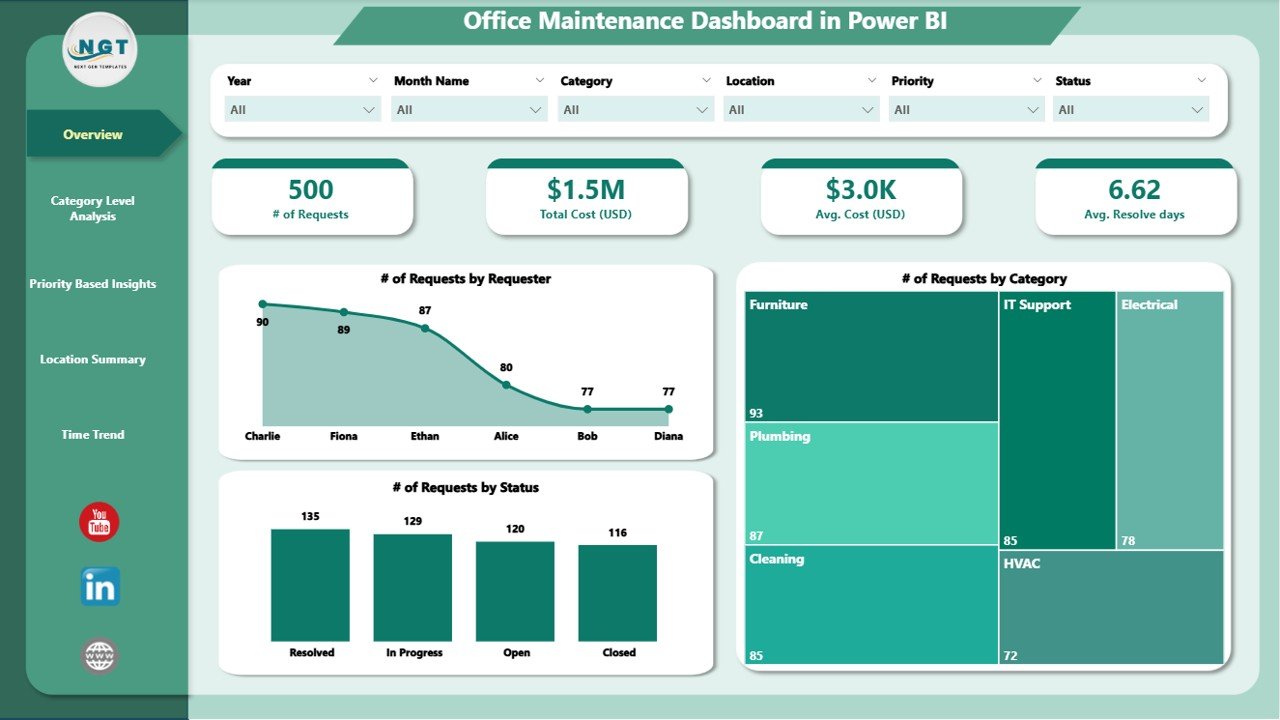
Get a clear snapshot of your maintenance ecosystem:
🎯 6 dynamic slicers for tailored filtering
🧾 5 KPI cards showcasing requests by Requestor, Category, and Status
📍 Instantly understand the volume and distribution of tasks
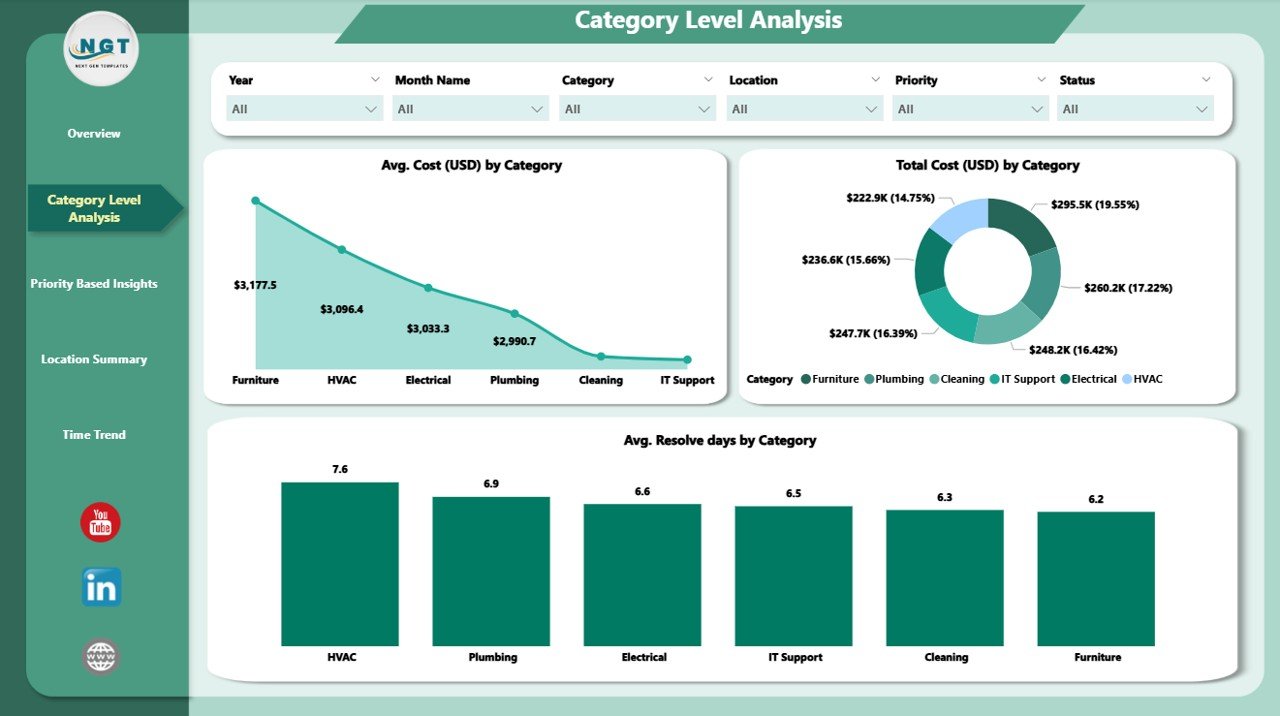
📂 Category Level Analysis
Break down expenses and resolution times by category:
💸 Avg. Cost (USD) by Category
📊 Total Cost (USD) by Category
⏳ Avg. Resolve Days by Category
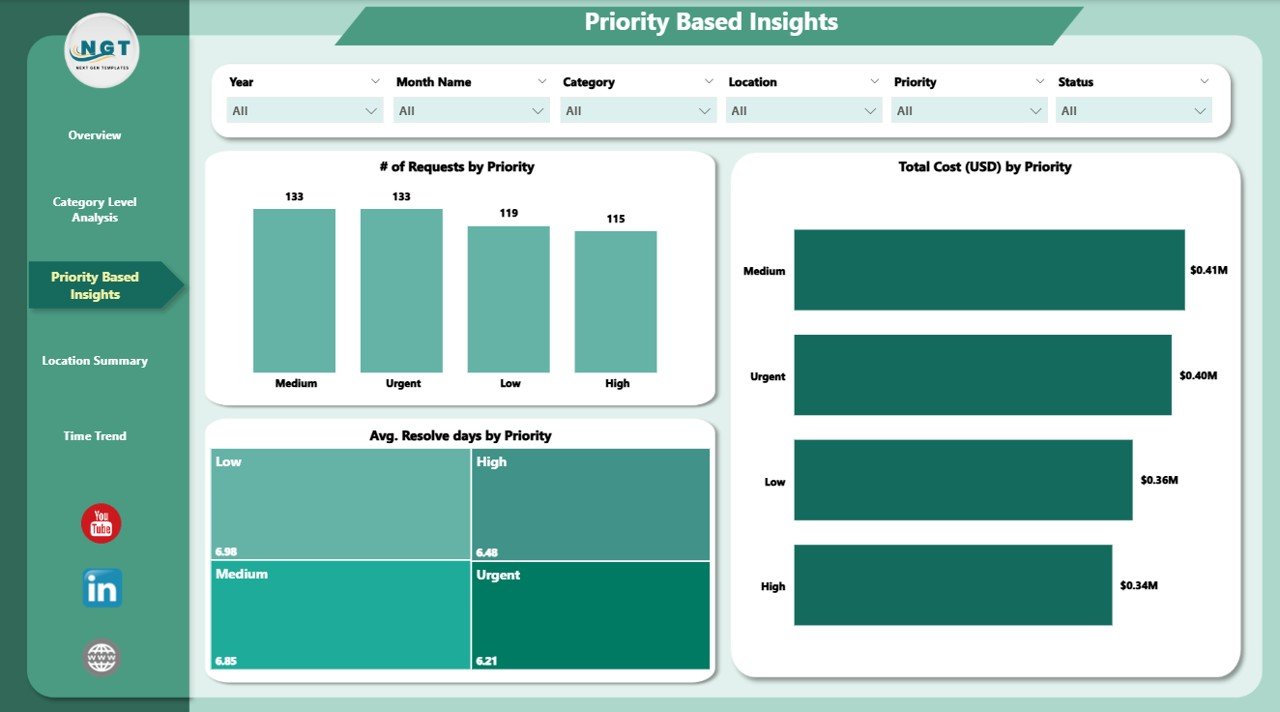
🔥 Priority-Based Insights
See how tasks are prioritized and how quickly they’re handled:
🚨 # of Requests by Priority
💰 Total Cost by Priority
⏱️ Avg. Resolve Days by Priority
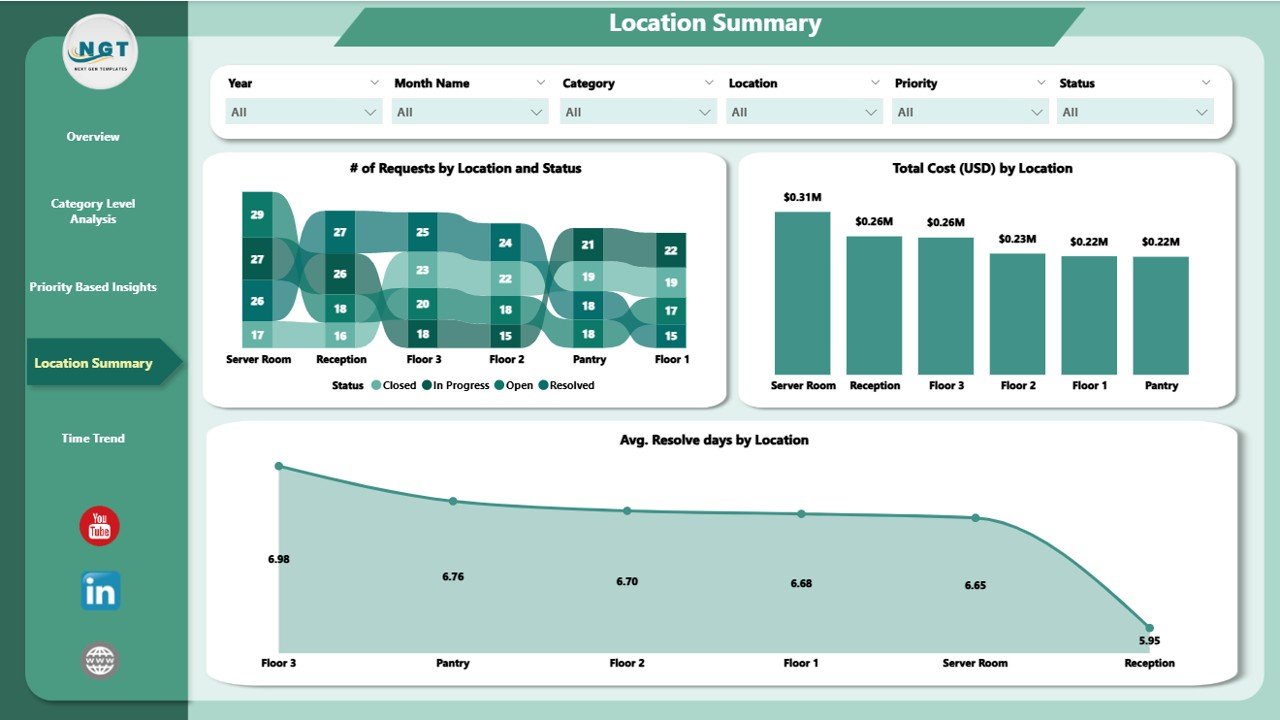
📍 Location Summary
Track what’s happening across all your office branches:
🗺️ # of Requests by Location and Status
💵 Total Cost by Location
⌛ Avg. Resolve Days by Location
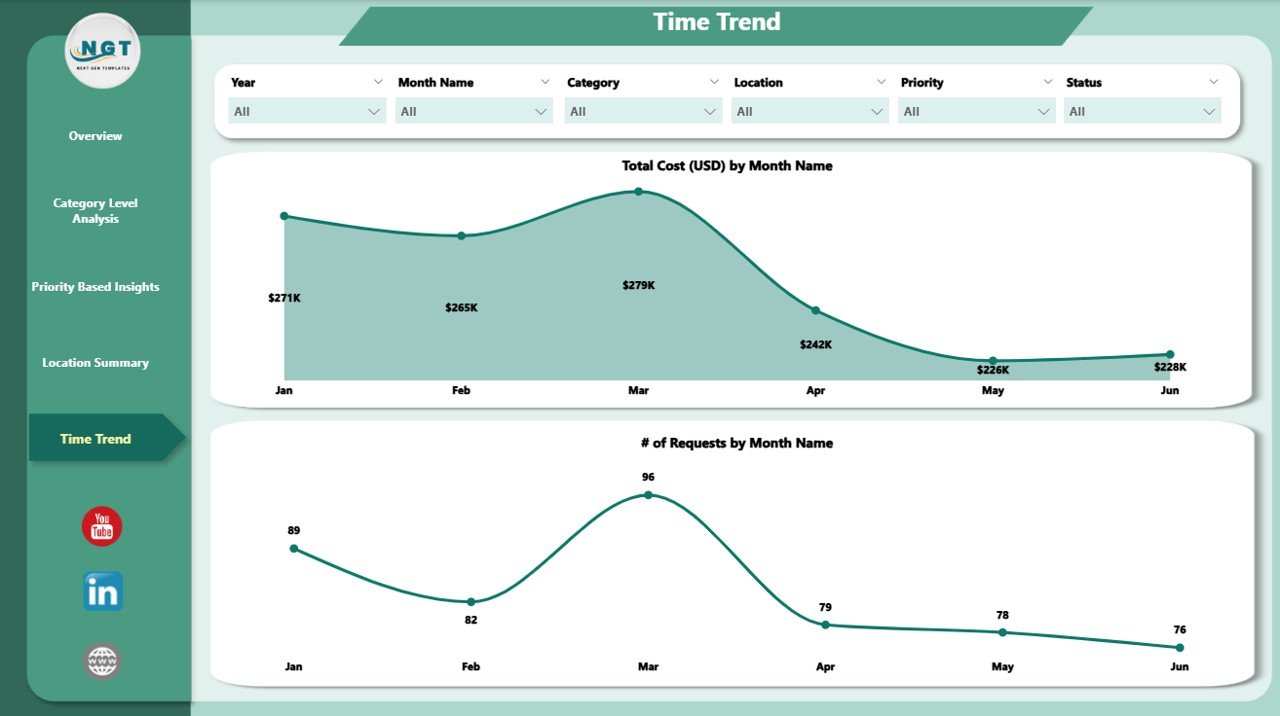
📅 Time Trend Tracking
Visualize maintenance trends across months:
📆 # of Requests by Month
💲 Total Cost by Month
📉 Easily identify peak maintenance periods
📦 What’s Inside the Office Maintenance Dashboard?
This ready-to-use Power BI template includes:
🧭 Interactive slicers on every page
🔎 Drill-down capabilities for detailed analysis
🏷️ Dynamic charts categorized by priority, location, category, and time
📤 Built-in filters and visual-level slicers
💼 Power-packed 5-page layout for full coverage
📁 Data fields to manage requests, cost, timeline, status & resolution
💡 How to Use the Office Maintenance Dashboard
It’s as easy as 1-2-3! 🙌
📥 Import your data: Use Excel or connected data sources to populate request information.
🎛️ Filter your view: Use slicers to explore by category, priority, or location.
🧠 Take action: Identify high-cost areas, overdue tickets, and improvement points using visual cues.
🔄 Update regularly to keep insights fresh and actionable. You can also set up automated data refreshes!
👥 Who Can Benefit from This Dashboard?
Whether you’re a facilities manager or part of a corporate admin team, this dashboard is made for:
🏢 Office Administrators who want to centralize task tracking
🧑🔧 Maintenance Managers looking to boost team productivity
💼 Business Analysts monitoring trends and costs
🌍 Multi-location Facility Teams needing a location-by-location breakdown
💡 Decision Makers aiming for better cost optimization and faster resolutions
🔗 Click here to read the Detailed Blog Post
📺 Visit our YouTube channel to learn step-by-step video tutorials
🔗 Youtube.com/@PKAnExcelExpert