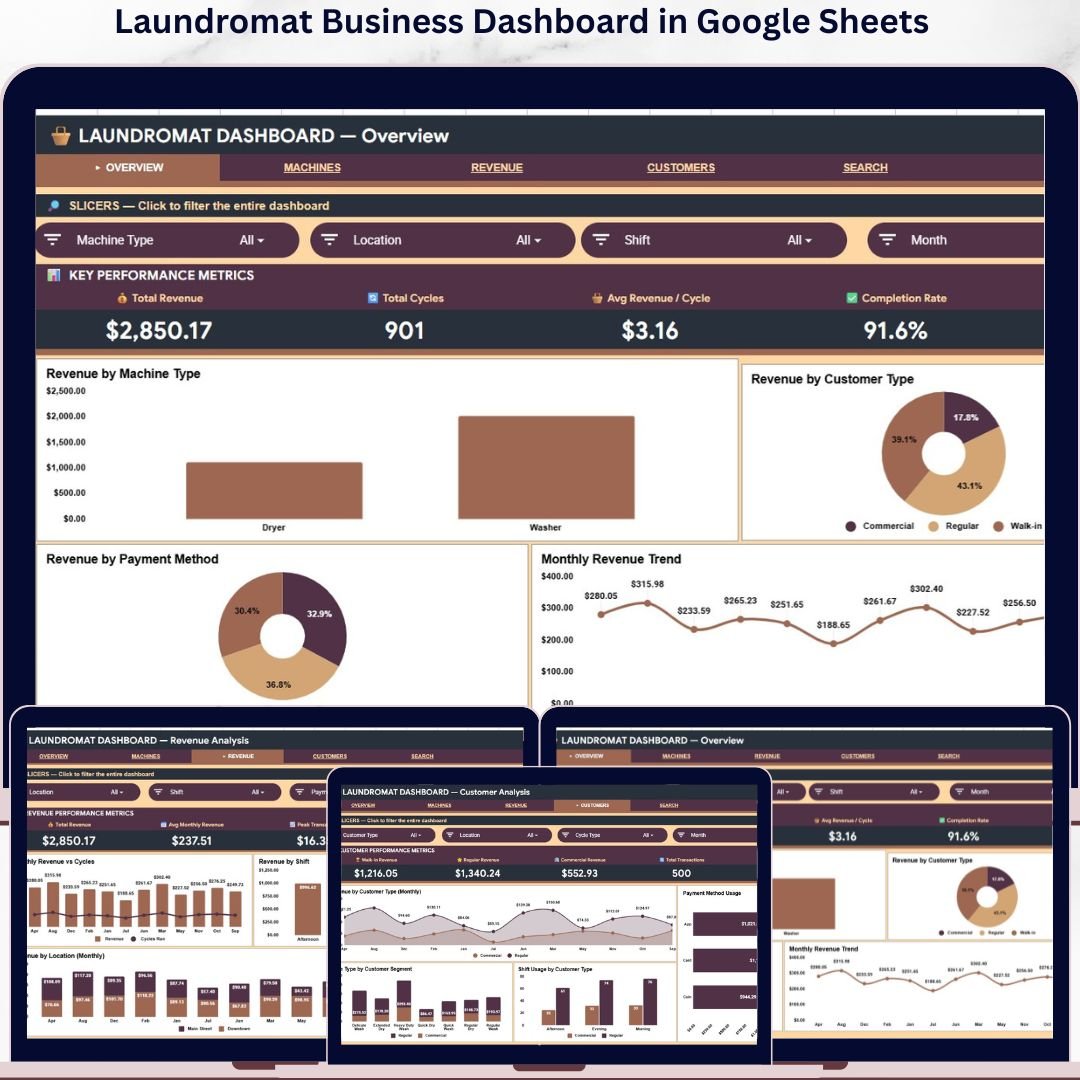
The Laundromat Business Dashboard in Google Sheets tracks 4 executive KPIs across 6 interactive sheets, with 16 pre-built charts, 4 machine-level analyses, and a built-in Transaction Search tool. Setup takes under 5 minutes — just open the shared Google Sheet, click File > Make a copy, replace the sample transactions with your own, and every chart, KPI, and analytics view updates automatically.
🌍 Join 8,400+ teams in 40+ countries using NextGenTemplates to replace paid SaaS tools with one-time-purchase Excel, Google Sheets, Power BI, and HTML templates.
✅ Instant download · One-time payment · No subscription · No per-user fees · Lifetime access · Works on Mac, Windows, iPad, and Android
🔑 Key Features of the Laundromat Business Dashboard in Google Sheets
🔹 4 executive KPI cards at the top of the Overview page tracking Total Revenue, Total Cycles, Avg Revenue per Cycle, and Completion Rate — the four numbers every laundromat owner needs to see first.
🔹 6 purpose-built sheet tabs: Overview, Machine Analysis, Revenue Analysis, Customer Analysis, Transaction Search, and Data — each engineered for a specific decision a coin-op, card-op, or attended laundromat owner makes weekly.
🔹 16 dynamic charts covering revenue by machine type, customer segment, payment method, location, shift, and cycle type — every chart recalculates the moment you change the underlying transaction data.
🔹 Multi-slicer filtering on the Overview page lets you drill down by machine type, customer segment, payment method, or month with one click — the entire dashboard reflows instantly.
🔹 Transaction Search tab — type any Transaction ID and the dashboard returns 13 fields (Date, Machine Type, Machine ID, Cycle Type, Payment Method, Customer Type, Revenue, Cycles Run, Location, Shift, Status, Month, Year) without scrolling through raw rows.
🔹 Cloud-native sharing — invite your accountant, store manager, or business partner with a single share link, with view-only or edit permissions. Concurrent multi-user editing is built into Google Sheets at no extra cost.
🔹 Mobile-friendly — open the dashboard from the Google Sheets app on iPhone, iPad, or Android to check yesterday’s revenue from anywhere.
🔹 Customizable — change colors, rename KPIs, add charts, or extend the data schema. The entire workbook is unlocked and editable.
📦 What’s Inside the Laundromat Business Dashboard in Google Sheets
The Laundromat Business Dashboard in Google Sheets is organized across 6 sheet tabs, each answering a different question about your laundromat business.
1. Overview Page
The Overview page is the executive cockpit of the dashboard. Four KPI cards sit at the top — Total Revenue, Total Cycles, Avg Revenue / Cycle, and Completion Rate — giving you the four numbers that define whether the month was profitable. Below the cards, four charts paint the full revenue picture: Revenue by Machine Type, Revenue by Customer Type, Revenue by Payment Method, and Monthly Revenue Trend. Multiple slicers at the top let you filter every chart and KPI on the page simultaneously.
 Laundromat Business Dashboard in Google Sheets
2. Machine Analysis
The Machine Analysis sheet is where you discover which equipment is actually paying the bills. Four charts unpack machine-level economics: Revenue by Machine ID identifies your top-earning units; Revenue by Location reveals which store the machines live in; Cycles by Machine Type shows which class of machine (top-loader, front-loader, dryer, commercial) gets the most use; and Revenue by Cycle Type highlights premium services like express, sanitize, or heavy-soil that drive higher per-cycle revenue.
 Machine Analysis
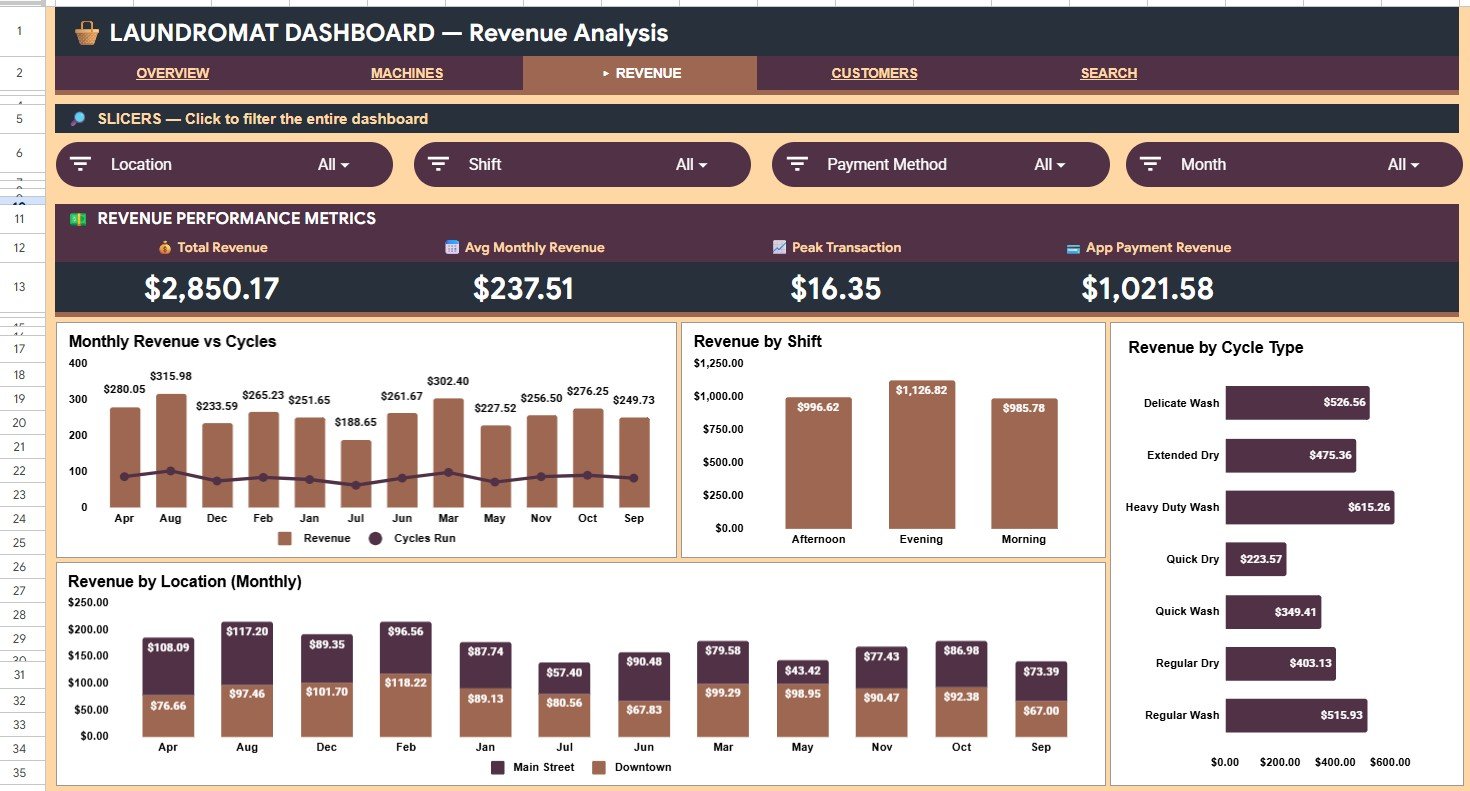
3. Revenue Analysis
The Revenue Analysis sheet ties revenue to time and location. Monthly Revenue vs Cycles places revenue and cycle volume on the same view so you can spot months where price-per-cycle is lifting (or dropping). Revenue by Shift exposes whether morning, afternoon, evening, or late-night shifts are driving the business. Revenue by Cycle Type repeats the cycle mix view at a financial level. Revenue by Location (Monthly) compares multi-store performance month over month.
 Revenue Analysis
4. Customer Analysis
The Customer Analysis sheet pulls back the curtain on who is actually paying. Revenue by Customer Type (Monthly) tracks revenue contribution from walk-ins, members, and commercial accounts over time. Payment Method Usage shows the cash-to-card-to-app split — critical for fee planning and digital payment adoption. Cycle Type by Customer Segment reveals which segment buys the premium services. Shift Usage by Customer Type tells you when each segment shows up so you can staff and promote intelligently.
 Customer Analysis
5. Transaction Search
The Transaction Search sheet is a one-cell lookup tool. Type any Transaction ID and the dashboard instantly returns 13 fields — Date, Machine Type, Machine ID, Cycle Type, Payment Method, Customer Type, Revenue, Cycles Run, Location, Shift, Status, Month, and Year. It saves you from scrolling thousands of rows to investigate a refund request, a customer dispute, or a suspected machine malfunction.
 Search Sheet tab
6. Data Sheet
The Data sheet is where every transaction lives. Each row captures a single laundromat transaction with all 13 fields exposed in the Transaction Search. Add new transactions in the same column format and the entire dashboard — every KPI, chart, slicer, and analysis sheet — recalculates automatically. This is the single source of truth that powers the rest of the workbook.
 Data Sheet tab
📊 Laundromat Business Dashboard in Google Sheets vs. Microsoft Excel Dashboard vs. Paid Laundromat POS/SaaS — Where This Fits
| Feature | Laundromat Business Dashboard in Google Sheets | Microsoft Excel Laundromat Dashboard | Paid Laundromat POS/SaaS (CleanCloud, Cents, LaundryCard) |
|---|---|---|---|
| Cost | $9.99 one-time ✅ | $17.99 one-time | $49–$199 / month / store |
| Platform | Any browser, iOS, Android ✅ | Microsoft Excel 2016+ desktop | Web + mobile app |
| Setup time | Under 5 minutes ✅ | Under 10 minutes | 1–3 weeks onboarding |
| Real-time multi-user editing | ✅ Built-in | ❌ Requires SharePoint or OneDrive | ✅ |
| Mobile access | ✅ Native iOS/Android app | Limited via Office mobile | ✅ |
| Software license required | None — free Google account ✅ | Microsoft 365 license | Paid subscription |
| Share with link | ✅ | Varies | Account-based |
| Customizable charts and fields | ✅ | ✅ | ❌ |
| Year-1 cost at 3 stores | $9.99 ✅ | $17.99 + Office license | $1,764–$7,164 |
For laundromat owners who want machine-level and customer-level analytics with built-in cloud sharing but without a monthly SaaS bill, the Laundromat Business Dashboard in Google Sheets sits in the sweet spot.
👥 Who This Template Is For — and Who It’s Not For
✅ This template is built for:
- Independent laundromat owners running 1–10 coin-op, card-op, or attended self-service locations
- Multi-store laundromat chain operators who need branch-level revenue and machine comparison
- Franchisees and investors evaluating laundromat acquisitions and same-store growth
- Bookkeepers and accountants supporting laundromat clients who already work in Google Workspace
- Small business analysts and consultants delivering branded reporting on a Google Sheets stack
❌ This template is NOT for:
- Enterprise laundry chains needing live coin-box telemetry and direct payment-terminal feeds
- Teams that require SOC 2 attestation, SSO, or fine-grained role-based access controls
- Anyone needing 100,000+ transaction rows — for that scale move to Power BI Dashboards
⚙️ How to Use the Laundromat Business Dashboard in Google Sheets
- Purchase the template and open the PDF guide in your download — it contains the Google Sheets copy link.
- Click the link and choose File > Make a copy to save an editable version in your own Google Drive.
- Open the Data sheet and replace the sample transactions with your own laundromat transaction records, keeping the column headers intact.
- Open the Overview page — every KPI card, chart, and slicer recalculates automatically from your data.
- Use the slicers at the top of the Overview to filter by machine type, customer segment, payment method, or month.
- Navigate to Transaction Search and type any Transaction ID to instantly retrieve all 13 fields for that record.
- Share the workbook with your store manager or accountant via the Google Sheets share button — set view-only or edit permissions per person.
💼 Real-World Use Cases
Rahul owns a 3-store laundromat chain in Atlanta. Every Monday he opens the Laundromat Business Dashboard in Google Sheets on his iPad over breakfast, compares Revenue by Location (Monthly) to spot the underperforming store, and checks Cycles by Machine Type to flag any machine that has gone idle — all before he reaches the first store. The cloud-share lets his on-site managers update transaction data through the week without emailing files back and forth.
Priya runs a single boutique laundromat with a high-end wash-and-fold service. She uses the Customer Analysis sheet to confirm that members generate 58% of her revenue and to spot that weekday afternoon shifts are her highest revenue-per-cycle window. That insight prompted a Tuesday afternoon “premium fold service” promotion that lifted average revenue per cycle by 14%.
David is a small-business broker evaluating three laundromats for sale. He drops each seller’s 12 months of transaction data into the Data sheet, then uses Machine Analysis and Revenue Analysis to compare cycle volume, machine-mix revenue, and shift performance across all three targets — what used to take his analyst a full week in raw spreadsheets now happens in a single afternoon. The Transaction Search tab lets him spot-check suspicious refunds during diligence.
❓ Frequently Asked Questions
What is the Laundromat Business Dashboard in Google Sheets?
The Laundromat Business Dashboard in Google Sheets is a cloud-based analytics template that tracks 4 KPIs and 16 charts across 6 sheet tabs — Overview, Machine Analysis, Revenue Analysis, Customer Analysis, Transaction Search, and Data. It runs entirely in Google Sheets with no software install and supports real-time multi-user editing.
Do I need a paid Google Workspace subscription to use this template?
No. The Laundromat Business Dashboard in Google Sheets works perfectly with a free personal Google account. There is no Workspace subscription, no Microsoft Office license, and no recurring fee. The template is a one-time $9.99 purchase with lifetime access.
How long does setup take for the Laundromat Business Dashboard in Google Sheets?
Setup typically takes under 5 minutes. Open the included PDF guide, click the Google Sheets link, select File > Make a copy, paste your own laundromat transaction records into the Data sheet, and every chart, KPI, and analytics view recalculates automatically.
How does the Laundromat Business Dashboard in Google Sheets compare to paid laundromat POS systems like CleanCloud or Cents?
Paid laundromat POS and SaaS platforms like CleanCloud and Cents typically charge $49–$199 per store per month. The Laundromat Business Dashboard in Google Sheets is a one-time $9.99 purchase. It does not replace your coin-box or card-reader, but it delivers the analytics layer — revenue, machine, shift, and customer analysis — for a tiny fraction of the annual subscription cost.
Can I use this dashboard for multiple laundromat locations?
Yes. Every transaction in the Data sheet is tagged with a Location field, so the Revenue Analysis and Machine Analysis sheets compare multi-store performance side by side. The dashboard scales comfortably from a single store up to roughly 10–15 locations.
Will the Laundromat Business Dashboard in Google Sheets work on my iPhone or iPad?
Yes. The dashboard opens directly in the free Google Sheets mobile app on iOS and Android. Owners can check yesterday’s revenue, today’s completion rate, or any specific Transaction ID right from their phone — no extra app, no extra subscription.
Can I share the Laundromat Business Dashboard with my accountant or store managers?
Yes. Google Sheets has built-in share-by-link functionality. You can invite your accountant, bookkeeper, or store managers with view-only or edit permissions, and they collaborate in real time on the same workbook — no version conflicts, no email attachments.
👤 About the Author
Built by PK — Microsoft Certified Professional with 15+ years of Excel, Google Sheets, and Power BI experience. Founder of NextGenTemplates, reaching 300K+ subscribers across YouTube channels (@PK-AnExcelExpert, @NextGenTemplates, @NeoTechNavigators). Every template is hand-built and tested before release.
🔗 Explore Related Templates
📌 Also available as:
- 🧺 Laundromat Dashboard in Excel — The pivot-powered Excel version for Office 365 desktop users.
- 🧺 Laundromat Dashboard in Power BI — A Power BI edition with DAX measures and interactive visuals.
- 🧺 Laundromat Dashboard in HTML — A browser-based version with no software dependency at all.
📌 Other service-business dashboards in Google Sheets:
- 🛠️ Auto Repair Dashboard in Google Sheets — Multi-location auto repair shop analytics in Google Sheets.
- 🧼 Dry Clean Service Management System — Full order-management workflow for dry-cleaning operators.
📌 Browse the full Google Sheets Dashboard Templates collection for more cloud-based analytics templates.
📖 Click here to read the Detailed Blog Post
Watch the step-by-step video tutorial:
🎥 Visit our YouTube channel for step-by-step video tutorials
👉 YouTube.com/@NextGenTemplates


Reviews
There are no reviews yet.