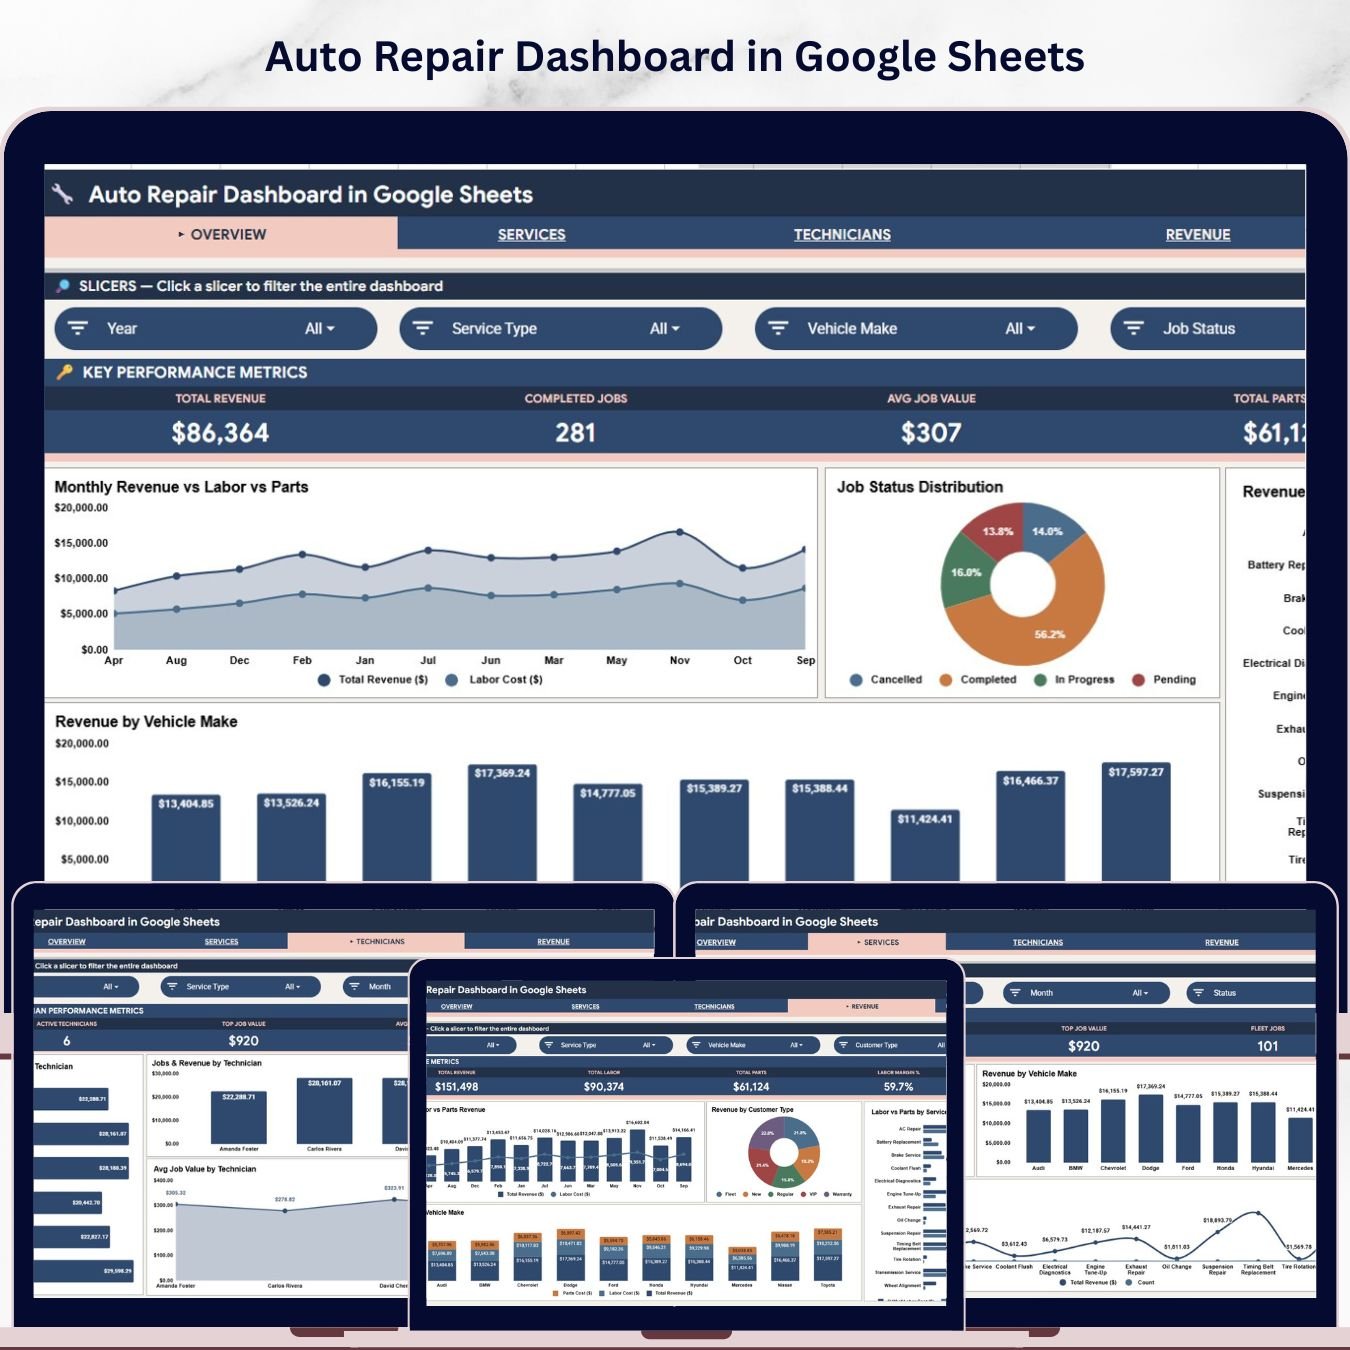


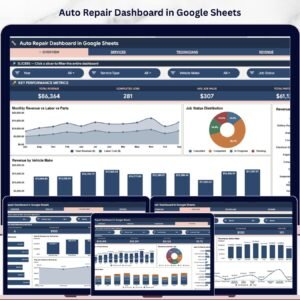
The Auto Repair Dashboard in Google Sheets tracks 4 headline KPIs across 4 interactive analysis pages, plus a Search Sheet and a Data Sheet, with 15 pre-built charts covering revenue, service types, technician performance, and vehicle-make analytics. Setup takes under 10 minutes — make a copy from the link in your download, paste your job records into the Data Sheet, and every card, chart, and slicer rebuilds automatically through Google Sheets’ native pivot engine.
🌍 Join 8,400+ teams in 40+ countries using NextGenTemplates to replace paid SaaS tools with one-time-purchase Excel, Google Sheets, Power BI, and HTML templates.
✅ Instant download · One-time payment · No subscription · No per-user fees · Lifetime access
🔑 Key Features of Auto Repair Dashboard in Google Sheets
🔹 4 KPI cards on the Overview page — Total Revenue, Completed Jobs, Avg Job Value, and Total Parts Cost give every shop owner an instant snapshot of performance. Slicers filter the entire dashboard by service type, vehicle make, customer type, and job status in one click.
🔹 15 interactive charts across 4 analysis pages — Services Analysis, Technicians Analysis, Revenue Analysis, and Overview cover every dimension: revenue trends, technician output, service mix, and vehicle-make profitability. This dashboard tracks more analytical dimensions than any standard auto repair spreadsheet you’d build from scratch.
🔹 Revenue by Vehicle Make — one of the most valuable views in the dashboard. Ranks revenue by car brand so shop owners can identify whether import sedans, domestic trucks, or luxury vehicles drive the most income — and whether to specialize or broaden service offerings.
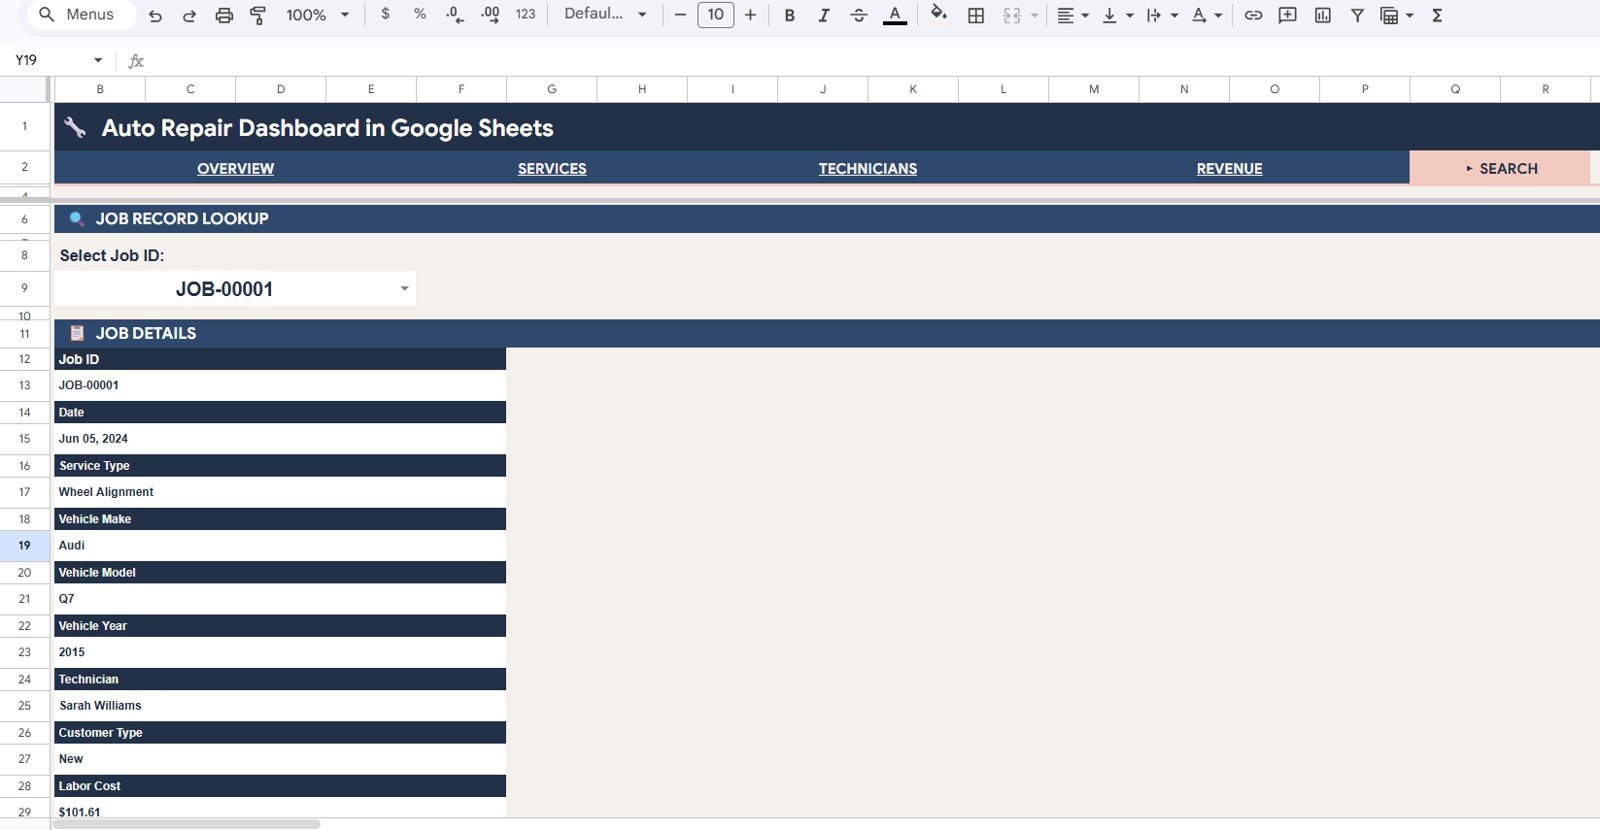
🔹 Job Record Lookup (Search Sheet) — select any Job ID from the dropdown and instantly see Date, Service Type, Vehicle Make, Vehicle Model, Vehicle Year, Technician, Customer Type, and Labor Cost. No more hunting through hundreds of rows.
🔹 100% Google Sheets native — built on pivot tables and chart logic. No add-ons, no Apps Script required for daily use. Works in any browser, and staff can access it from a phone or tablet on the shop floor.
🔹 Cloud collaboration by default — share with your service manager, front-desk staff, and accountant by link in seconds. View, comment, or edit access assigned in one click — no per-user SaaS fees.
This template is part of our growing library of Google Sheets Dashboard Templates for service businesses. Auto repair shops that also run HVAC or plumbing divisions can pair this with the HVAC Service Dashboard in Google Sheets for a complete multi-trade analytics setup.
📦 What’s Inside the Auto Repair Dashboard in Google Sheets
The file ships with 6 sheet tabs, each designed for a specific auto repair reporting workflow.
1. Overview Page — 4 KPI cards at the top: Total Revenue, Completed Jobs, Avg Job Value, and Total Parts Cost. Multiple slicers filter the entire page instantly. Four charts answer the top business questions: Total Revenue and Labor Cost by Month (compares monthly revenue against labor cost to reveal profitability trends), Job Distribution by Status (splits jobs across Completed, In Progress, Pending, and Cancelled to manage workload), Revenue by Service Type (shows which repair categories earn the most), and Revenue by Vehicle Make (ranks car brands by revenue contribution).
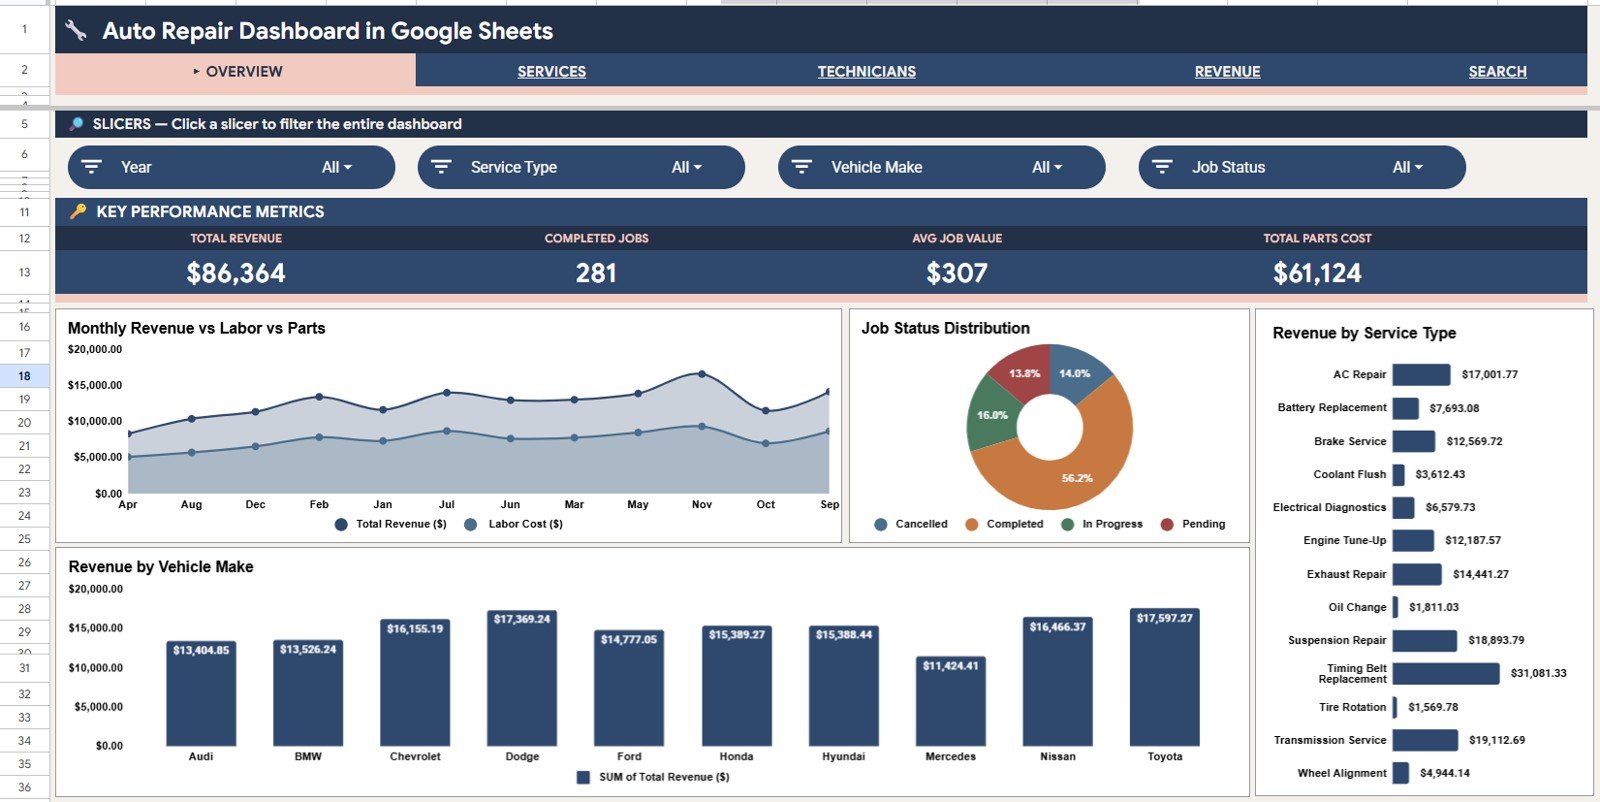
Auto Repair Dashboard in Google Sheets
2. Services Analysis — drills into the service mix with four visuals: Revenue by Service Type, Revenue by Customer Type, Revenue by Vehicle Make, and Revenue and Job Count by Service Type. Use this page to see whether oil changes, brake jobs, engine overhauls, or diagnostics drive the most revenue — and whether retail walk-ins or fleet accounts are more profitable.
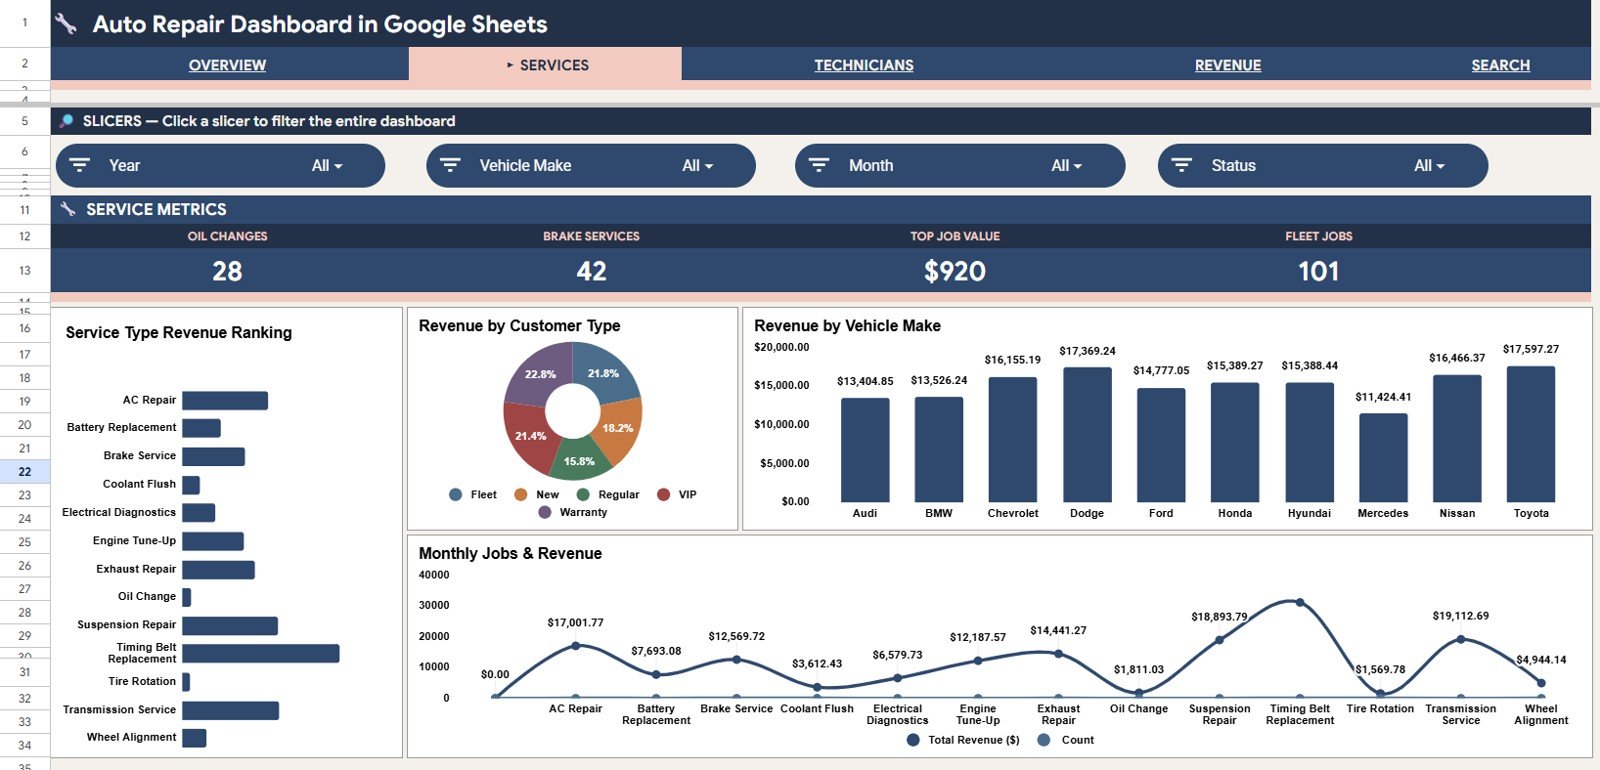
Services Analysis
3. Technicians Analysis — three focused visuals: Revenue by Technician, Jobs and Revenue by Technician, and Average Job Value by Technician. Shop owners use this page for performance reviews, bonus calculations, and to identify which technicians handle the highest-value work.
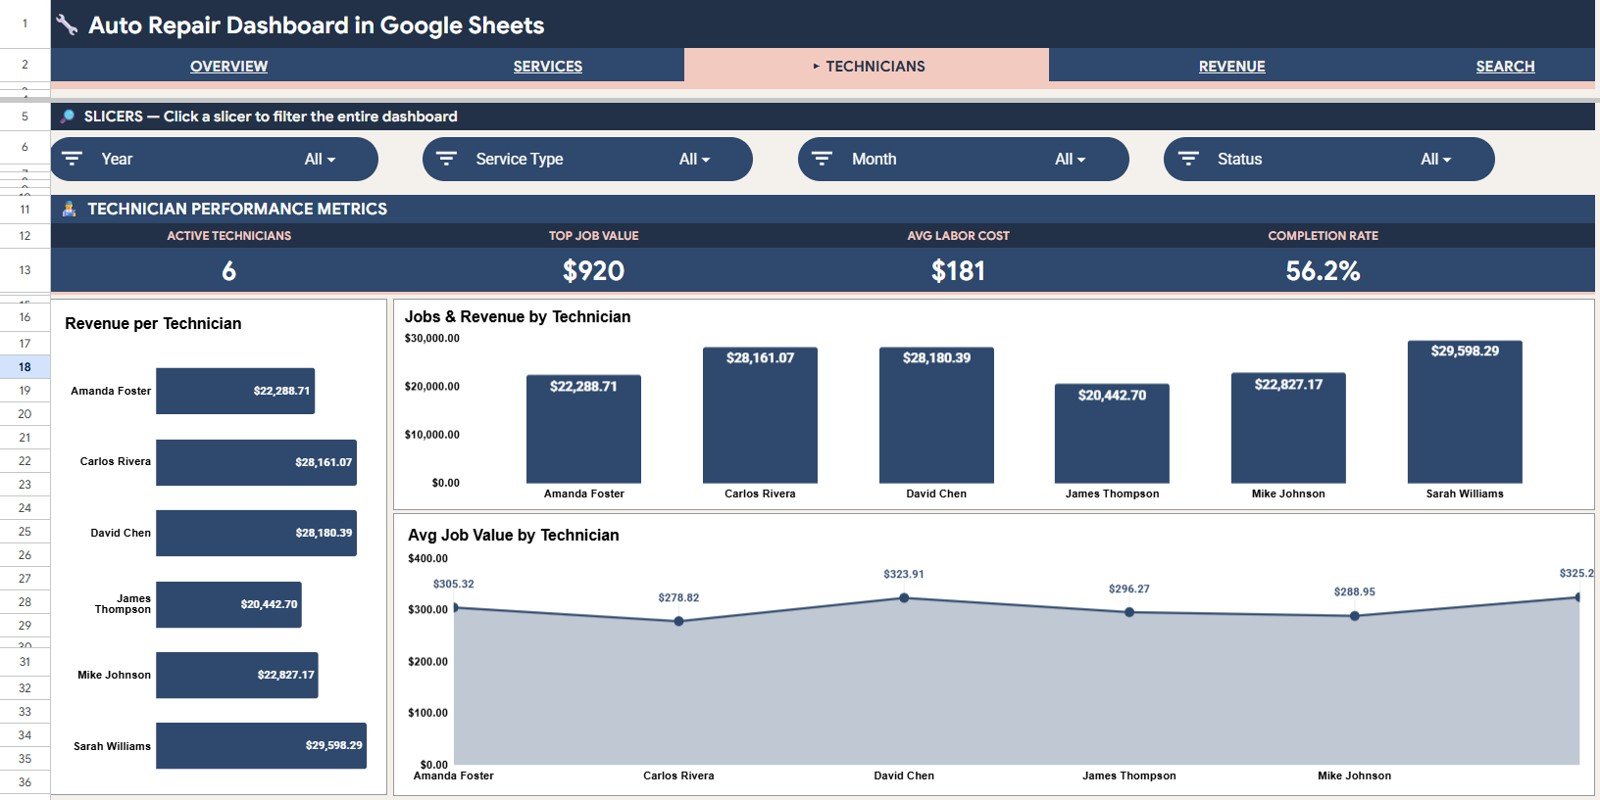
Technicians Analysis
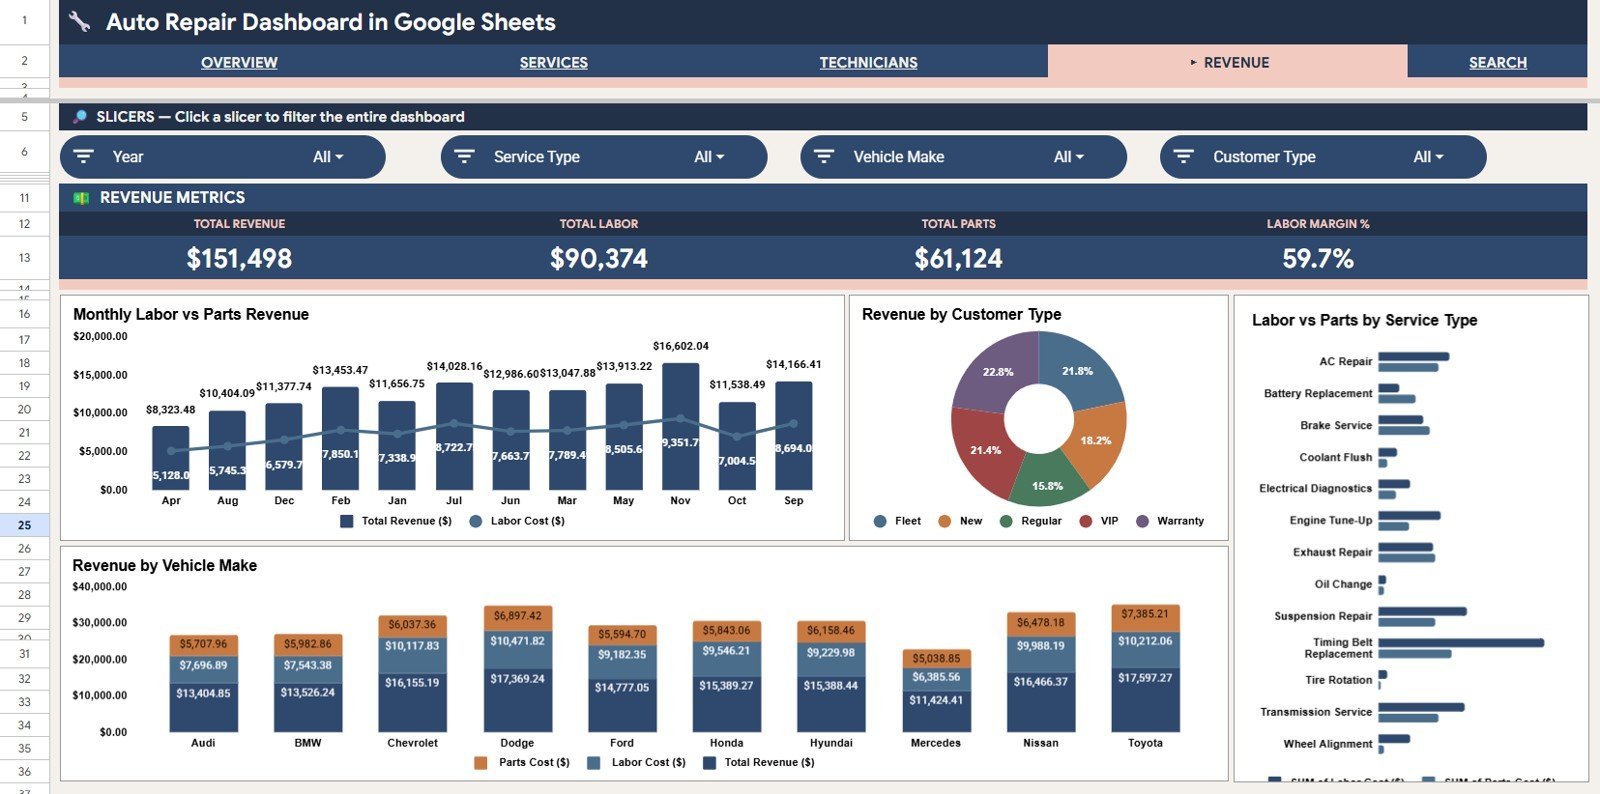
4. Revenue Analysis — four charts covering the financial picture in depth: Total Revenue and Labor Cost by Month, Revenue by Customer Type, Labor and Parts Cost by Service Type, and Revenue by Vehicle Make. This page gives owners the cost structure they need for pricing decisions and parts procurement planning.

Revenue Analysis
5. Search Sheet — a Job Record Lookup tool. Select any Job ID from the dropdown and the full record displays instantly: Date, Service Type, Vehicle Make, Vehicle Model, Vehicle Year, Technician, Customer Type, and Labor Cost. Built for front-desk staff handling customer inquiries and warranty lookups in seconds.

Search Sheet tab
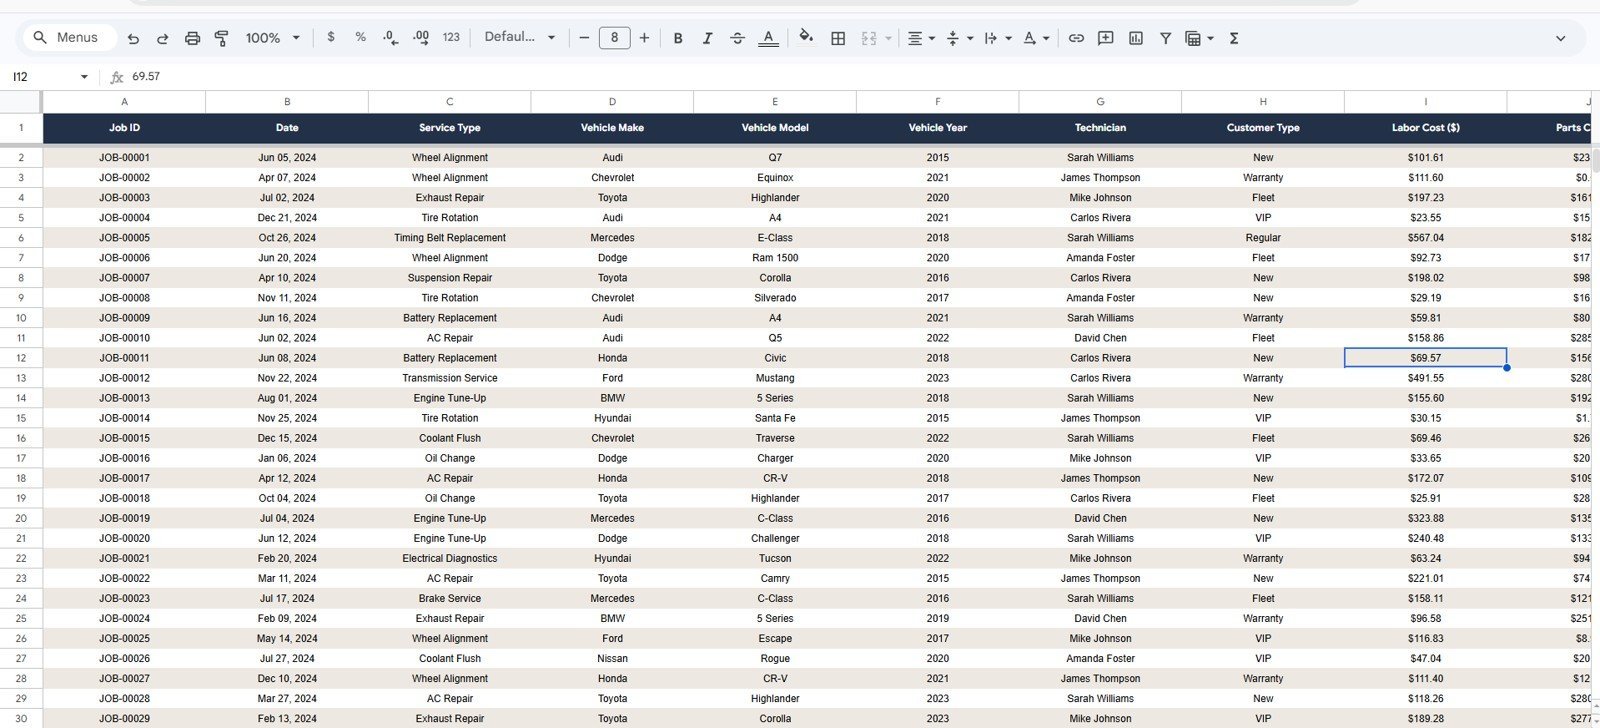
6. Data Sheet — the single input layer for the entire dashboard. Add your repair job records in the same column format as the sample data, and every chart, KPI card, and analysis page updates automatically. No formulas to edit, no charts to rebuild.
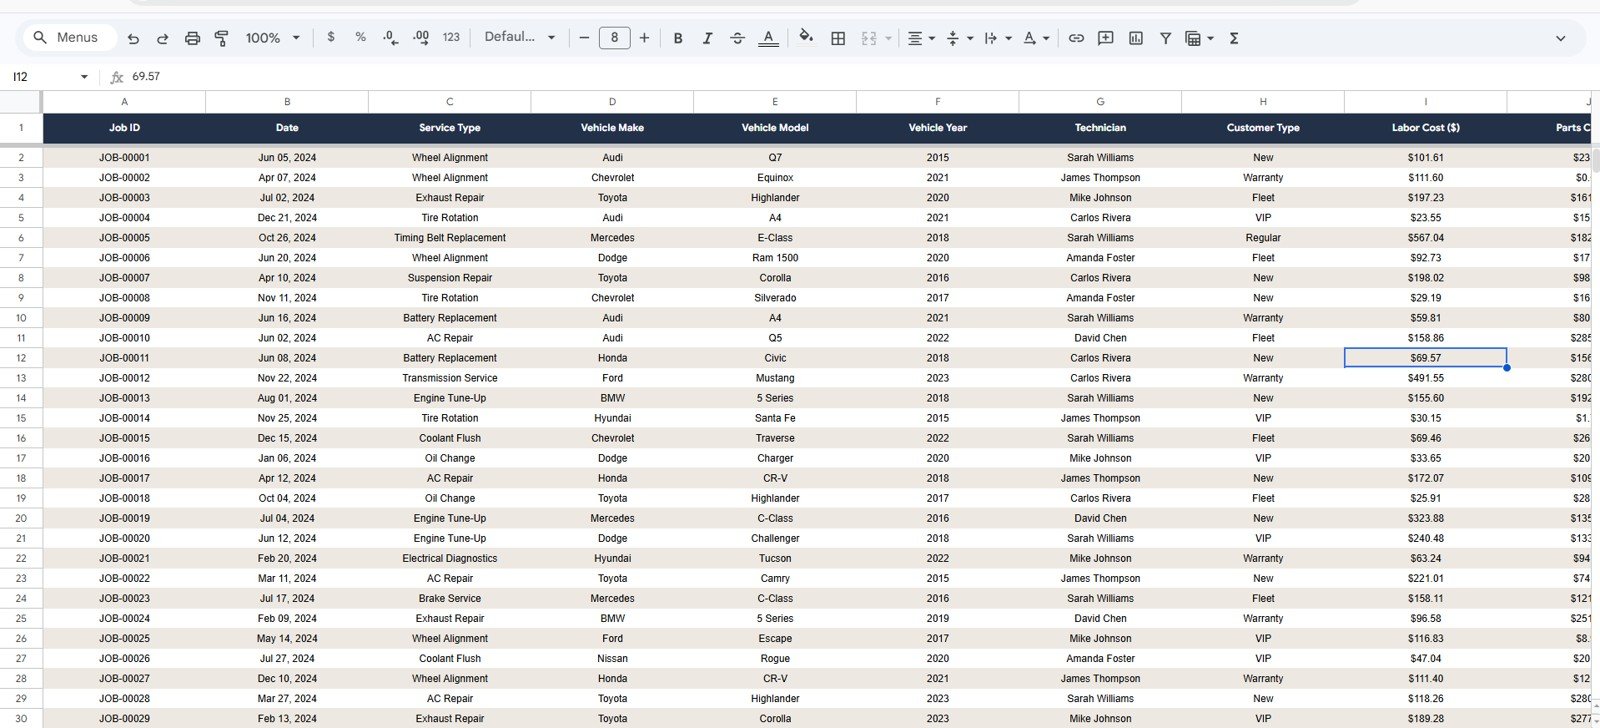
Data Sheet tab
📊 Auto Repair Dashboard in Google Sheets vs. Microsoft Excel Dashboard vs. Shop-Boss / Mitchell1 — Where This Fits
| Feature | Auto Repair Dashboard in Google Sheets | Microsoft Excel Dashboard | Shop-Boss / Mitchell1 |
|---|---|---|---|
| Cost | $9.99 one-time | $17.99 one-time | $99–$299 / month |
| Platform | Google Sheets (browser, free) | Microsoft Excel | Cloud SaaS + desktop |
| Setup time | Under 10 minutes | Under 15 minutes | 2–6 weeks onboarding |
| Real-time team collaboration | ✅ Native — share a link | Requires SharePoint or 365 | ✅ Built-in (paid seats) |
| Mobile access | ✅ Google Sheets app | Limited mobile editing | ✅ Native app |
| Customizable fields and charts | ✅ Fully editable | ✅ Editable | ❌ Vendor-locked reports |
| Share with link | ✅ One click | Requires file send | User seat required |
| Year-1 cost at 5 users | $9.99 total | $17.99 total | $1,188–$3,588 |
| Job record lookup | ✅ Built-in Search Sheet | Manual PivotTable filter | ✅ Built-in |
For independent auto repair shops and multi-bay service centers that want browser-based analytics without paying $99–$299/month for a shop management SaaS, the Auto Repair Dashboard in Google Sheets sits in the sweet spot.
👥 Who This Template Is For — and Who It’s Not For
✅ This template is built for:
- Independent auto repair shop owners with 1–10 bays who need weekly revenue and technician reporting
- Multi-location auto service chains tracking revenue across shops by vehicle make, service type, and technician
- Fleet maintenance managers monitoring labor and parts costs across multiple vehicle categories
- Automotive service consultants who need a portable, shareable dashboard for client reporting
- Front-desk managers who want quick job lookup without digging through spreadsheet rows
❌ This template is NOT for:
- Large dealership groups needing live DMS integration, online booking, and customer portals — use Shop-Boss or Mitchell1 instead
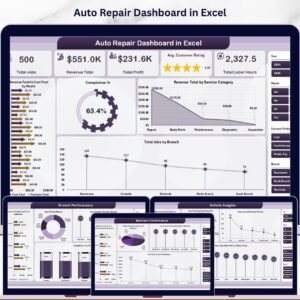
- Teams that prefer Microsoft Excel — see the Auto Repair Dashboard in Excel
- Power BI users who need DAX-based modeling — see the Auto Repair Dashboard in Power BI
⚙️ How to Use the Auto Repair Dashboard in Google Sheets
- Download the PDF guide from your purchase email and click the Google Sheets copy link inside.
- Make a copy to your own Google Drive — the entire dashboard, slicers, and pivot logic copy with it.
- Open the Data Sheet and replace the sample job records with your own, keeping the exact column order.
- Refresh the slicers on each analysis page — every KPI card, chart, and pivot rebuilds automatically.
- Use the Search Sheet to look up any job by Job ID without scrolling through the full dataset.
- Share with your team — click Share in the top-right and grant view, comment, or edit access by link.
💼 Real-World Use Cases
Rajiv owns a 4-bay auto repair shop in Pune. He uses the Auto Repair Dashboard in Google Sheets every Monday morning to check Total Revenue vs. Total Parts Cost on the Overview page, then opens Technicians Analysis to see whether his senior mechanic’s Avg Job Value is still 40% higher than junior staff — the data point that drives his monthly bonus decisions. His service advisor accesses the same Google Sheet by link to handle customer warranty queries on the Search Sheet.
Lisa manages a 3-location auto service chain in Texas. She uses the Revenue Analysis page to compare Labor and Parts Cost by Service Type across all locations each month, spotting which service categories have cost margins under 30%. The Revenue by Vehicle Make chart shows her that European sedans generate 35% higher avg job values than domestic trucks — a finding that redirected her marketing budget toward import owners in Q2.
Marcus is an automotive business consultant. He customizes the Auto Repair Dashboard in Google Sheets for each new shop client, shares the link by email, and trains the owner in 30 minutes. Because everything runs in the browser, clients review dashboards on a phone between jobs — replacing what used to be a 2-week Excel build that broke whenever the data format changed.
❓ Frequently Asked Questions
What KPIs does the Auto Repair Dashboard in Google Sheets track?
The Auto Repair Dashboard in Google Sheets tracks 4 headline KPIs on the Overview page: Total Revenue, Completed Jobs, Avg Job Value, and Total Parts Cost. Across 4 analysis pages it delivers 15 charts covering revenue by service type, technician performance, vehicle make, customer type, and monthly labor vs. parts cost trends.
How does this compare to Shop-Boss or Mitchell1?
Shop-Boss and Mitchell1 are full shop management platforms charging $99–$299 per month with multi-week onboarding. The Auto Repair Dashboard in Google Sheets is a $9.99 one-time purchase delivering the analytics layer — revenue tracking, technician performance, job lookup — without recurring fees or per-seat pricing.
How long does setup take?
Setup takes under 10 minutes. Make a copy to your Google Drive, open the Data Sheet, paste your repair job records in the same column order as the sample data, and every KPI card, chart, and slicer across all 4 analysis pages updates automatically.
Do I need a paid Google Workspace account to use this template?
No. The Auto Repair Dashboard in Google Sheets works on any free personal Google account. A paid Google Workspace plan is optional — useful for admin controls and shared team drives, but not required for daily shop operations.
Can I add my own service types, vehicle makes, or technicians?
Yes. Add any new service types, vehicle makes, customer types, or technicians directly to the Data Sheet. The pivot tables and charts across all 4 analysis pages pick up the new values automatically — no formula edits required.
Does the dashboard work on mobile?
Yes. The Auto Repair Dashboard in Google Sheets opens in the Google Sheets mobile app on iOS and Android. Front-desk staff can look up job records from the Search Sheet on a phone, and shop owners can review the Revenue Analysis page from anywhere.
Can I share this with my whole team without paying per user?
Yes. Click Share in Google Sheets, paste email addresses for your mechanics, service managers, or accountants, and grant the appropriate access level. There are no per-user fees from NextGenTemplates — your $9.99 covers unlimited internal users.
👤 About the Author
Built by PK — Microsoft Certified Professional with 15+ years of Excel, Google Sheets, and Power BI experience. Founder of NextGenTemplates, reaching 300K+ subscribers across YouTube channels (@PK-AnExcelExpert, @NextGenTemplates, @NeoTechNavigators). Every template is hand-built and tested before release.
🔗 Explore Related Templates
🔹 Auto Repair Dashboard in Excel — Same KPI logic in Microsoft Excel with pivot-driven charts for teams on the Microsoft stack.
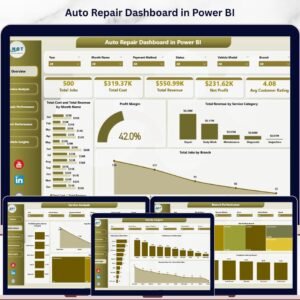
🔹 Auto Repair Dashboard in Power BI — Interactive .pbix file for BI teams running Power BI Desktop.
🔹 HVAC Service Dashboard in Google Sheets — Sister field-service dashboard for HVAC operators tracking service calls and equipment performance.
🔹 Browse the full Google Sheets Dashboard collection for more service industry templates.
📖 Click here to read the Detailed Blog Post
Watch the step-by-step video tutorial:
🎥 Visit our YouTube channel for step-by-step video tutorials
👉 YouTube.com/@NextGenTemplates
📅 Last updated: May 2026


Reviews
There are no reviews yet.