

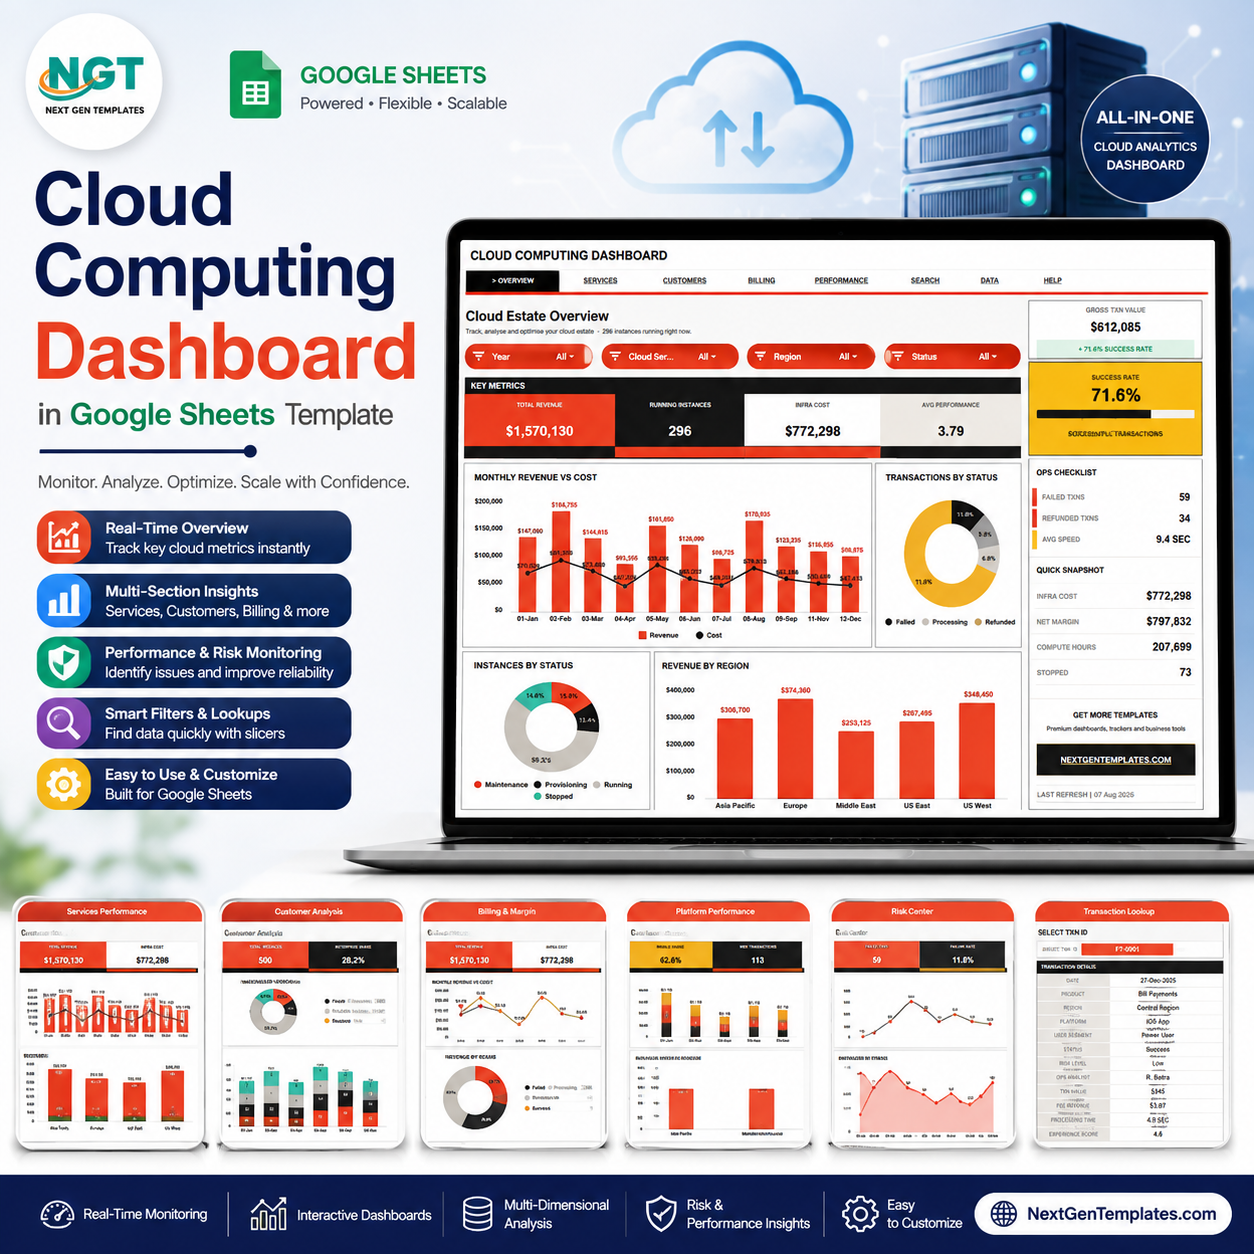
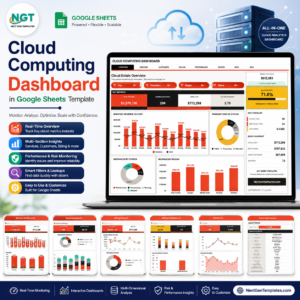
Cloud Computing Dashboard in Google Sheets gives IT, finance, and cloud operations teams 7 connected sheet tabs, 4 executive KPI cards, 20 chart views, native slicers, an Instance ID lookup sheet, and an editable data sheet for a $9.99 sale price. Built by PK, founder of NextGenTemplates with 300K+ subscribers across YouTube channels, this template is designed as a one-time dashboard purchase with no per-user reporting subscription. Your team can review revenue, running instances, infrastructure cost, and performance before publishing any internal report.
Key Features of Cloud Computing Dashboard in Google Sheets
- 7 Google Sheets tabs: Overview, Service Performance, Customer Analysis, Billing & Margin, Platform Performance, Search, and Data.
- 4 headline cards: Total Revenue, Running Instances, Infra Cost, and Avg Performance.
- 20 chart views: Review revenue, cost, instance status, cloud services, regions, plans, engineers, environments, and performance trends.
- Native slicers: Filter the dashboard quickly without rebuilding formulas or charts.
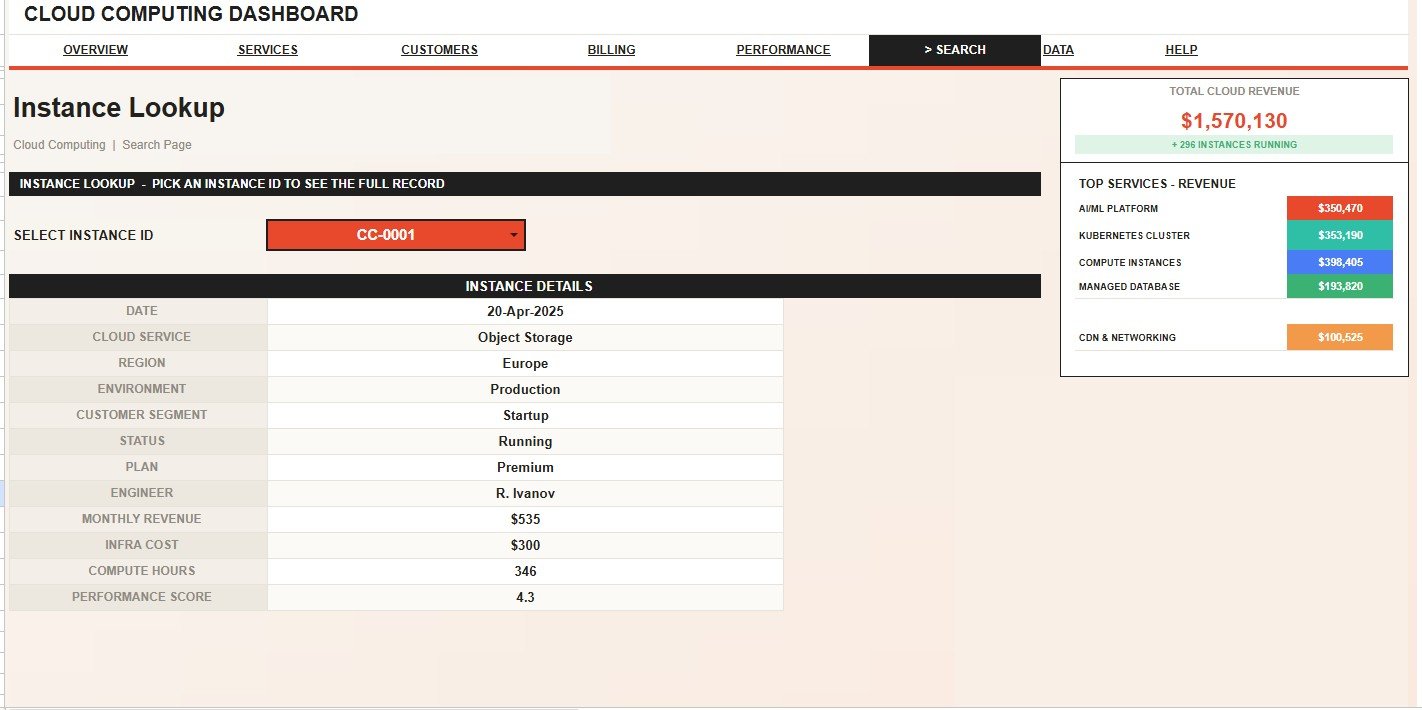
- Instance lookup: Select an Instance ID and see the full cloud record in one sheet.
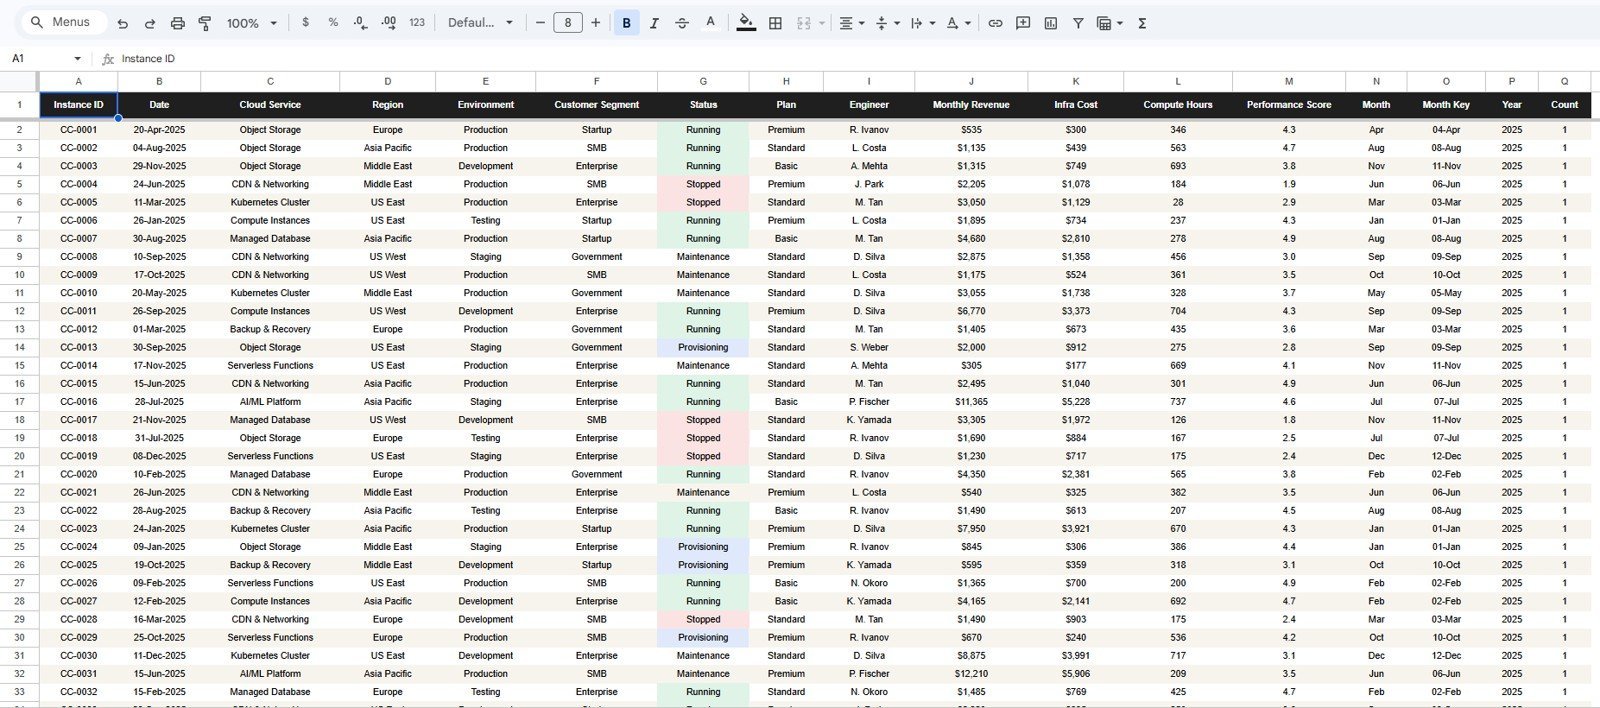
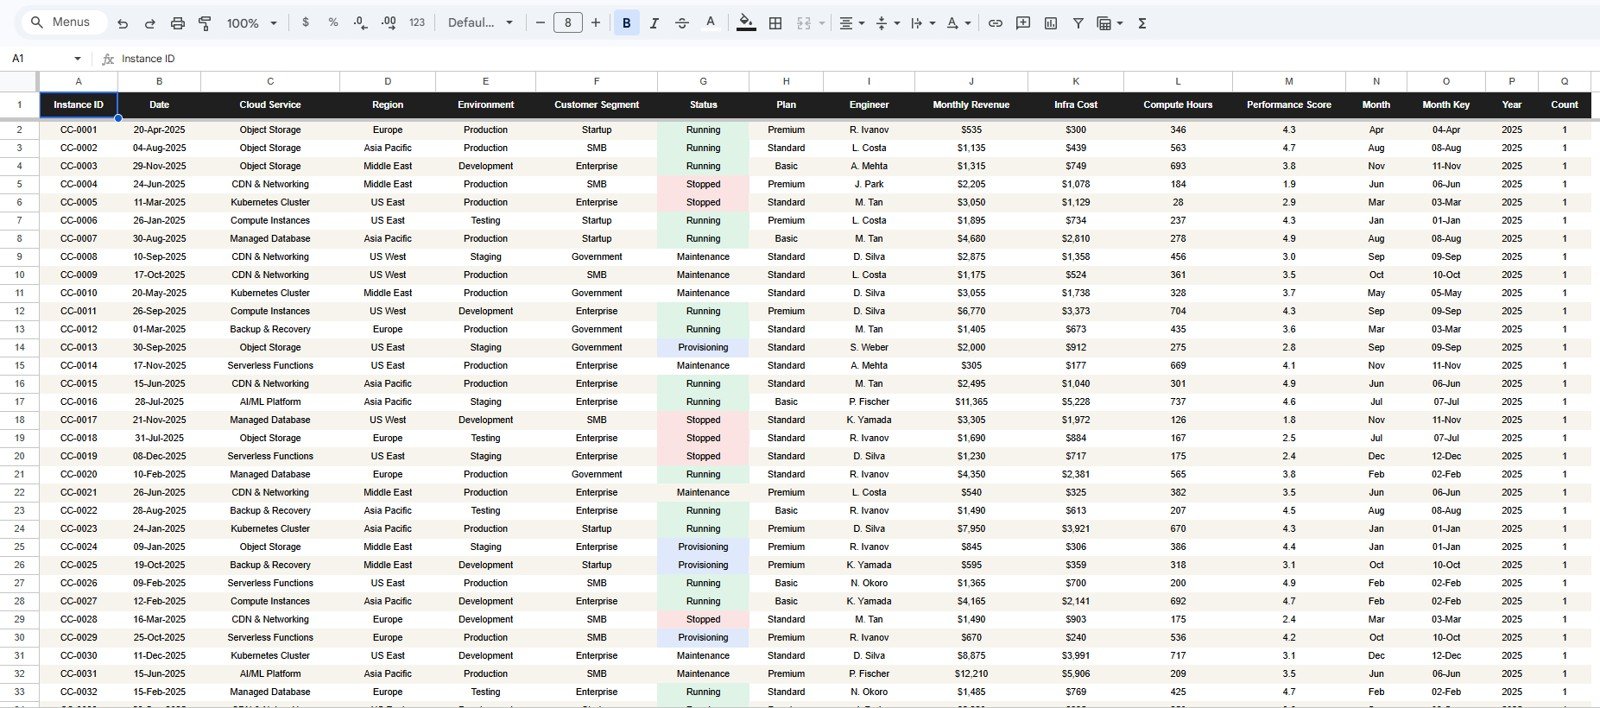
- Editable source data: Replace the sample records in the same format and keep the dashboard structure intact.
What’s Inside the Cloud Computing Dashboard in Google Sheets
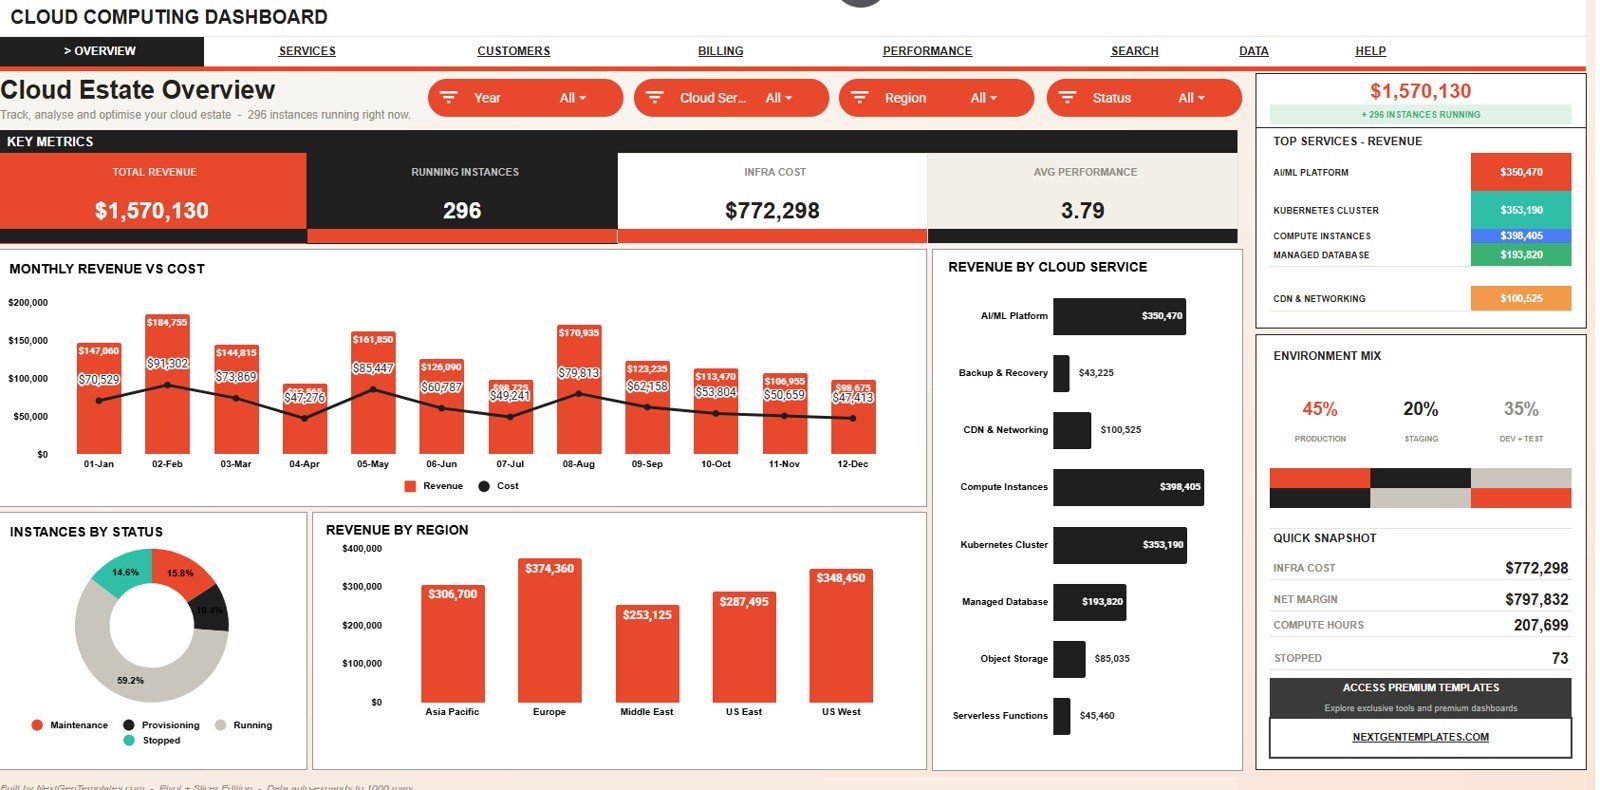
The Overview Page shows Total Revenue, Running Instances, Infra Cost, and Avg Performance, plus charts for Revenue by Month, Infra Cost by Month, Instances by Status, Revenue by Region, and Revenue by Cloud Service.
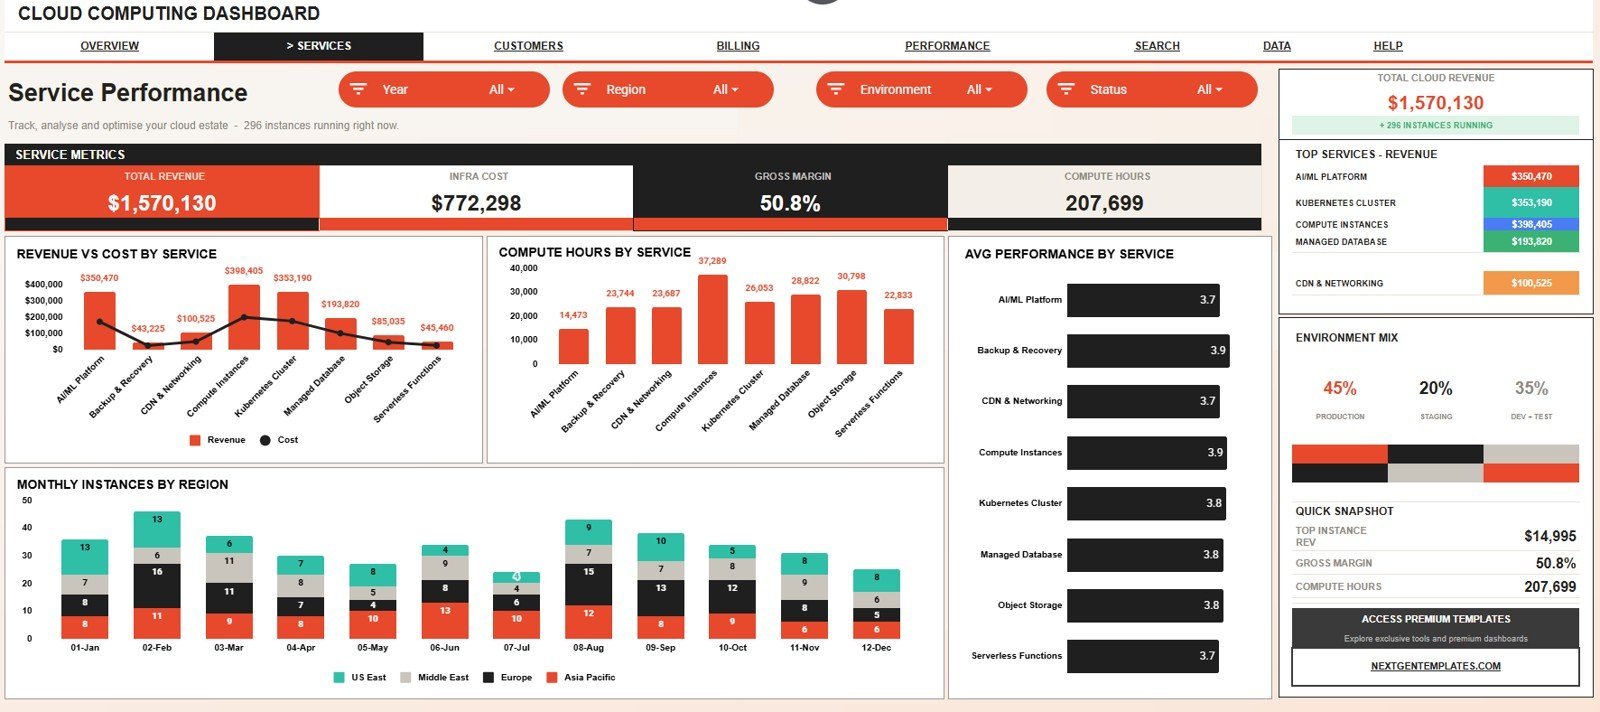
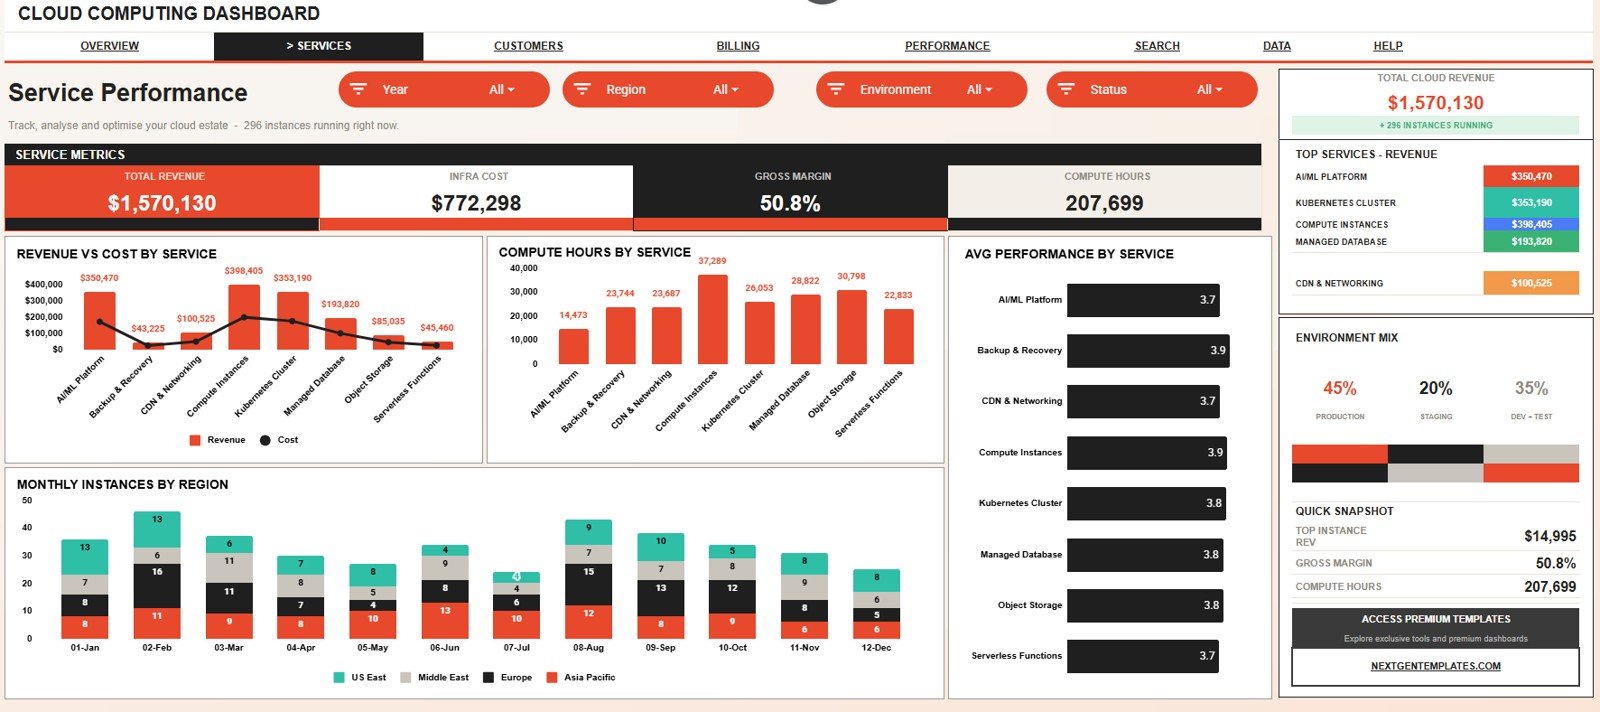
The Service Performance tab compares cloud services by revenue, infrastructure cost, compute hours, average performance, and monthly regional instance activity.
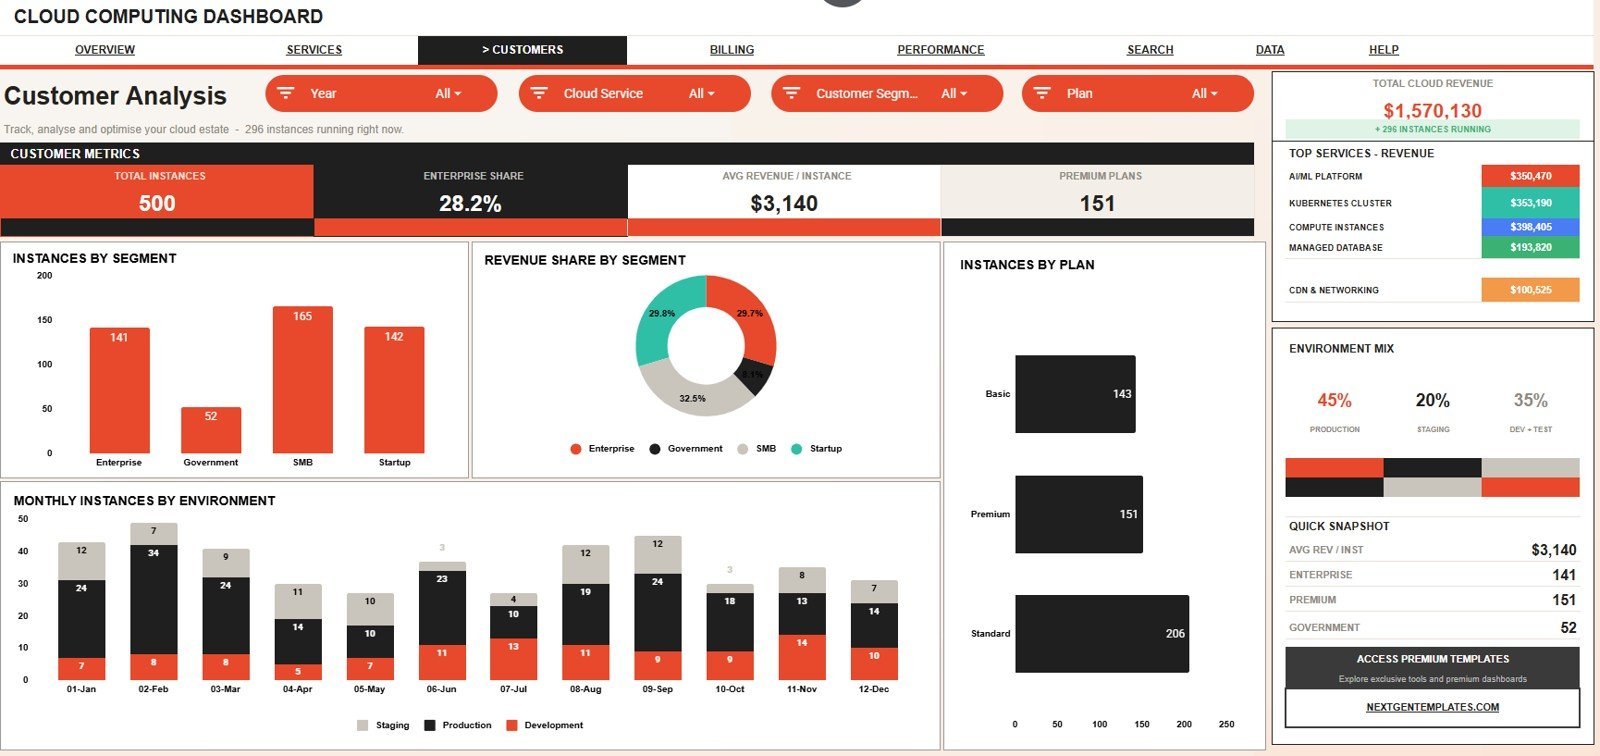
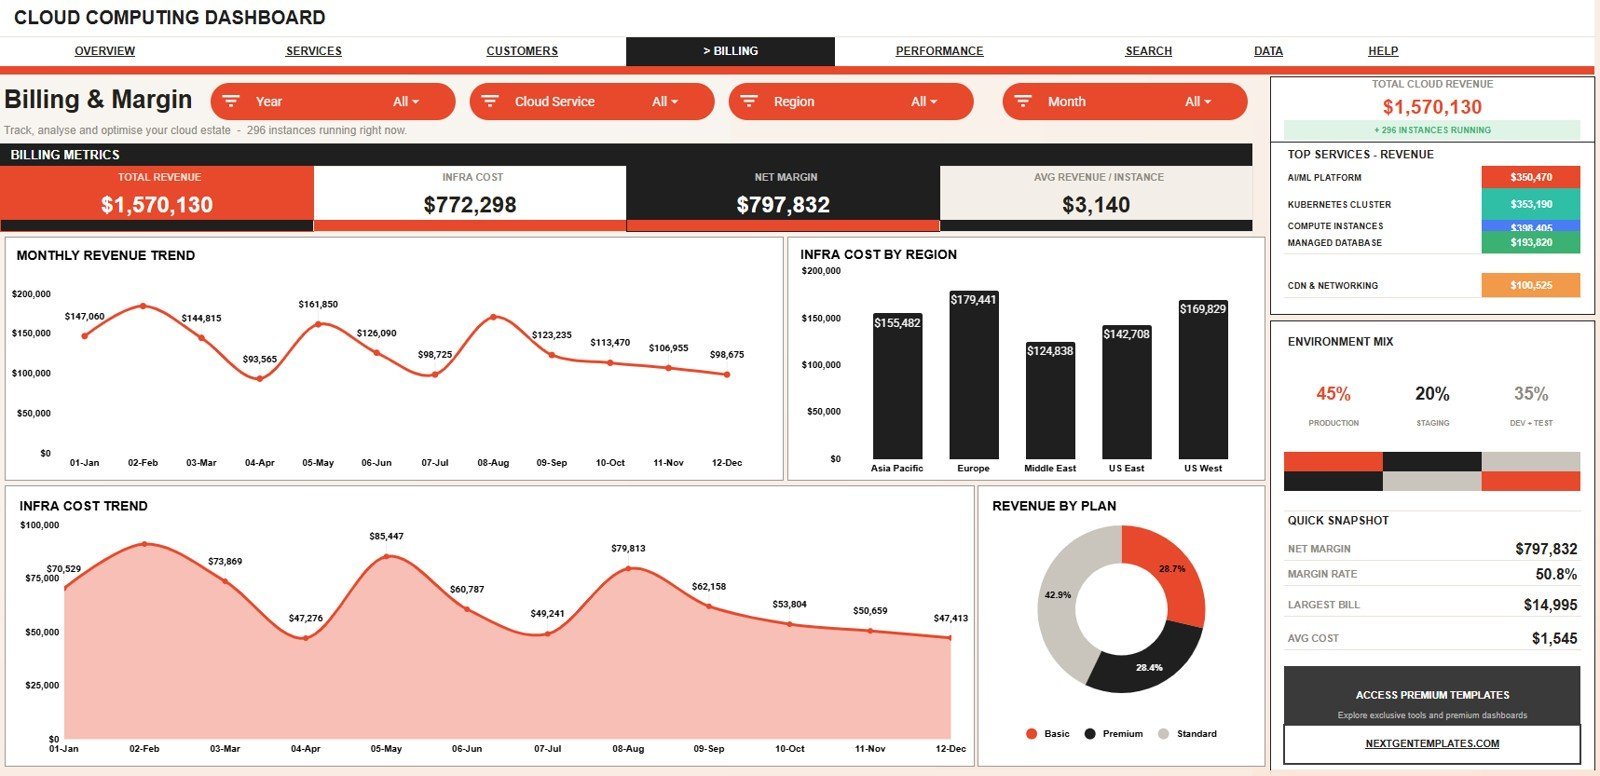
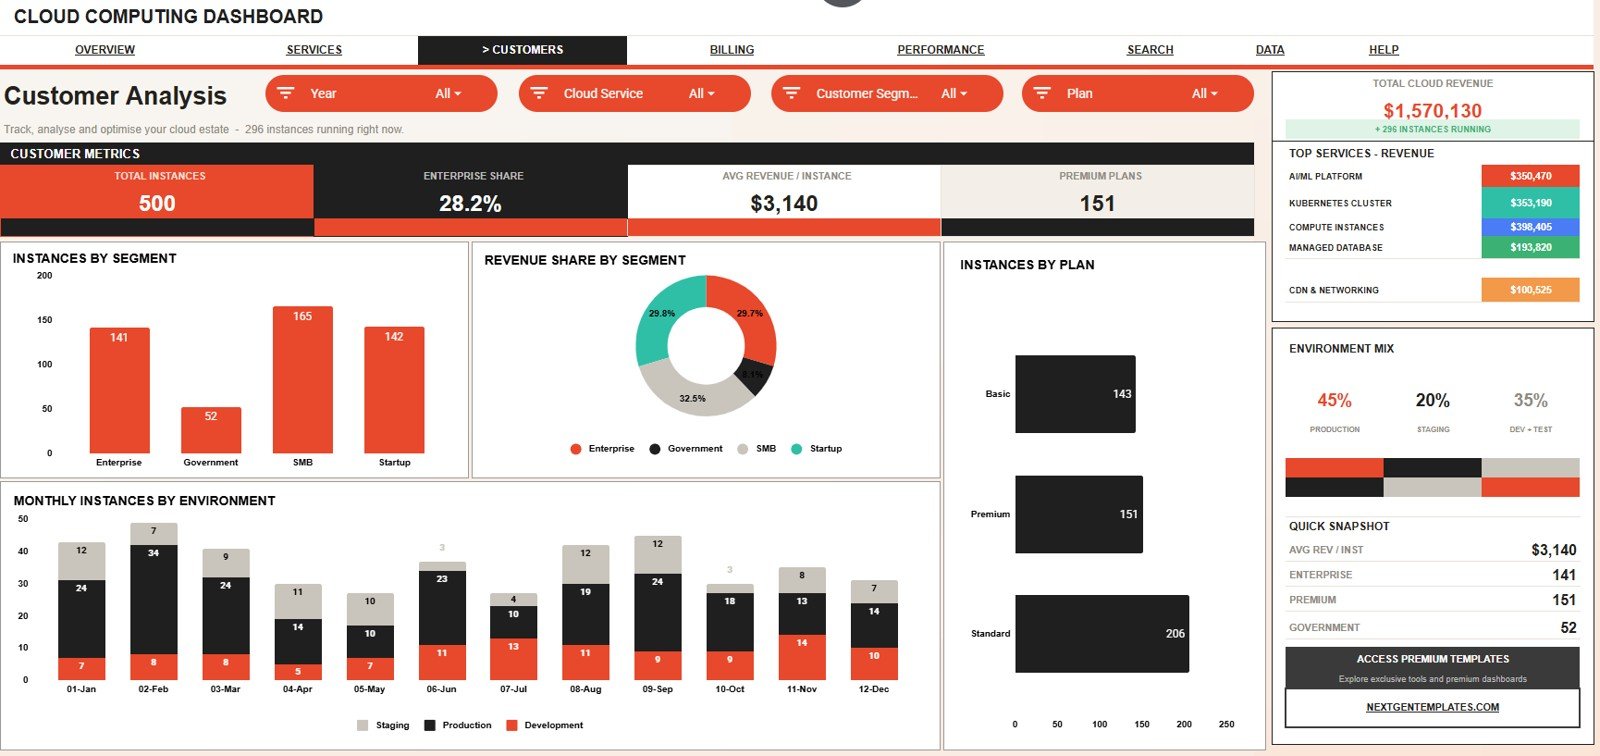
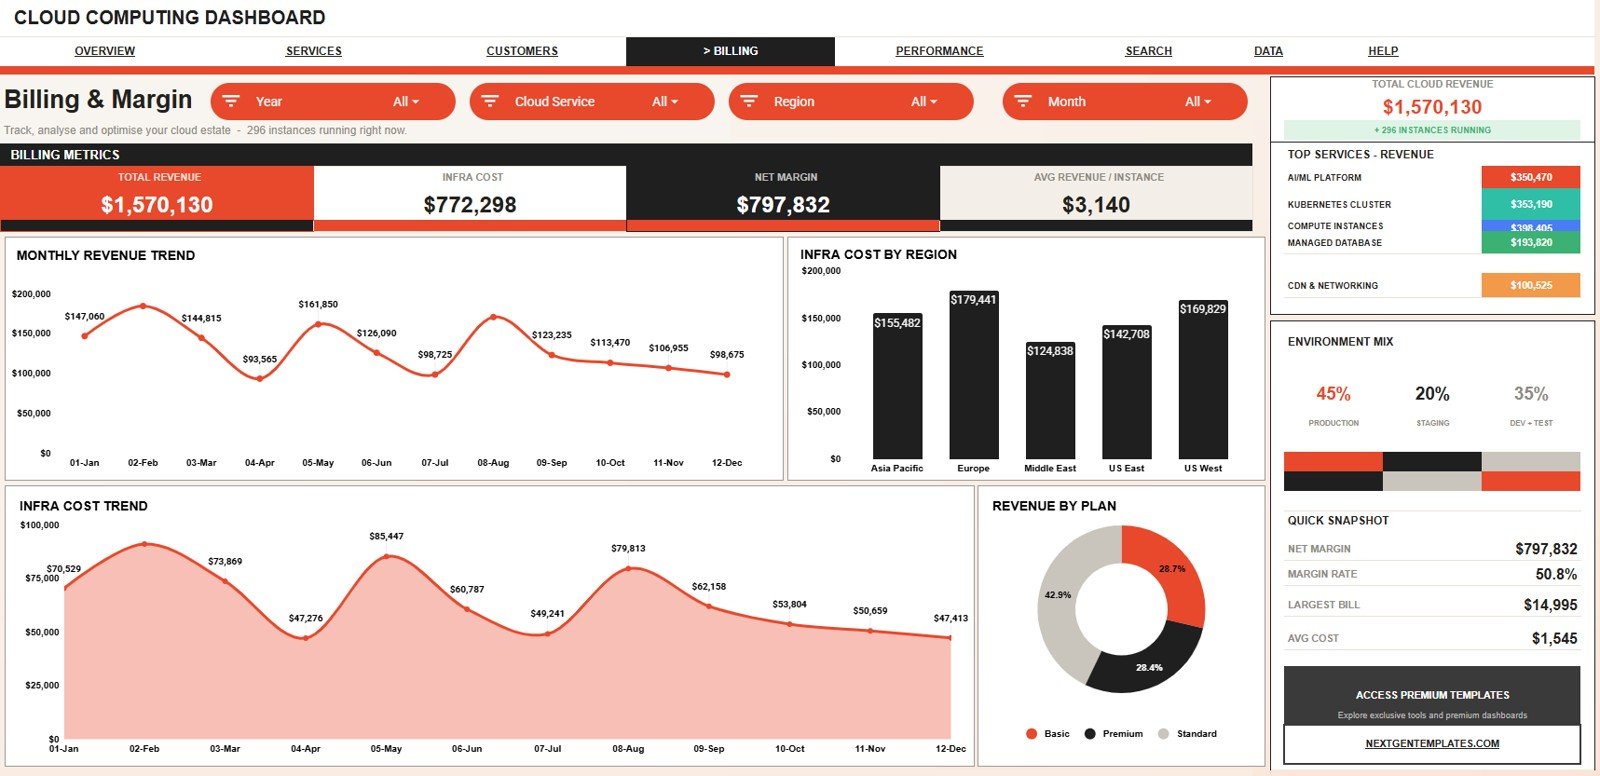
The Customer Analysis tab covers customer segments, revenue share, plan mix, and monthly instances by environment. Billing & Margin focuses on revenue, infrastructure cost by region and month, and revenue by plan.
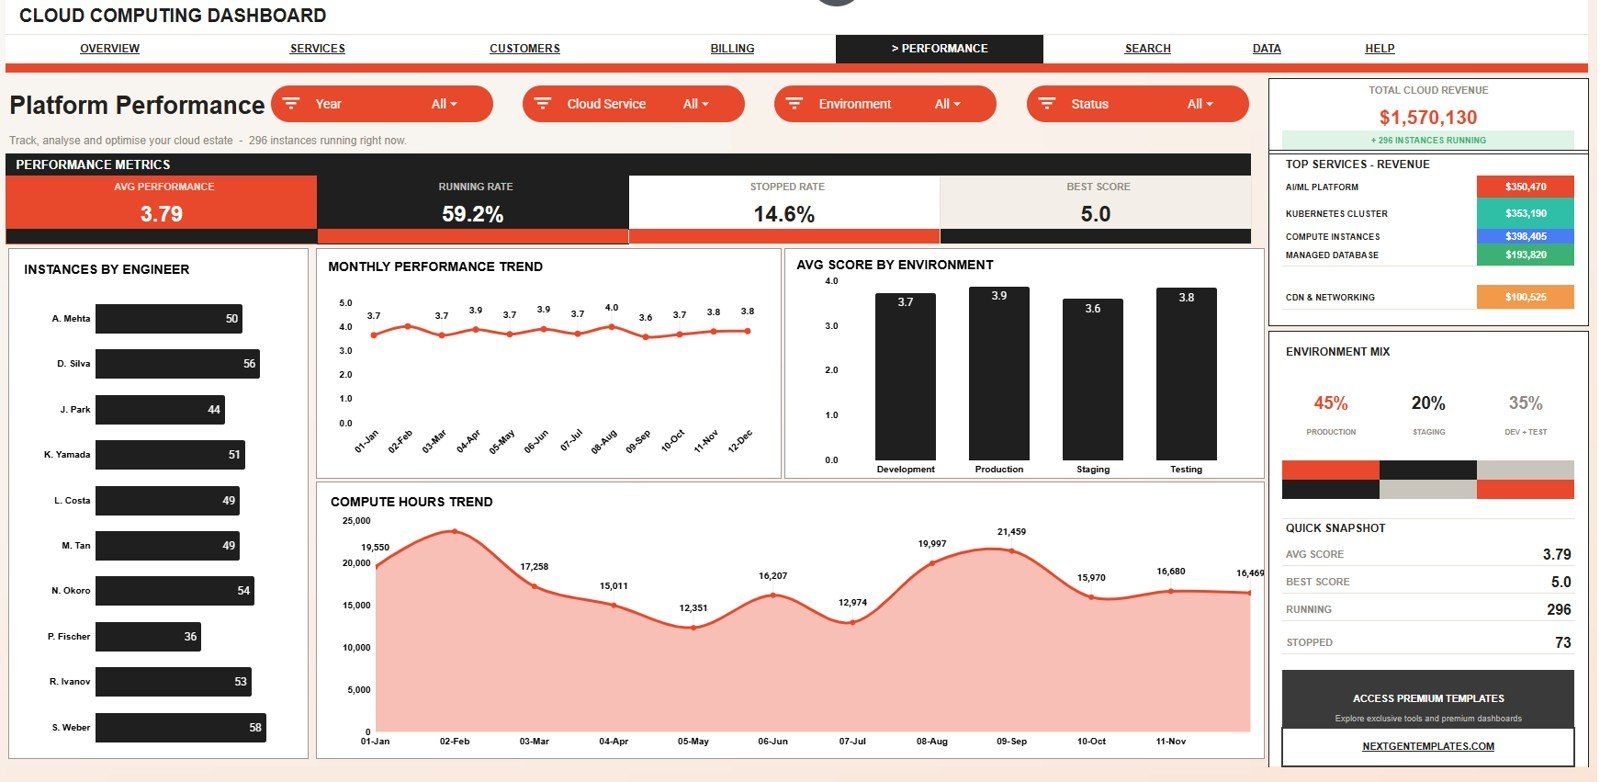
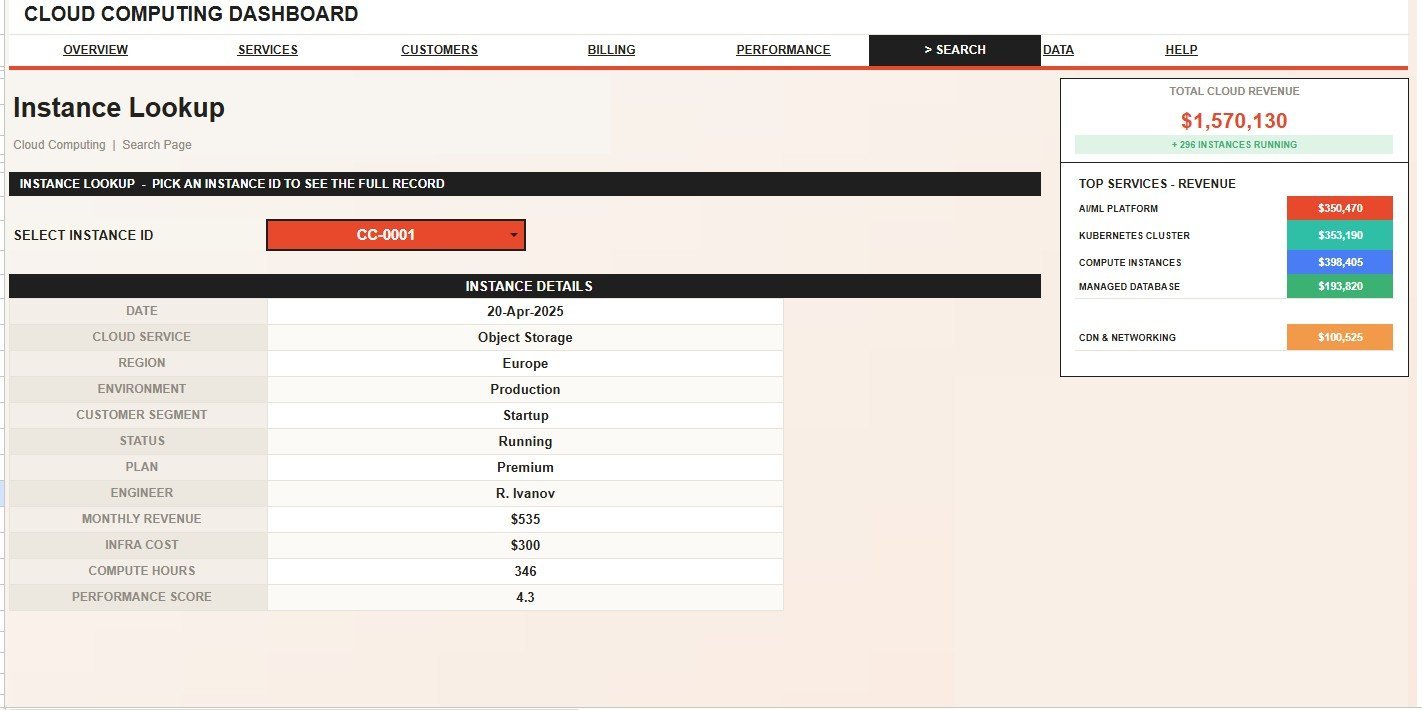
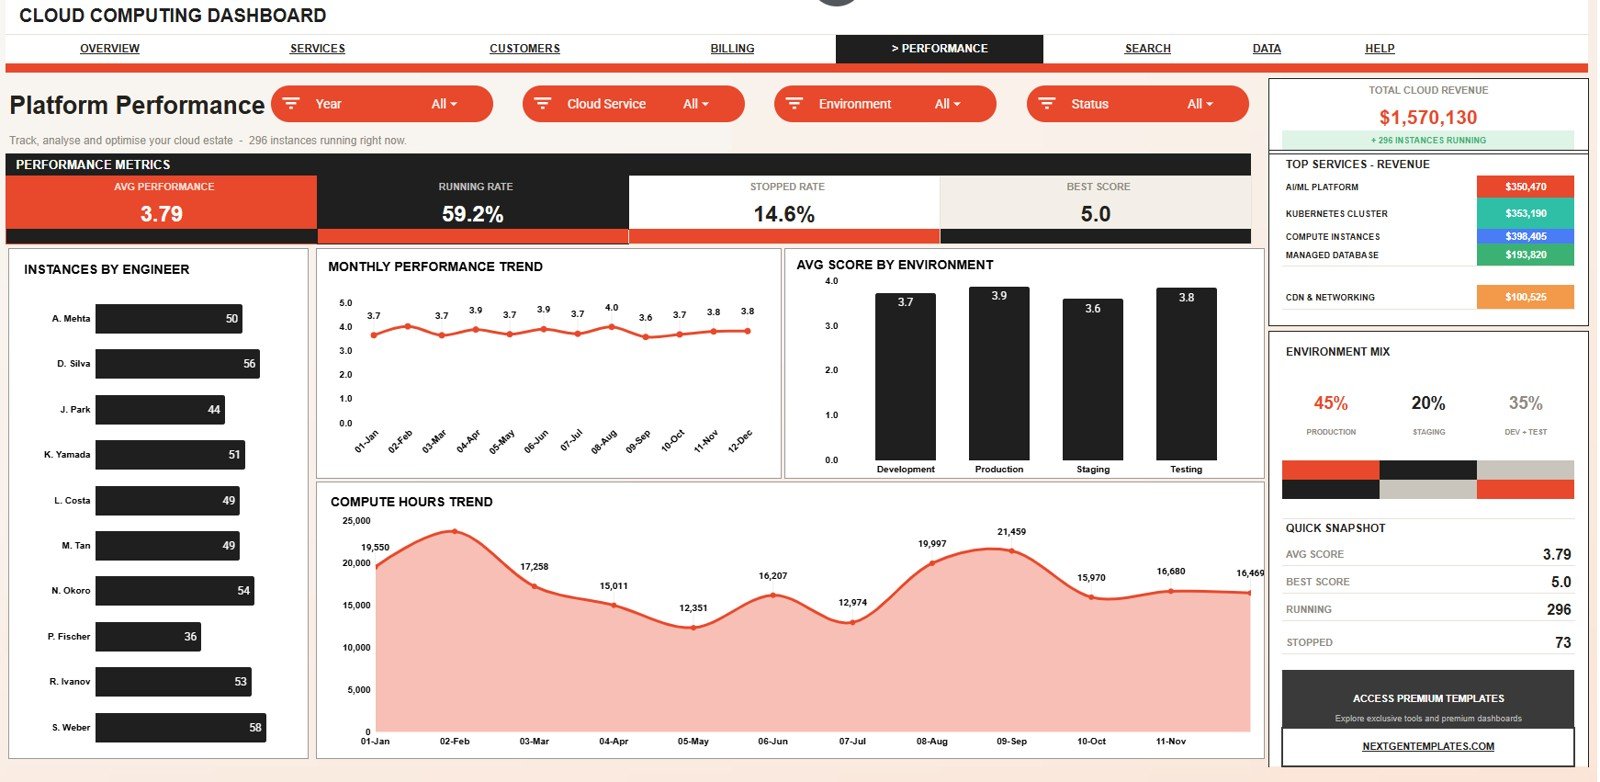
The Platform Performance tab reviews instances by engineer, average performance score by month, average score by environment, and compute hours by month. The Search tab retrieves one complete instance record, while the Data tab is where users add their own records.
Cloud Computing Dashboard in Google Sheets vs. Microsoft Excel Dashboard vs. Paid Cloud SaaS – Where This Fits
| Feature | This Google Sheets dashboard | Microsoft Excel dashboard | Paid cloud SaaS or BI tool |
|---|---|---|---|
| Cost | $9.99 one-time sale price | Template cost plus Excel access | Usually monthly or annual subscription |
| Platform | Google Sheets in browser and Drive | Excel desktop or web | Vendor cloud or BI workspace |
| Setup time | Copy file and replace sample data | Open workbook and configure sharing | Connector setup, onboarding, or analyst build |
| Team collaboration | Native Google Sheets sharing | Depends on OneDrive or SharePoint | Usually included by user role |
| Instance lookup | Included with Instance ID selector | Must be built or customized | Depends on the platform data model |
| Year-1 cost at 5 users | One-time template price, plus any Google Workspace plan already used | Template plus Microsoft licensing if needed | Can become hundreds or thousands per year |
Who This Template Is For – and Who It’s Not For
This template is for IT managers, cloud operations analysts, finance teams, DevOps leads, MSPs, founders, and consultants who need a spreadsheet-based view of cloud revenue, cost, services, regions, plans, engineers, environments, and instance records.
It is not the right fit if you need live API connections to AWS, Azure, Google Cloud, real-time uptime alerts, role-based access logs, or automated incident response. Use it as a reporting layer after your team exports or enters the cloud data.
How to Use the Cloud Computing Dashboard in Google Sheets
- Open the PDF guide included with your download.
- Create your own editable copy in Google Drive.
- Replace sample records in the Data Sheet tab using the same column structure.
- Use slicers to filter dashboard pages by available cloud dimensions.
- Select an Instance ID in the Search tab to inspect one full instance record.
- Review cloud revenue, cost, services, regions, plans, environments, engineers, and performance each month.
Real-World Use Cases
A cloud operations manager uses the Overview and Service Performance tabs to compare running instances, cloud service revenue, compute hours, and average performance before the monthly infrastructure meeting.
A finance analyst uses Billing & Margin to review infrastructure cost by month, region, and plan so cloud spend discussions are tied to revenue movement.
An MSP consultant uses the Search Sheet to answer client questions about a single instance without scanning hundreds of rows.
Frequently Asked Questions
What does the Cloud Computing Dashboard in Google Sheets track?
It tracks revenue, running instances, infrastructure cost, performance score, cloud service, region, environment, customer segment, plan, engineer, compute hours, status, and instance-level records.
Can I customize the cloud services and regions?
Yes. You can replace the sample cloud service, region, environment, plan, segment, and engineer values while keeping the same data structure.
Does it connect directly to cloud platforms?
No. It is a Google Sheets reporting template for exported or manually added cloud data. Direct API automation would require a separate custom integration.
Is there an instance lookup sheet?
Yes. The Search Sheet tab lets you select an Instance ID and see the full record for that instance.
Is this a one-time purchase?
Yes. It is a one-time template purchase from NextGenTemplates, not a recurring cloud reporting subscription.
About the Author
Built by PK – Microsoft Certified Professional with 15+ years of Excel, Google Sheets, and Power BI experience. Founder of NextGenTemplates, reaching 300K+ subscribers across YouTube channels. Every template is hand-built and tested before release.
Explore Related Templates
- Browse Google Sheets templates for more spreadsheet-based business tools.
- Browse Google Sheets dashboard templates for more dashboard products.
- Cloud Computing KPI Dashboard in Google Sheets for KPI target tracking.
- Cloud Computing Dashboard in Power BI for Power BI users.
- Cybersecurity Dashboard in Google Sheets for IT security reporting.
Download the Cloud Computing Dashboard in Google Sheets to review cloud revenue, cost, instances, regions, services, plans, engineers, and performance in one editable Google Sheets file.
Watch the step-by-step video Demo:
Last updated: August 7, 2026.
































Reviews
There are no reviews yet.