

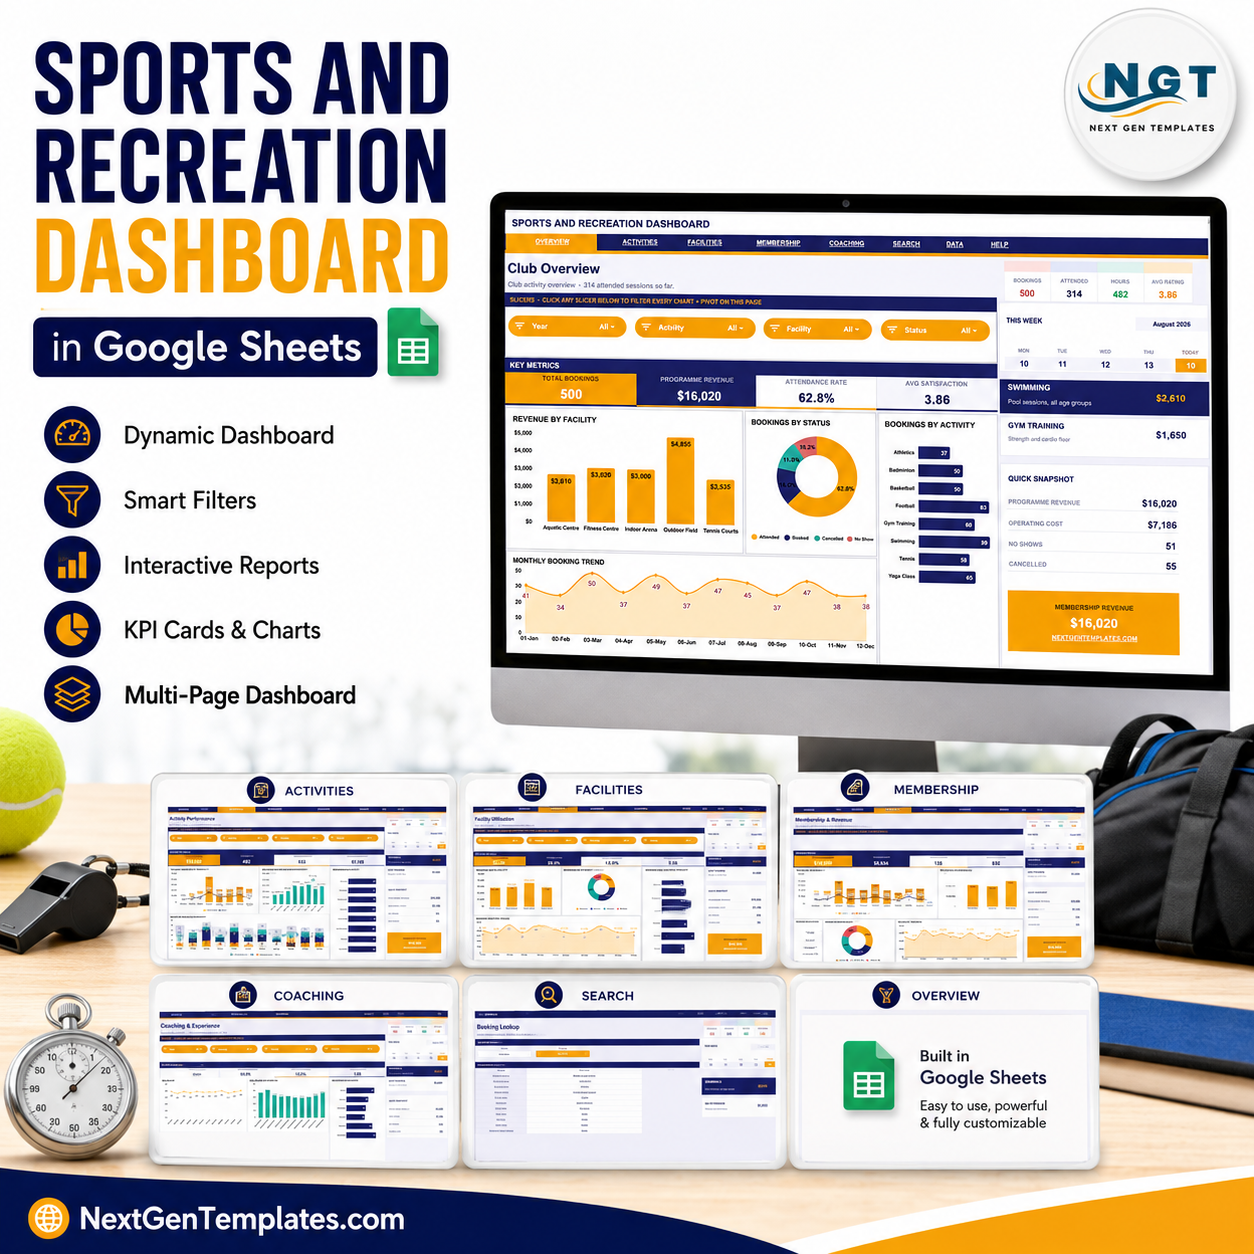
Sports and Recreation Dashboard in Google Sheets gives sports clubs, recreation centers, gyms, coaching academies, and community facilities a 7-tab reporting workbook with 4 overview cards, 20 chart views, slicers, a Booking ID lookup sheet, and a clean data sheet. At the $9.99 sale price, it is a one-time purchase for teams that want booking, revenue, attendance, facility, membership, and coaching visibility without a monthly analytics tool or per-user fee. Built by PK for a 300K+ subscriber audience, it helps managers replace scattered manual reports with one shareable Google Sheets dashboard.
Key Features of Sports and Recreation Dashboard in Google Sheets
- 4 overview KPI cards: Track Total Bookings, Programme Revenue, Attendance Rate, and Avg Satisfaction.
- 7 organized tabs: Overview, Activity Performance, Facility Utilisation, Membership & Revenue, Coaching & Experience, Search, and Data Sheet.
- 20 chart views: Review revenue, bookings, activity mix, facilities, time slots, memberships, age groups, coaches, satisfaction, and session hours.
- Interactive slicers: Filter every dashboard page quickly during weekly, monthly, or facility-level reviews.
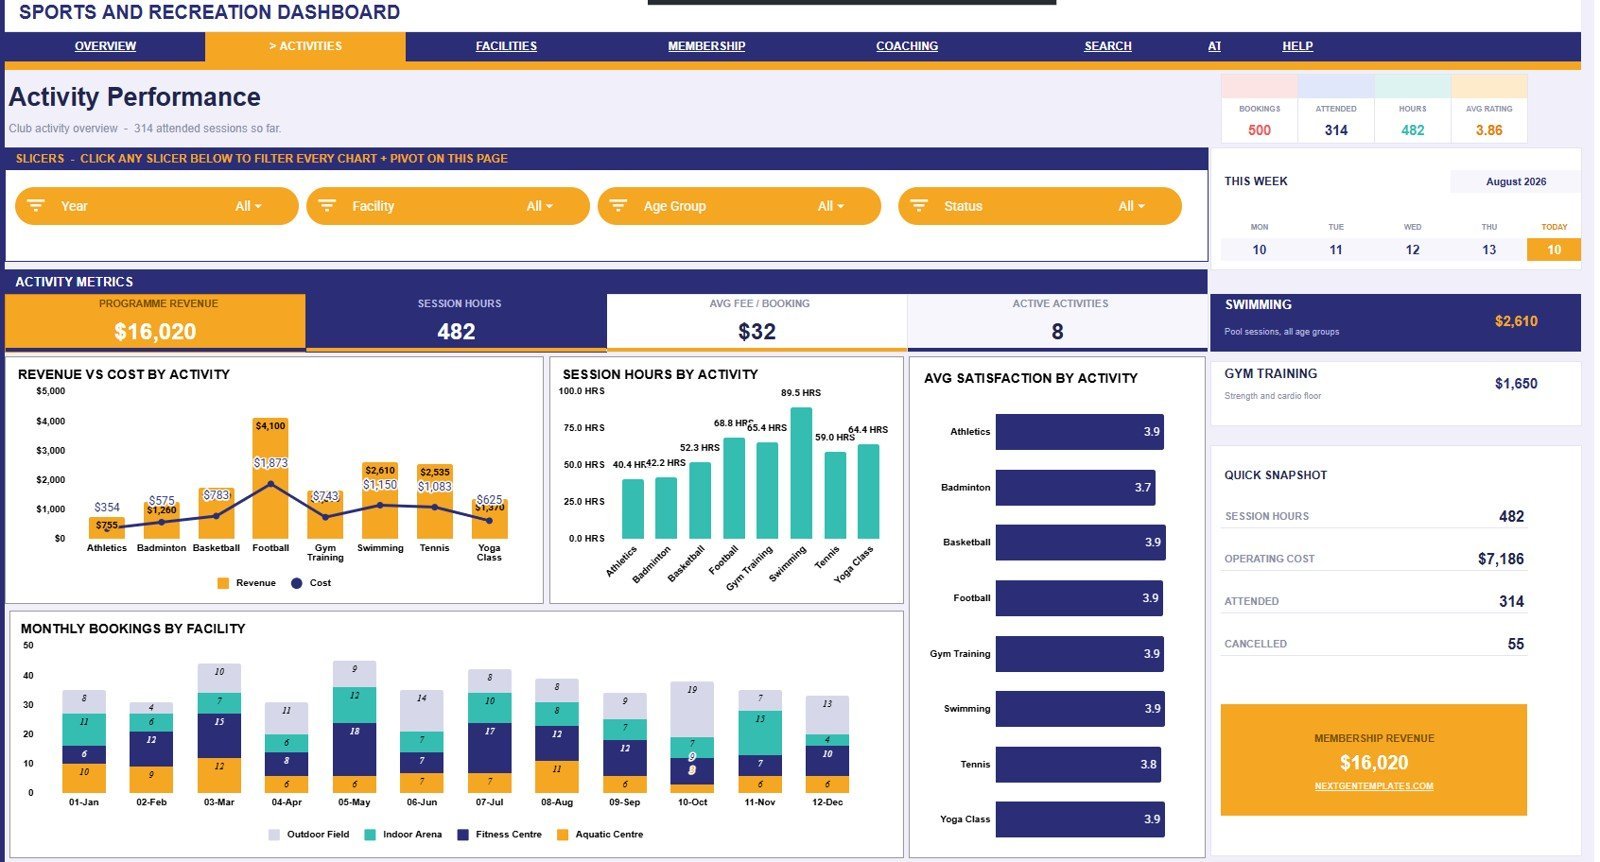
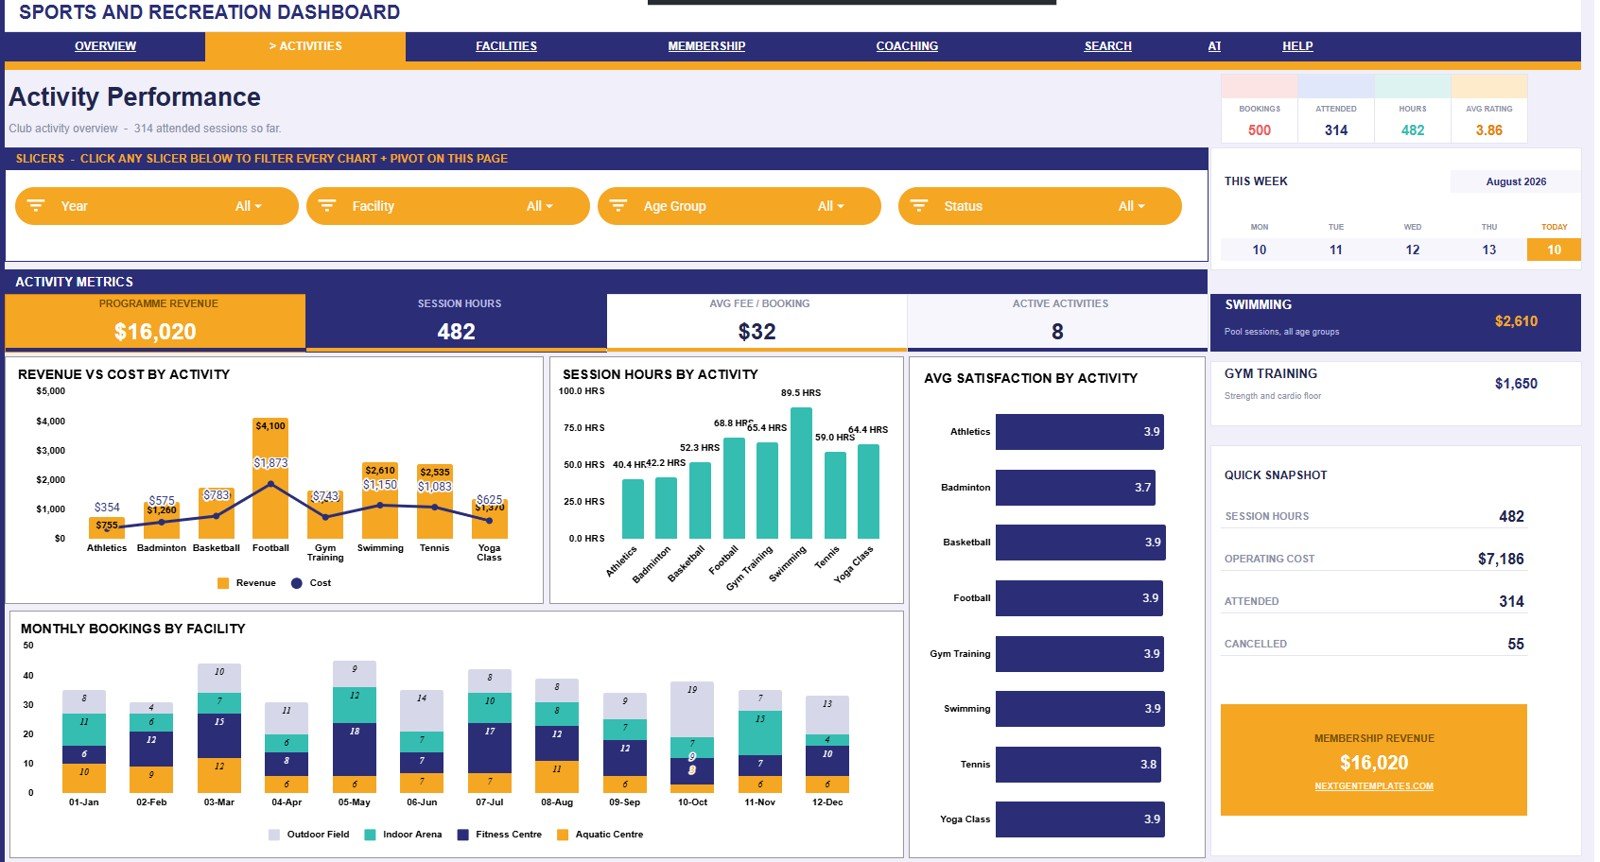
- Activity performance analysis: Compare revenue, cost, session hours, bookings, and satisfaction by activity.
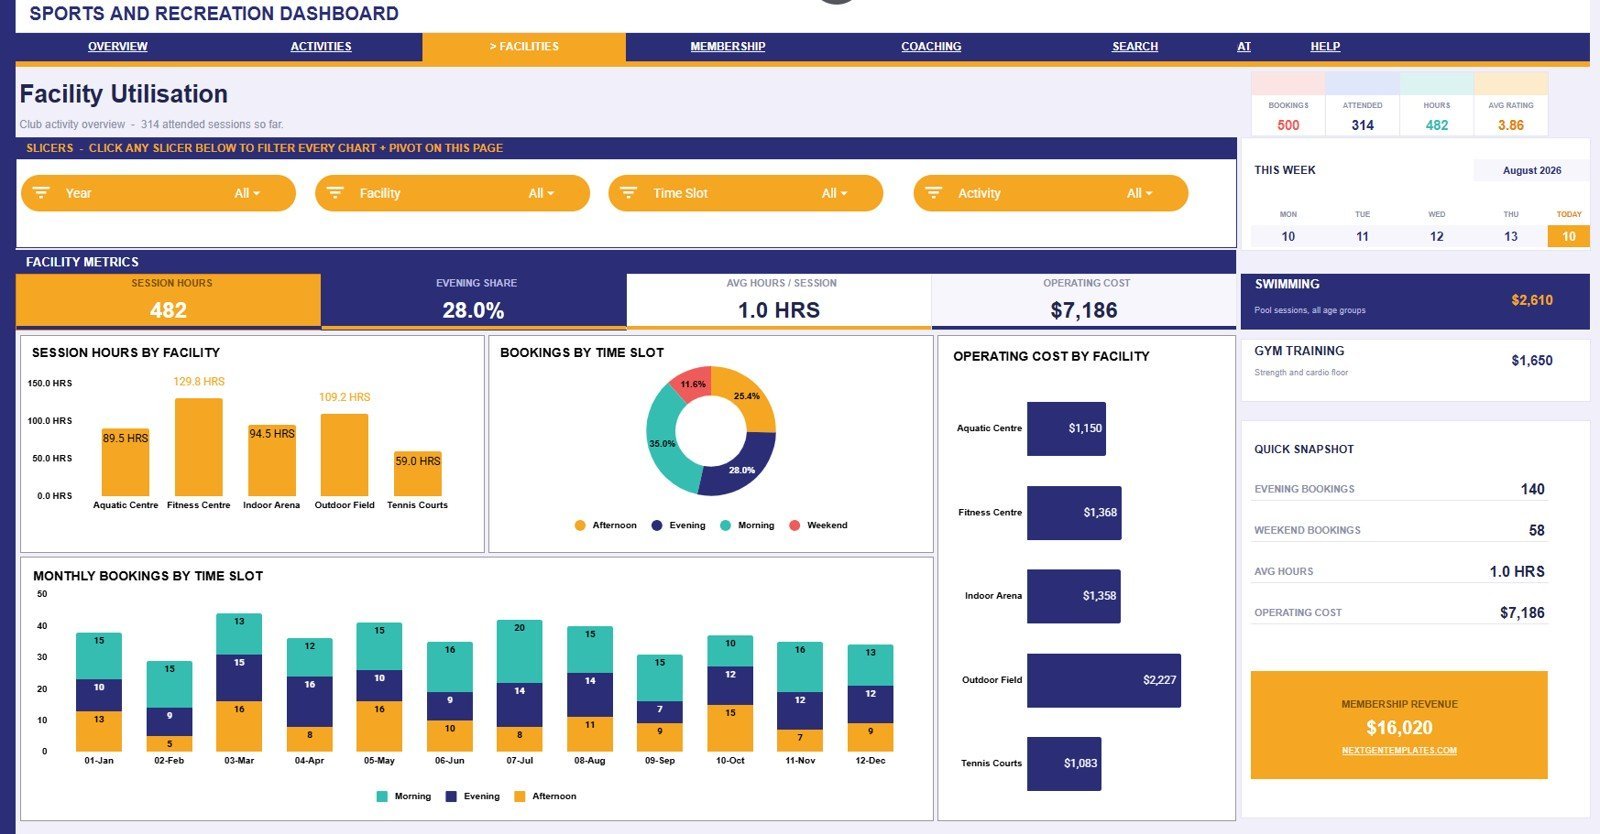
- Facility utilisation reporting: See where hours, booking demand, cost, and time-slot volume are concentrated.
- Booking lookup sheet: Select a Booking ID and inspect the complete record in one place.
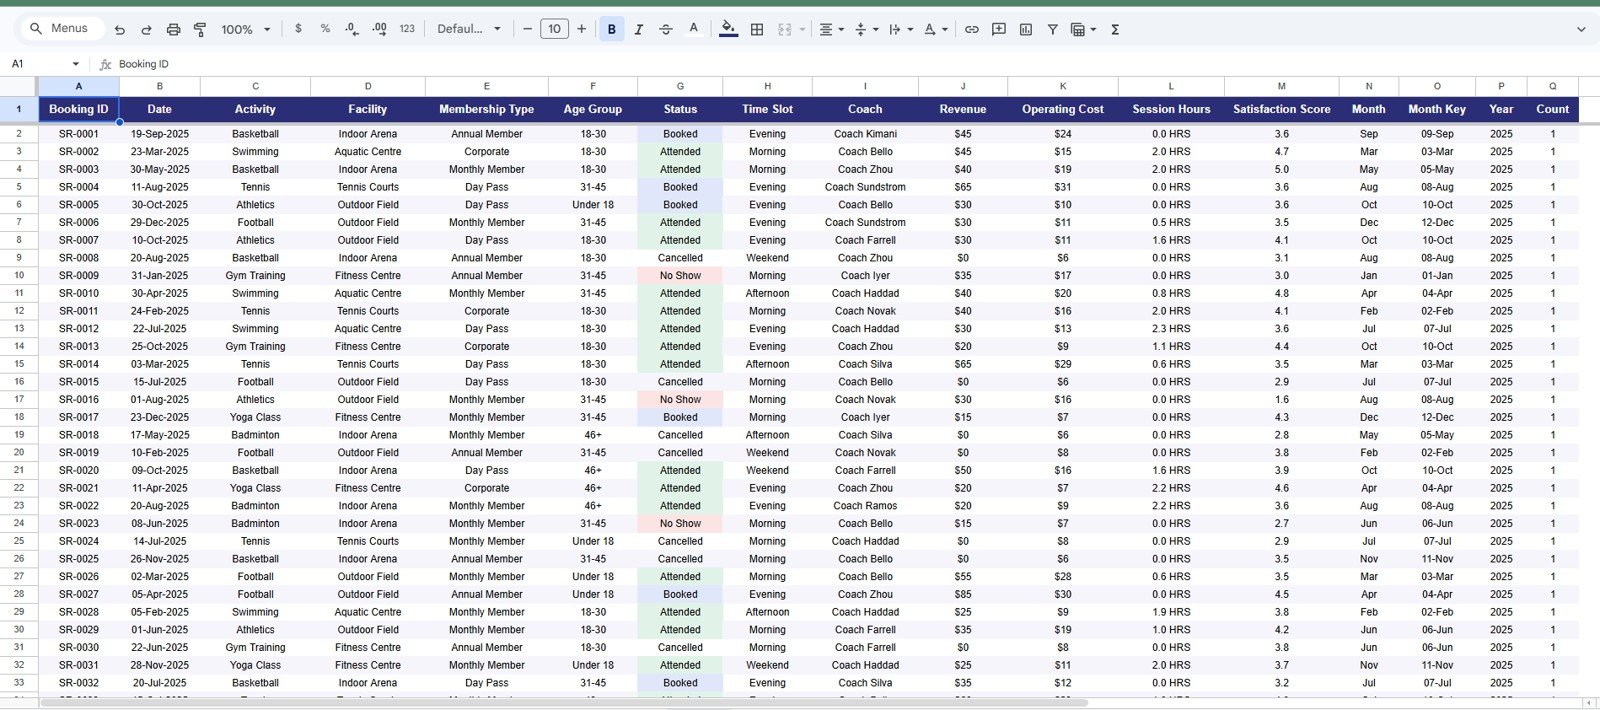
- Editable data sheet: Replace the sample booking data while keeping the same column format.
What’s Inside the Sports and Recreation Dashboard in Google Sheets
1 – Overview Page
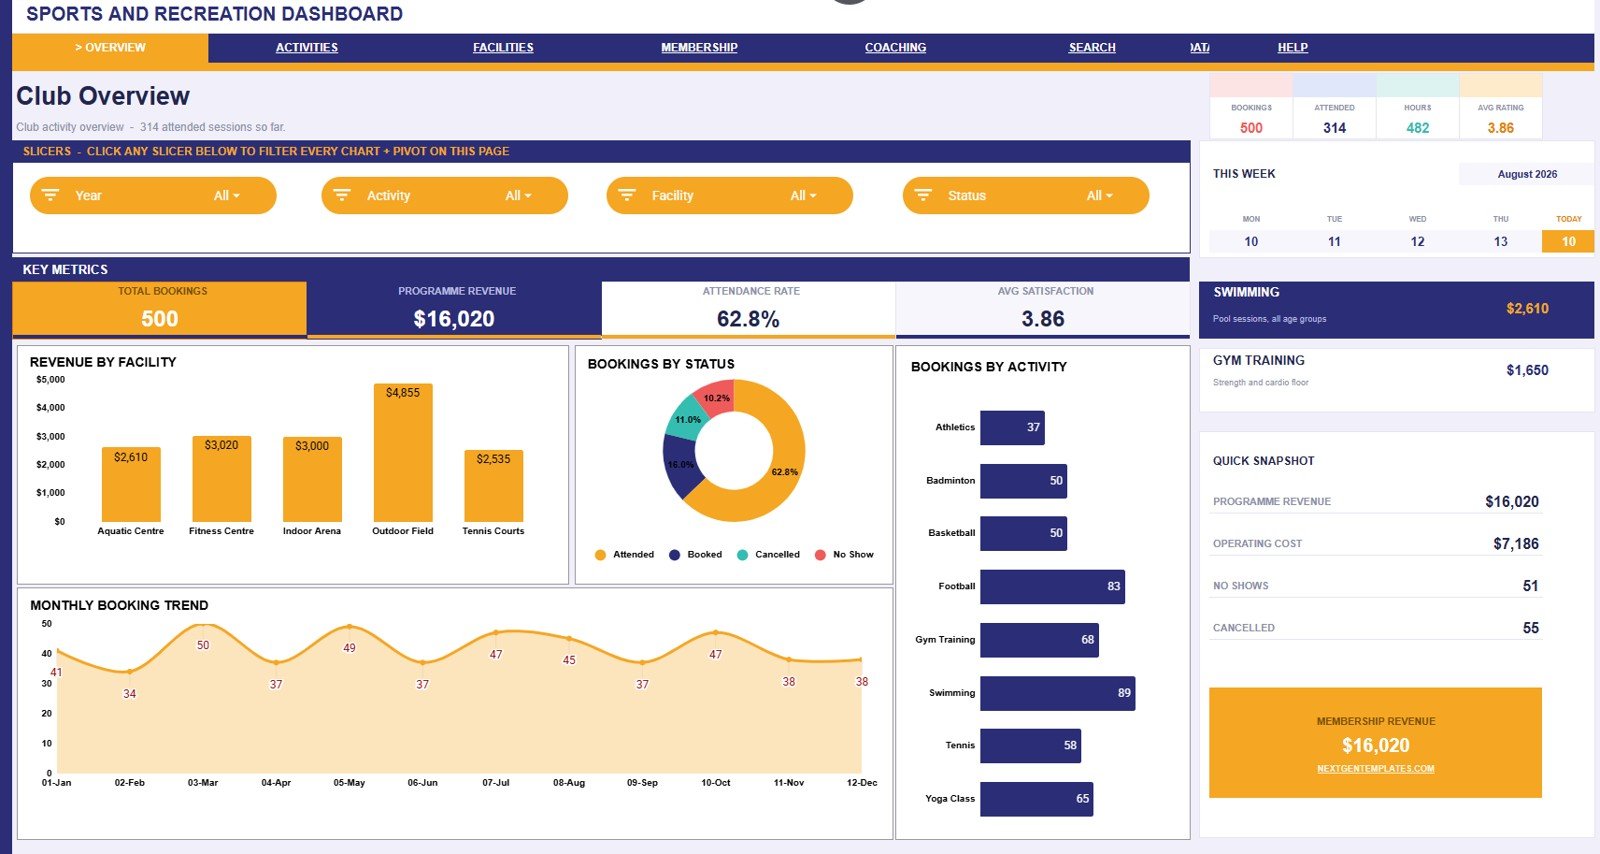
The Overview page gives managers a fast summary of Total Bookings, Programme Revenue, Attendance Rate, and Avg Satisfaction. The charts show revenue by facility, bookings by status, bookings by activity, and bookings by month so leaders can see where demand and income are moving.
2 – Activity Performance
Activity Performance compares revenue and operating cost by activity, session hours by activity, average satisfaction by activity, and monthly bookings by facility. It helps teams decide which programs deserve more capacity, pricing review, or coaching attention.
3 – Facility Utilisation
The Facility Utilisation tab explains how facilities are being used across session hours, time slots, operating cost, and monthly booking volume. Use it to spot underused spaces, overloaded periods, and facilities that need cost control.

4 – Membership & Revenue
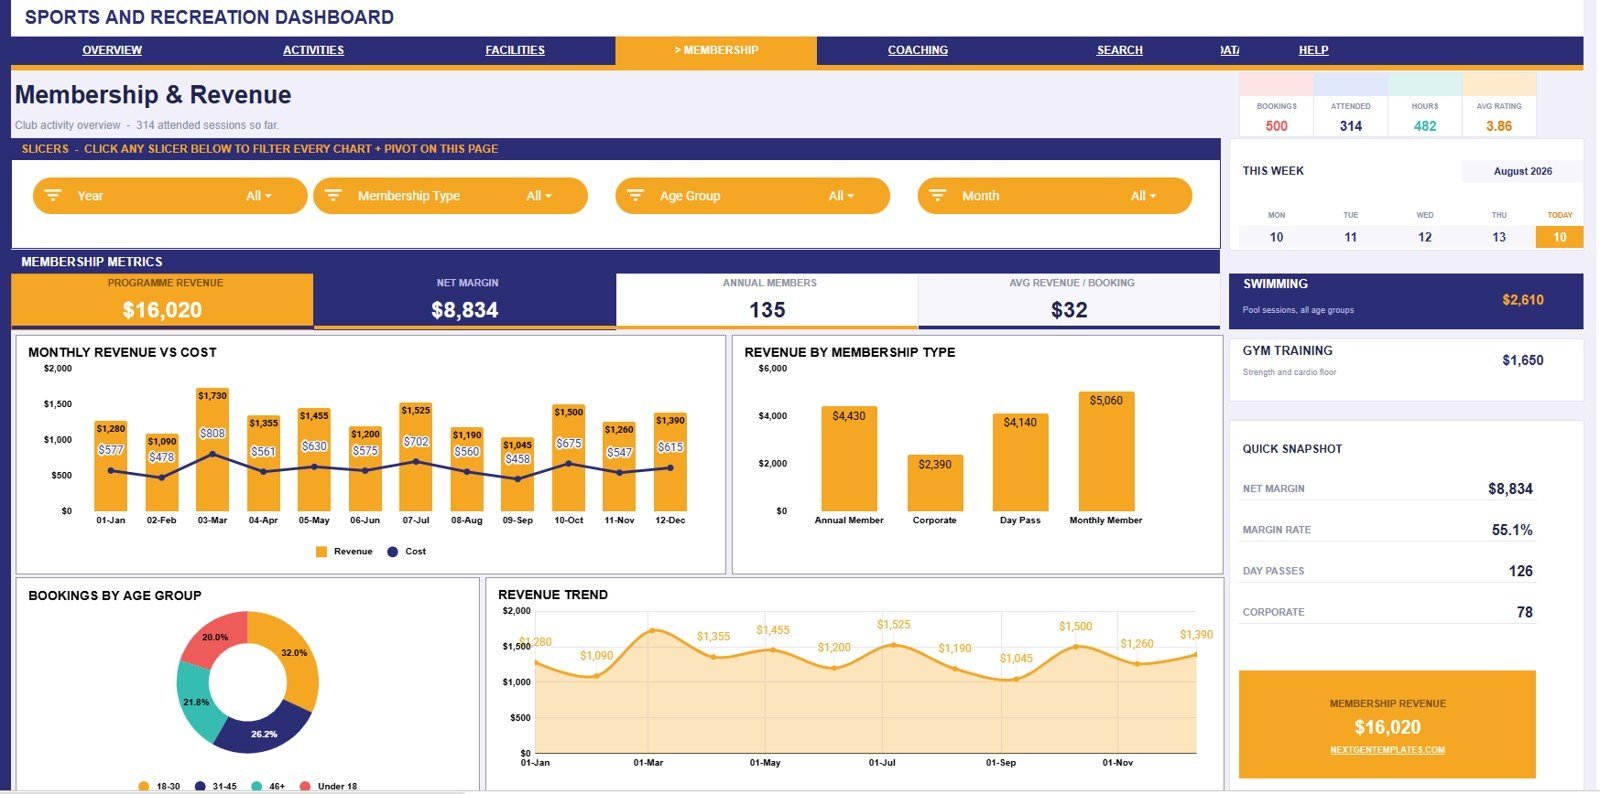
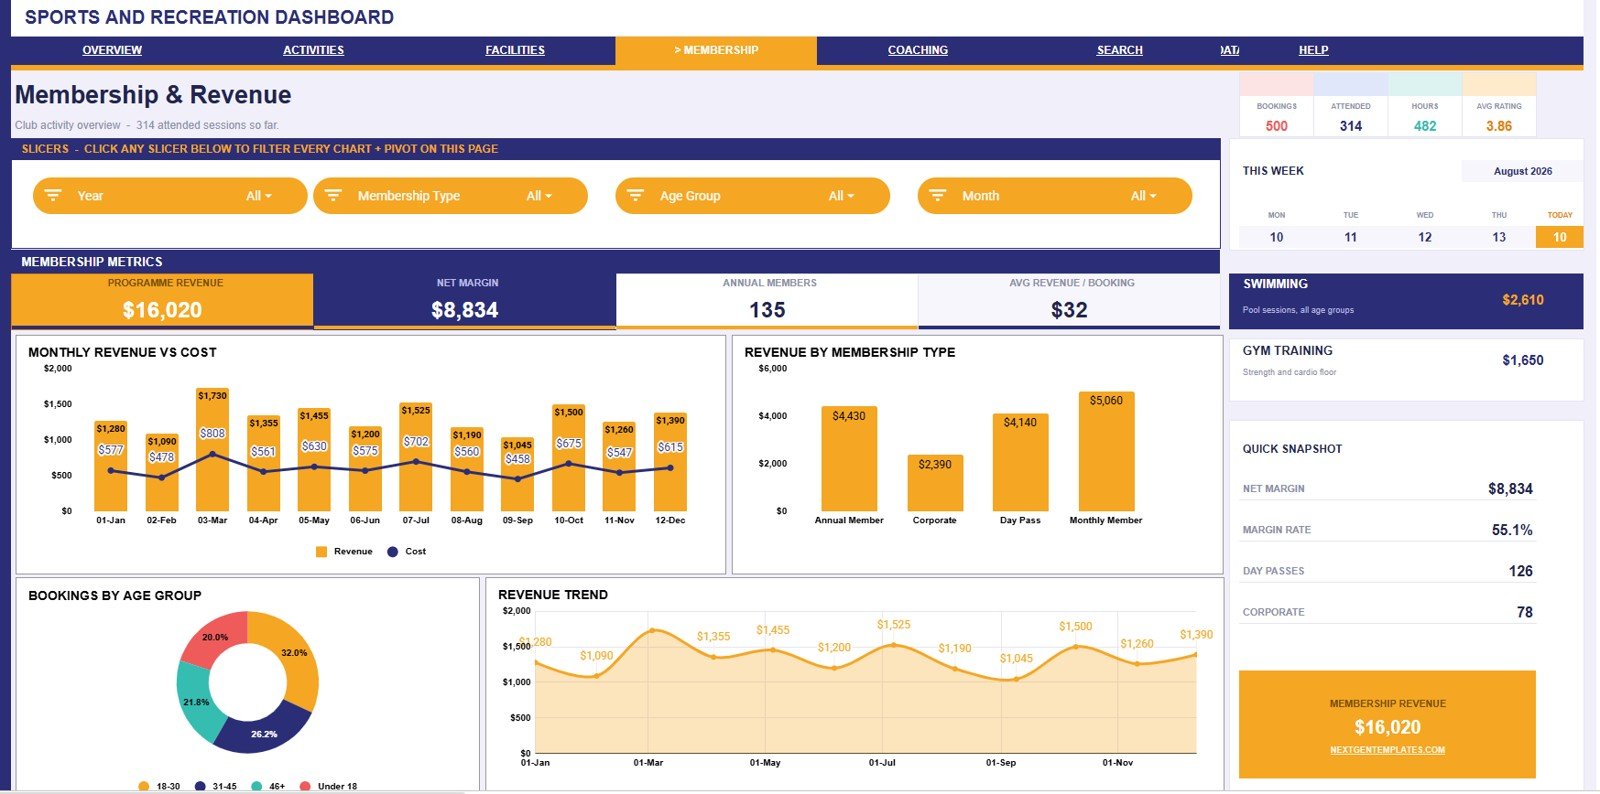
Membership & Revenue connects booking income with membership behavior. It includes monthly revenue vs cost, revenue by membership type, bookings by age group, and revenue trend so managers can review margin, member mix, and seasonal revenue movement.
5 – Coaching & Experience
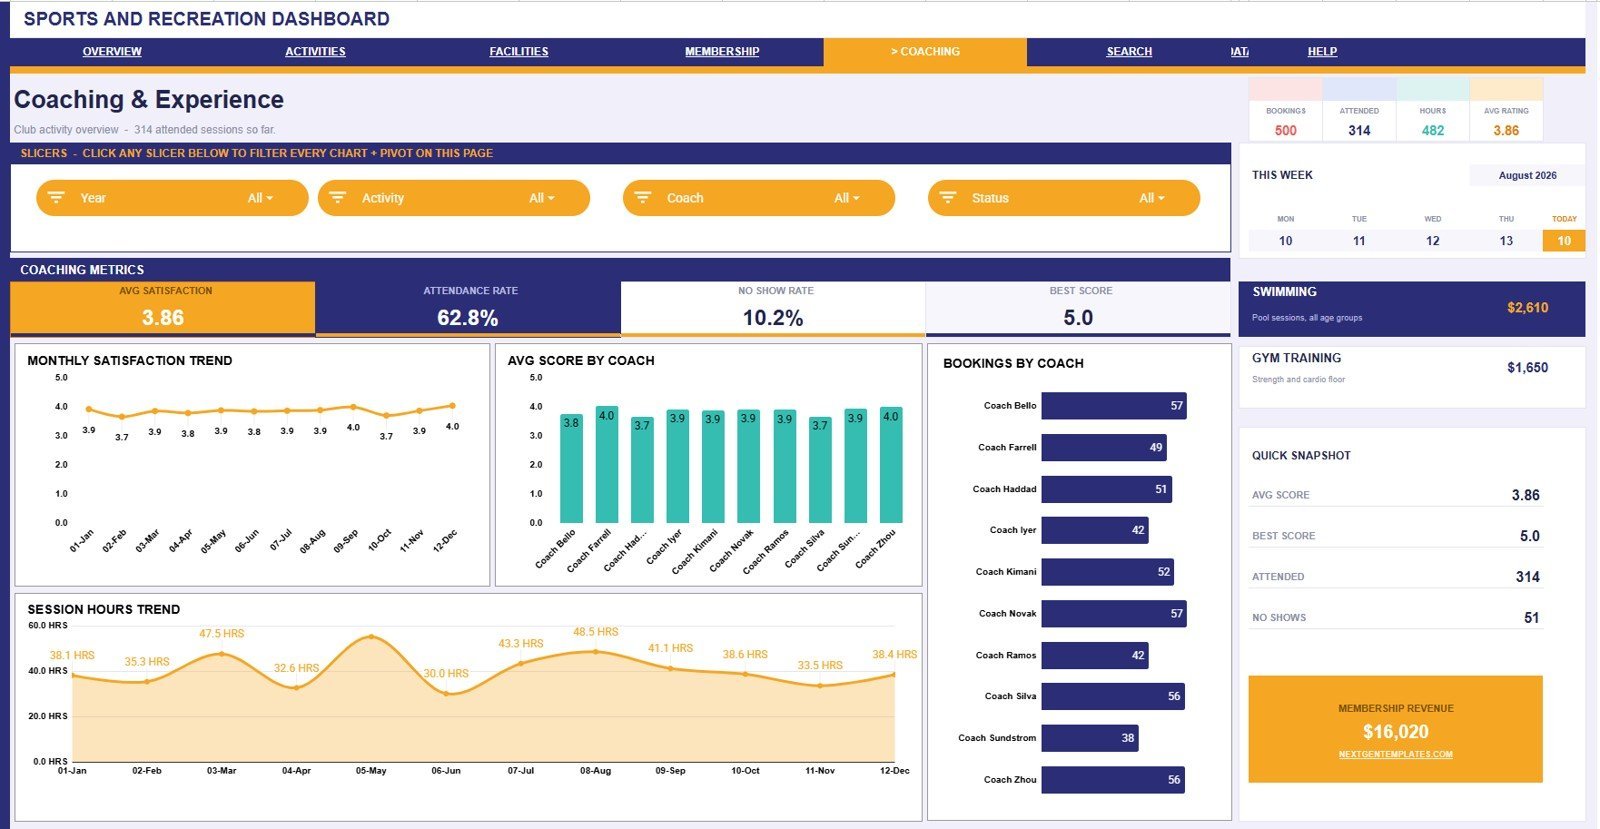
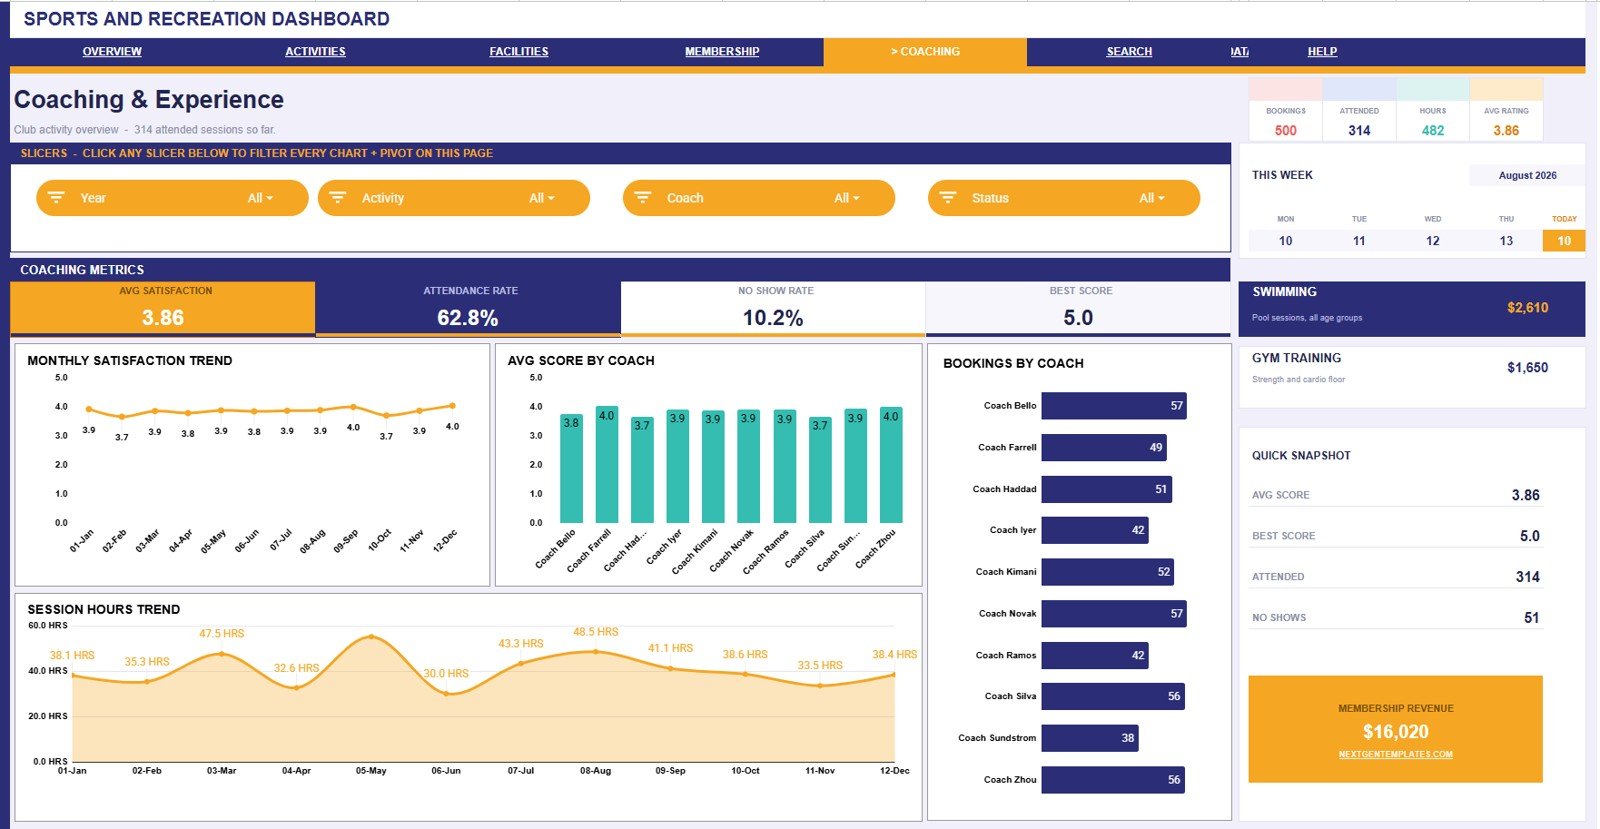
Coaching & Experience reviews satisfaction score by month, average score by coach, bookings by coach, and session hours by month. It helps supervisors compare coach activity with participant experience and service quality.
6 – Booking Lookup Search Sheet
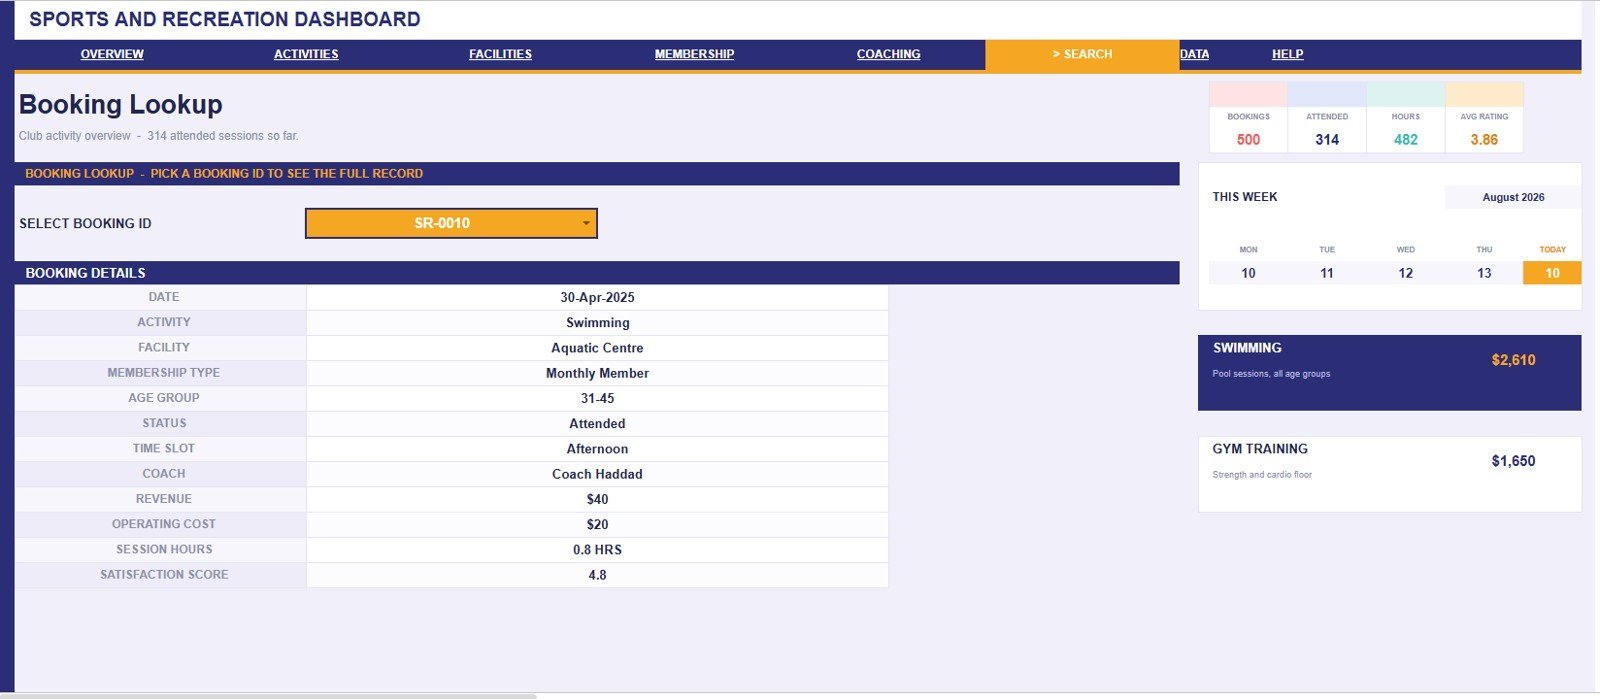
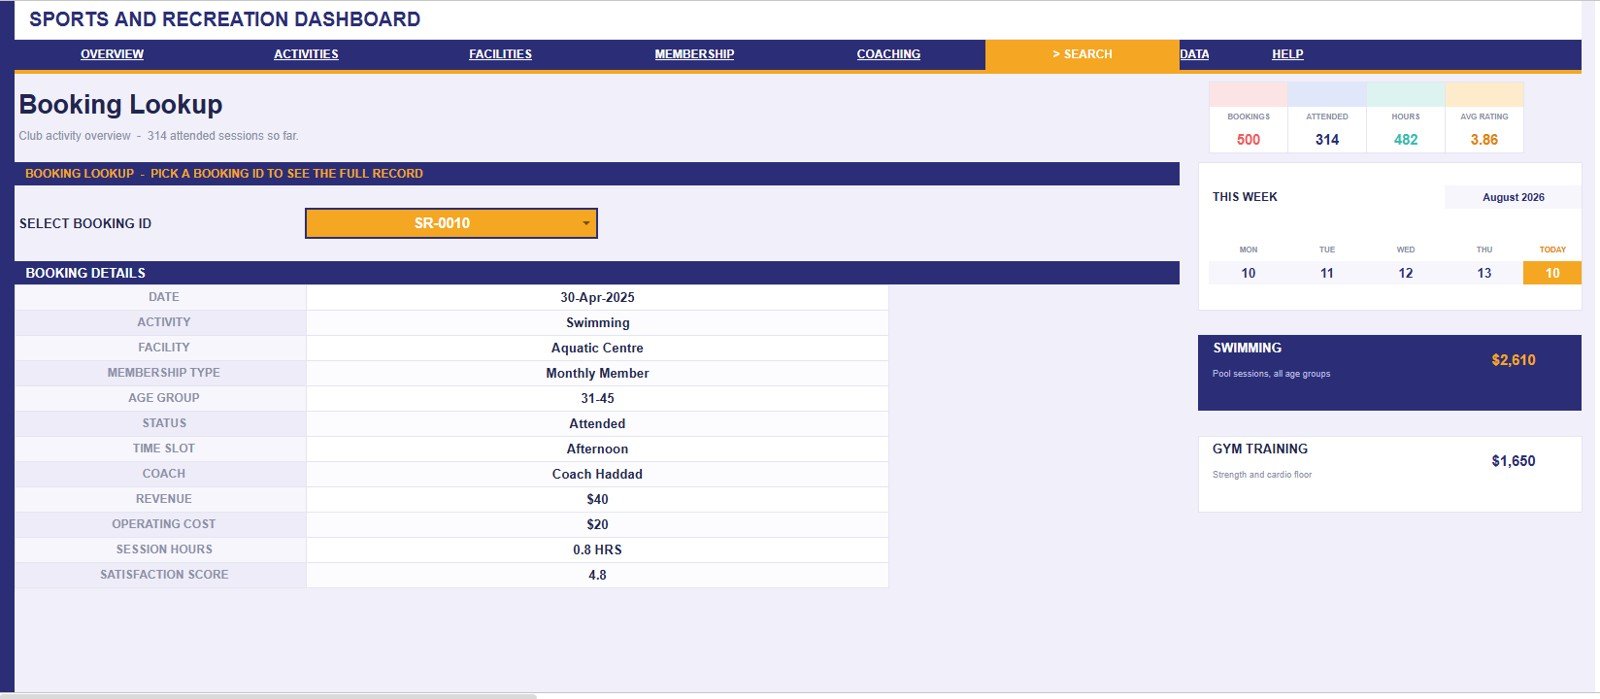
The Search sheet lets users select a Booking ID and see the full booking record with date, activity, facility, membership type, age group, status, time slot, coach, revenue, operating cost, session hours, and satisfaction score.
7 – Data Sheet Tab
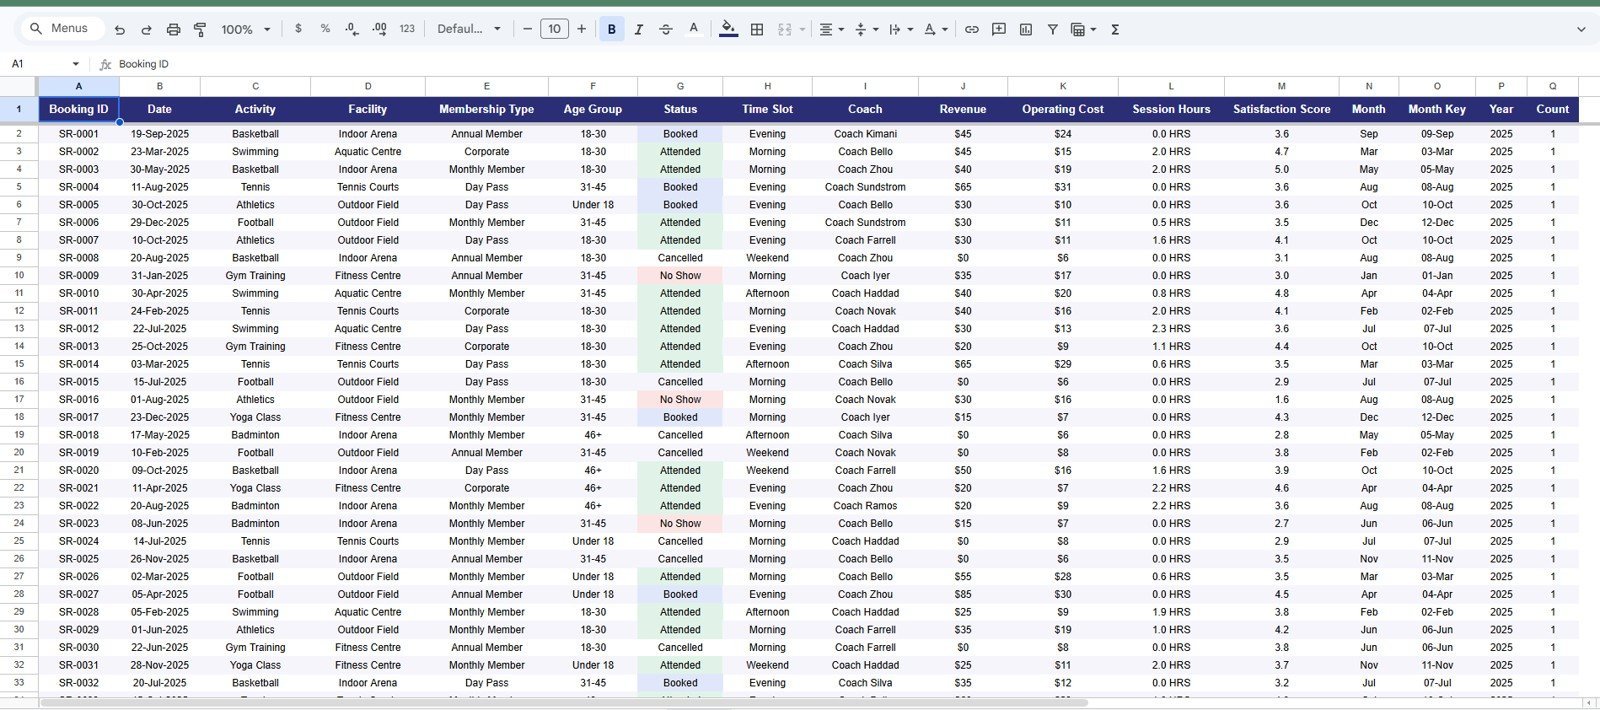
The Data Sheet is where users add booking records in the same sample format. Keeping the headers and structure consistent protects the slicers, cards, charts, reports, and Booking ID search lookup.
Sports and Recreation Dashboard in Google Sheets vs. Microsoft Excel Dashboard vs. Paid CRM/SaaS – Where This Fits
| Feature | This Google Sheets dashboard | Microsoft Excel dashboard | Paid recreation SaaS |
|---|---|---|---|
| Cost | $9.99 one-time sale price | Template cost plus Excel access | Monthly or annual subscription |
| Platform | Google Sheets in browser | Excel desktop or web | Vendor-hosted web app |
| Setup time | Copy file, replace data, review | Open workbook and refresh | Account setup and onboarding |
| Real-time team collaboration | Built into Google Drive sharing | Depends on OneDrive or SharePoint | Usually included by plan |
| Mobile access | Google Sheets app or browser | Excel app or web viewer | Usually included |
| Customizable fields | Edit sheet fields, formulas, and charts | Edit workbook formulas and pivots | Often limited by vendor settings |
| Share with link | Yes, subject to Drive permissions | Yes, subject to Microsoft sharing setup | Usually login controlled |
| Year-1 cost at 5 users | $9.99 plus any Google Workspace cost | Template plus licensing | Often hundreds or thousands |
| Booking lookup | Built-in Booking ID search sheet | Depends on workbook design | Usually included by plan |
Who This Template Is For – and Who It’s Not For
This template is for recreation center managers, sports club operators, gym administrators, coaching coordinators, community facility teams, and analysts who already have booking records and need quick reporting in Google Sheets.
It is not a booking engine, payment processor, member portal, access-control system, league registration platform, or replacement for full recreation management software. Use it as an analytics layer after booking data has been exported or prepared.
How to Use the Sports and Recreation Dashboard in Google Sheets
- Open the product download and follow the Google Sheets copy guide.
- Create your own editable copy in Google Drive.
- Go to the Data Sheet tab and replace the sample booking records in the same format.
- Review the Overview page first, then open Activity Performance, Facility Utilisation, Membership & Revenue, and Coaching & Experience.
- Use slicers to filter by fields such as activity, facility, membership type, age group, status, time slot, coach, year, or month.
- Use the Search sheet when you need to inspect one Booking ID in detail.
Real-World Use Cases
Maya, recreation center manager: reviews bookings by activity and revenue by facility before deciding which programs need more slots next month.
Daniel, sports club finance lead: compares monthly revenue vs cost and revenue by membership type before the quarterly budget meeting.
Aisha, coaching coordinator: uses average score by coach and satisfaction score by month to identify where coaching support or schedule changes may improve experience.
Frequently Asked Questions
What does this dashboard track?
It tracks bookings, programme revenue, attendance rate, satisfaction, activities, facilities, time slots, membership types, age groups, status, coaches, revenue, operating cost, session hours, and monthly trends.
Does this template work in Google Sheets?
Yes. It is built for Google Sheets and can be copied to Google Drive for editing, sharing, and collaboration.
Can I replace the sample data?
Yes. Add your own booking rows to the Data Sheet tab using the same column structure.
Does it include a search sheet?
Yes. Select a Booking ID to view the full booking record, including date, activity, facility, membership type, time slot, coach, revenue, cost, session hours, and satisfaction score.
Can multiple people use it?
Yes. Google Sheets supports team sharing, so managers and analysts can view or edit the copied file based on Drive permissions.
Is this a full sports management system?
No. It is a reporting dashboard, not a live booking, payment, registration, or member communication system.
About the Author
Built by PK – Microsoft Certified Professional with 15+ years of Excel, Google Sheets, and Power BI experience. Founder of NextGenTemplates, reaching 300K+ subscribers across YouTube channels. Every template is hand-built and tested before release.
Explore Related Templates
- Sports & Recreation Dashboard in Excel – Excel version for offline sports and recreation reporting.
- Sports & Recreation KPI Dashboard in Excel – KPI-focused workbook for target and performance tracking.
- Sports & Recreation Dashboard in Power BI – Power BI option for visual analytics users.
- Fitness and Wellness Dashboard in Google Sheets – nearby Google Sheets dashboard for fitness and wellness teams.
- Google Sheets templates – browse the full Google Sheets collection.
- Google Sheets dashboard templates – browse more dashboard products.
Download the Sports and Recreation Dashboard in Google Sheets to review bookings, revenue, attendance, facilities, activities, memberships, coaching, and satisfaction in one editable workbook.
Watch the step-by-step video Demo:
Last updated: August 10, 2026.

































Reviews
There are no reviews yet.