

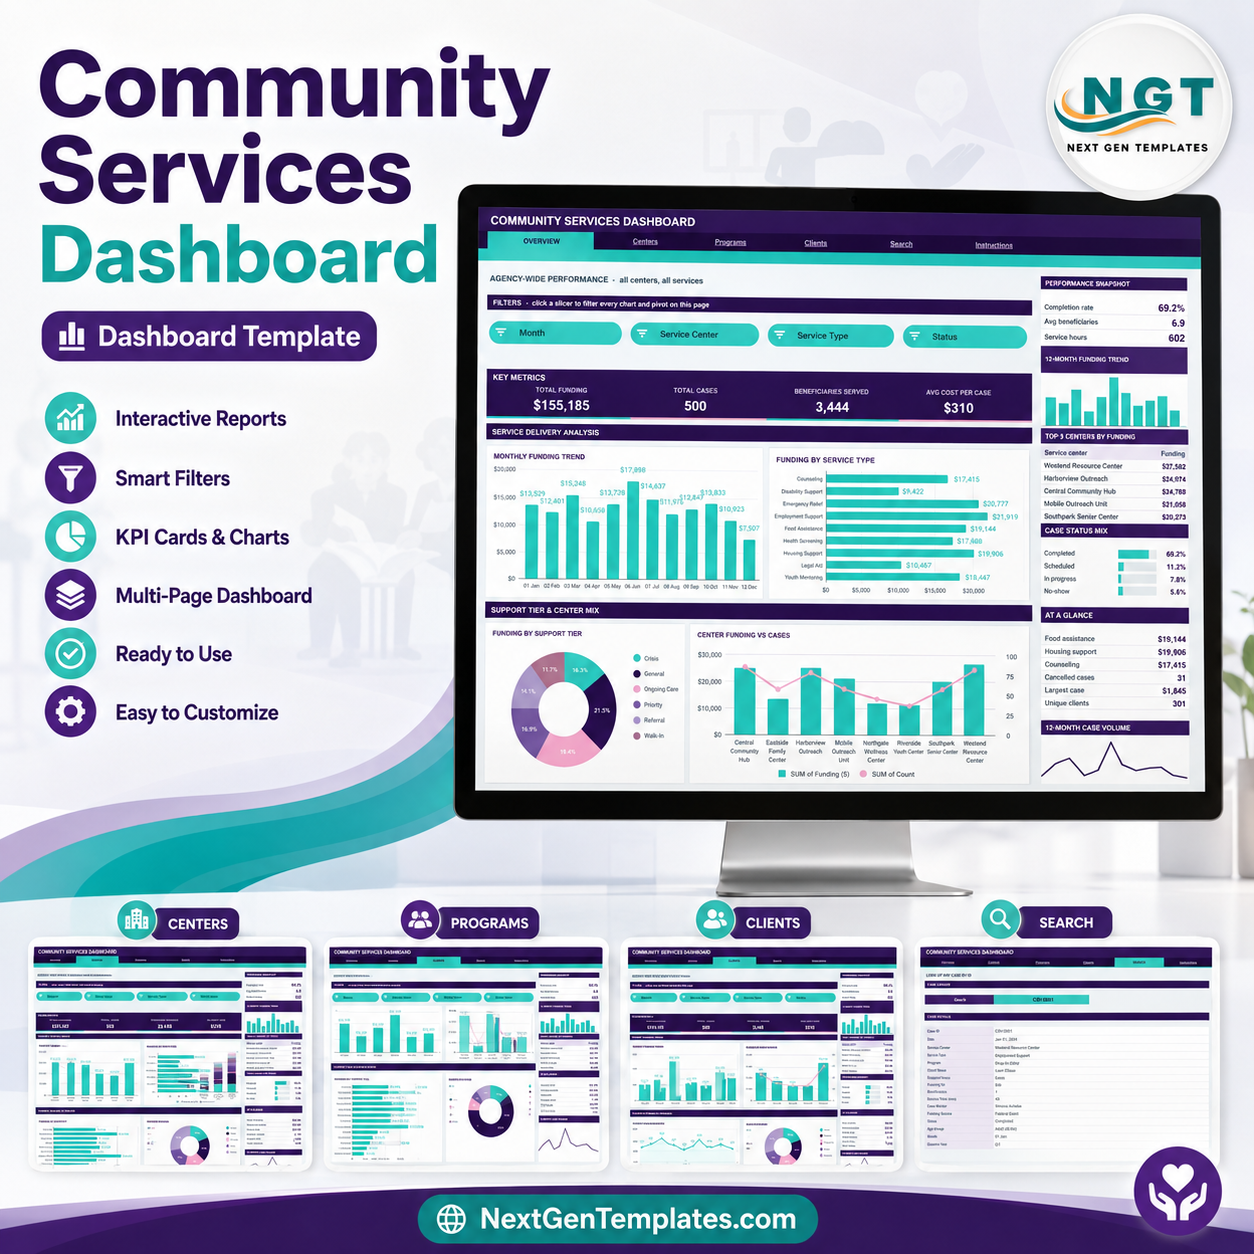
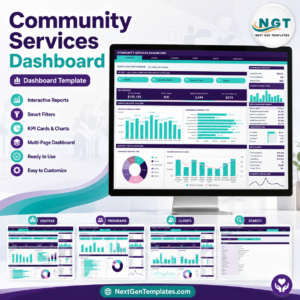
The Community Services Dashboard in Google Sheets tracks 16 KPIs across 4 interactive report pages, built on 16 native pivot tables, 16 pivot charts and 16 slicers. The sample case log carries 500 service records, $155,185 of funding, 3,444 beneficiaries served and an average cost per case of $310, spread across 8 service centres, 8 programs and 9 service types.
Setup takes under 10 minutes. Paste your own case log onto the Data sheet, keep the column headers, and every chart, KPI card, Top 5 panel and slicer recalculates. Pivots, slicers and formulas already cover 1,000 rows.
🌍 Join 8,400+ teams in 40+ countries using NextGenTemplates to replace paid SaaS tools with one-time-purchase Excel, Google Sheets, Power BI, and HTML templates.
✅ Instant download · One-time payment · No subscription · No per-user fees · Lifetime access
🔑 Key Features of the Community Services Dashboard in Google Sheets
- 📊 Four slicer-driven report pages. Overview, Centers, Programs and Clients. Each page carries four slicers, four KPI cards, four charts and a sidebar holding a snapshot panel, a Top 5 table, a funding-share bar list and an At a Glance summary.
- 🎛️ Native pivot tables and slicers, not helper formulas. Every chart reads a real pivot table parked to the right of each page, so the file stays fast as the case log grows. Click one slicer and all four charts plus the Top 5 panel move together.
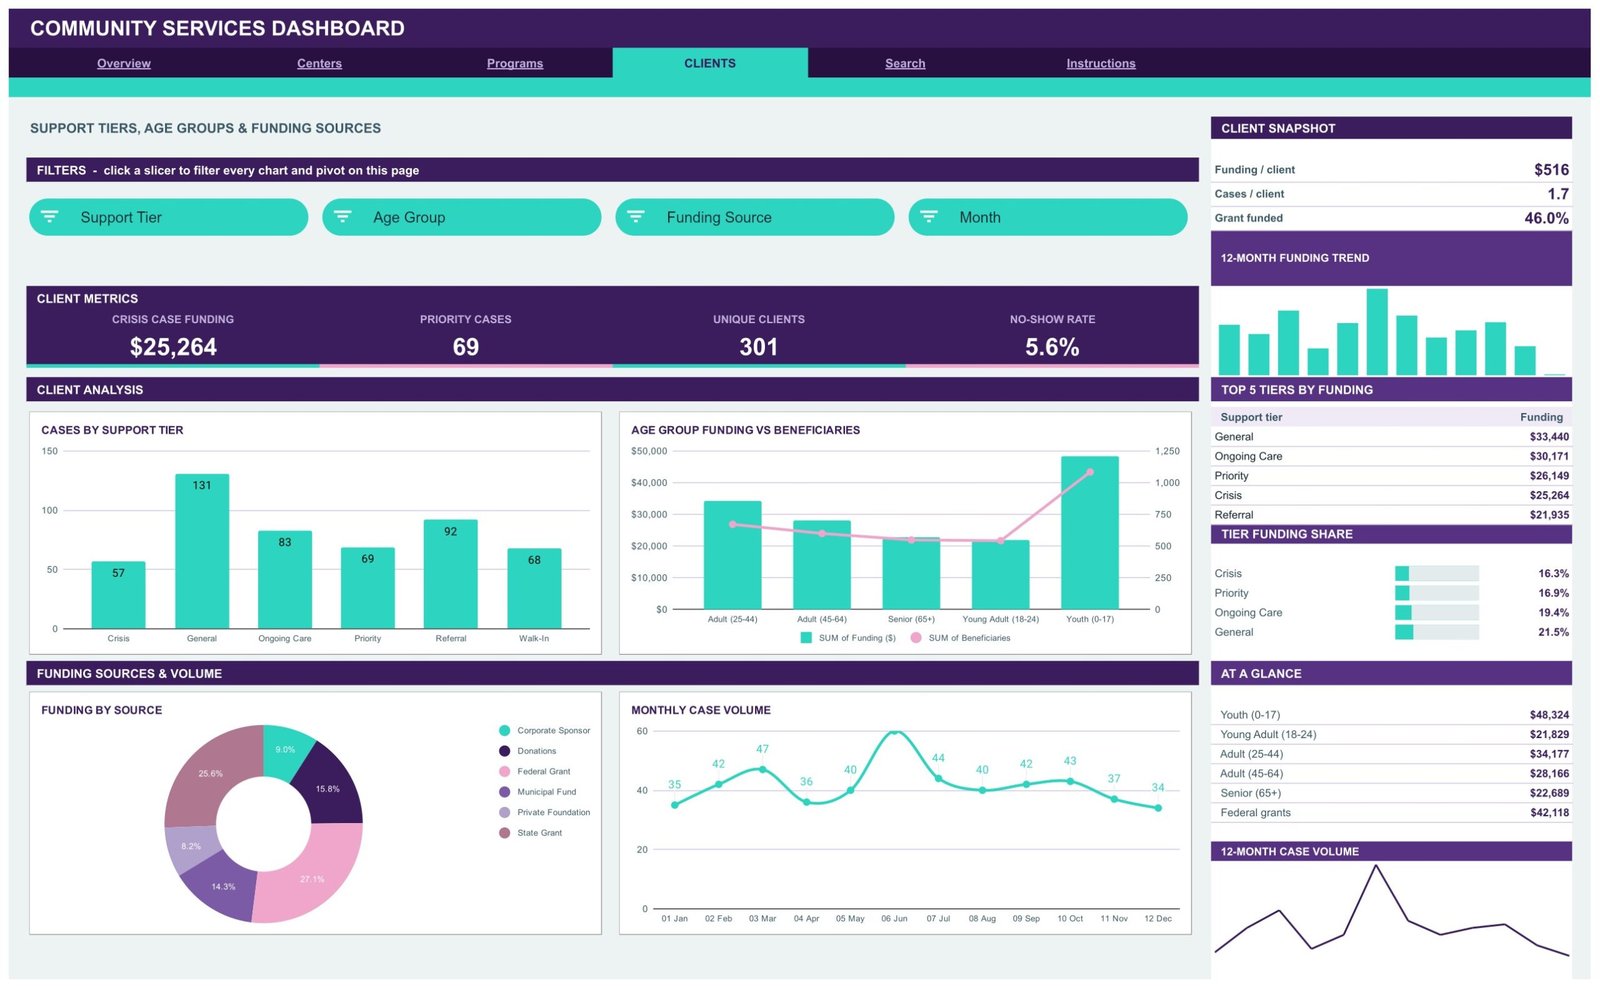
- 💰 Funding analysed five ways. By month, service type, support tier, service centre and funding source. The sample data splits $155,185 across Federal Grant 27.1%, State Grant 25.6%, Donations 15.8%, Municipal Fund 14.3%, Corporate Sponsor 9.0% and Private Foundation 8.2%.
- 👥 Case and beneficiary metrics side by side. 500 cases, 3,444 beneficiaries, 301 unique clients, a 69.2% completion rate and a 5.6% no-show rate all read straight off the Data sheet.
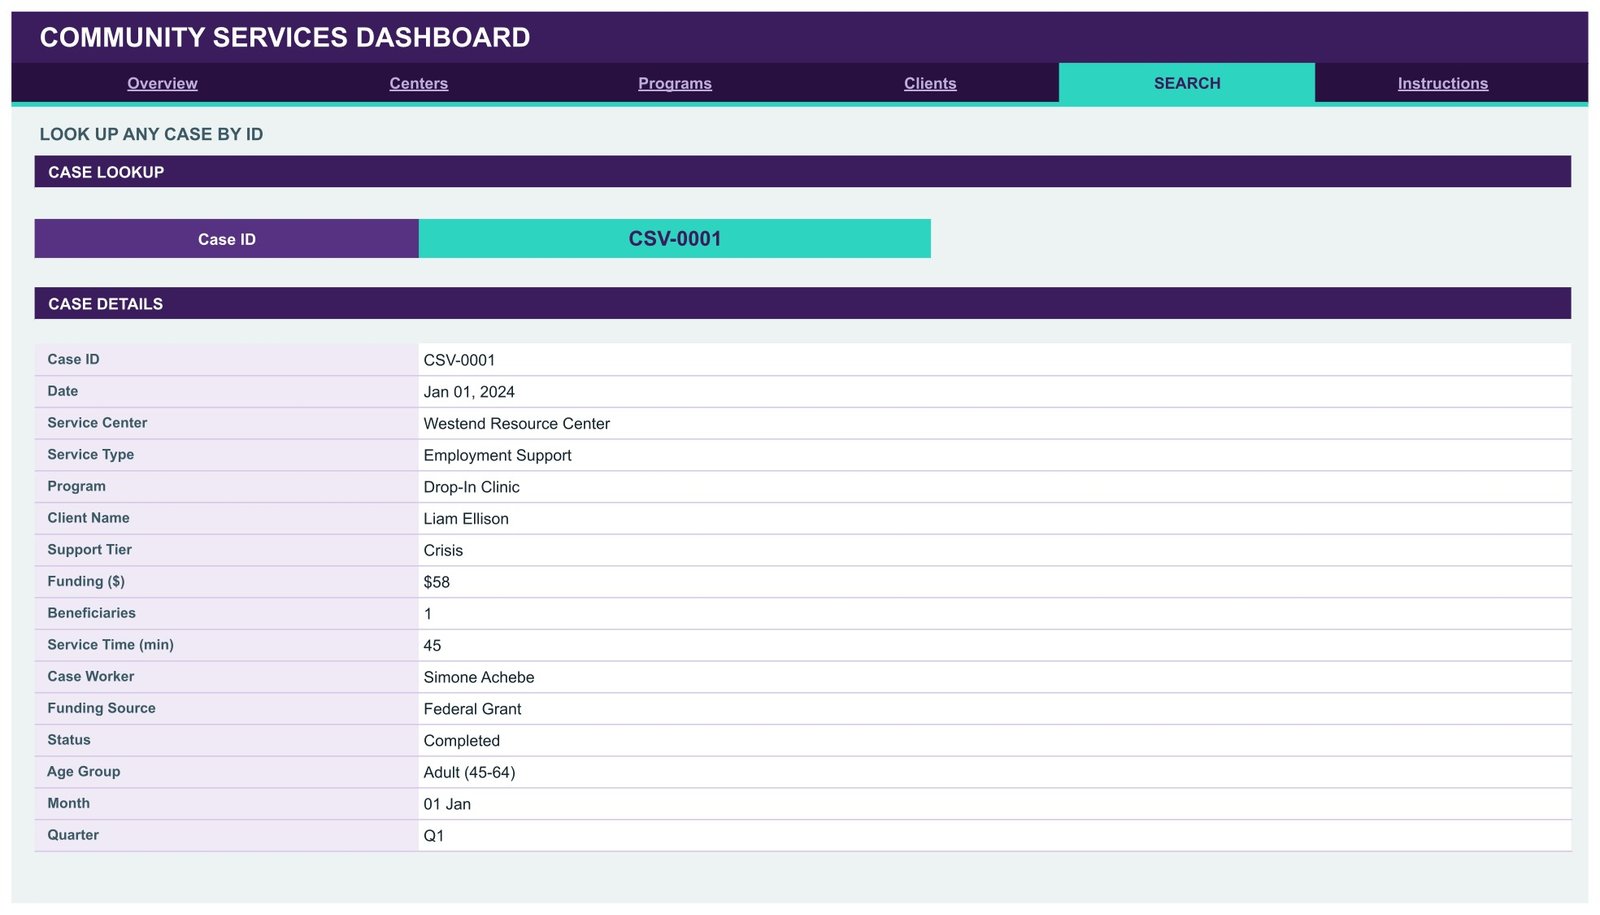
- 🔍 Case ID lookup page. Pick any Case ID and the Search tab returns the full 16-field record: date, service centre, service type, program, client name, support tier, funding, beneficiaries, service time, case worker, funding source, status, age group, month and quarter.
- 📈 Case-worker and program accountability. Funding by Case Worker ranks 10 workers, Funding by Program ranks 8 programs, and the Top 5 Case Workers by Funding panel follows the slicers.
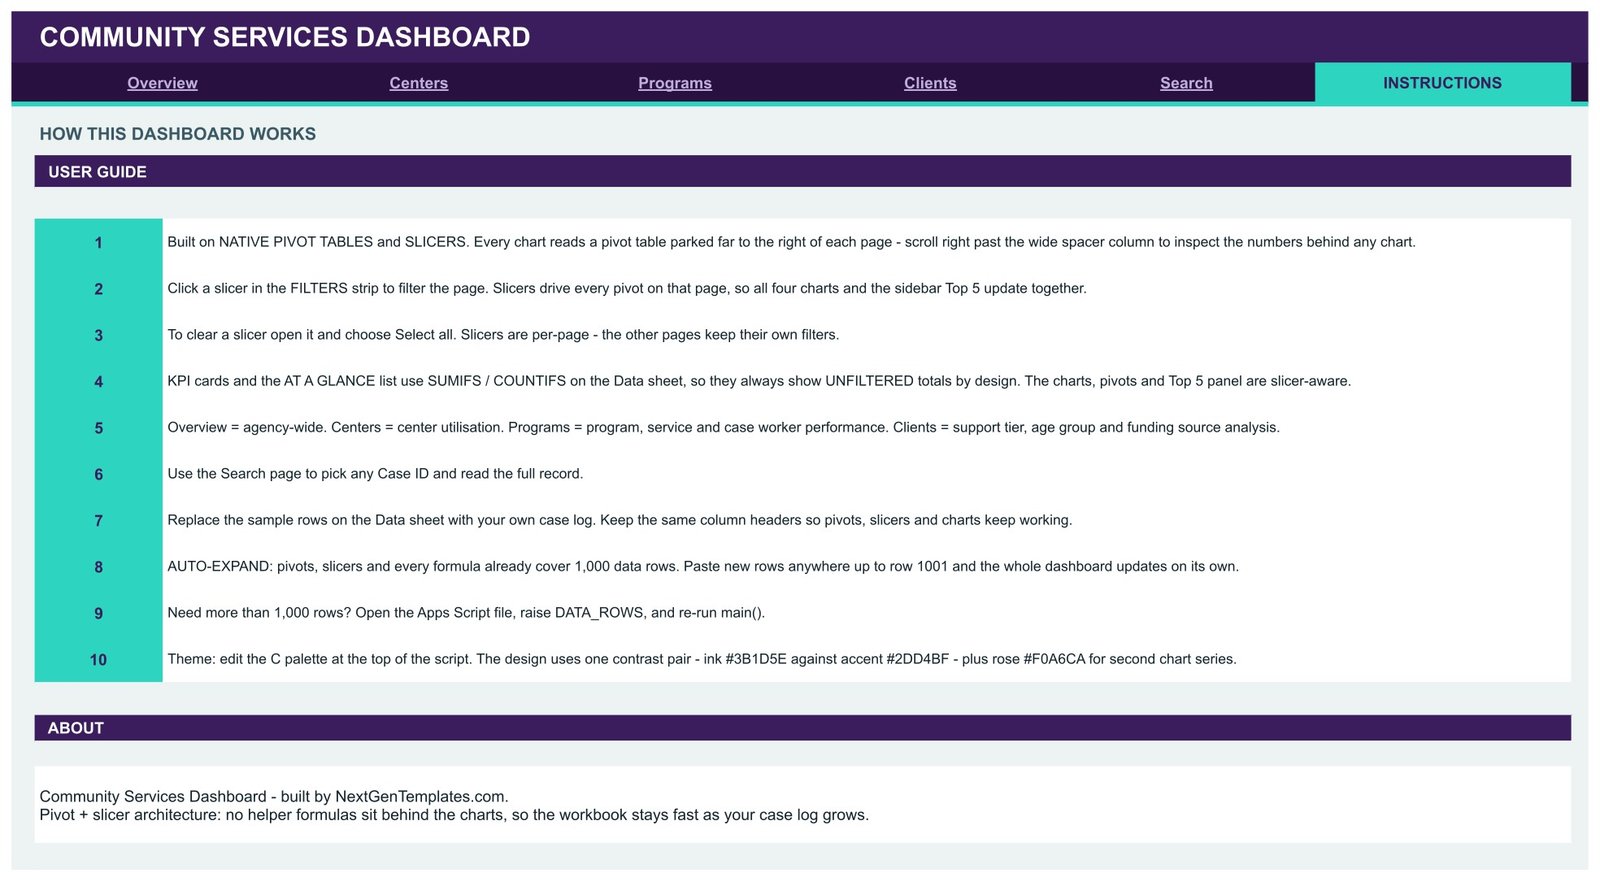
- 🧾 Built-in Instructions tab. A 10-step user guide covering slicers, the auto-expand range, the theme palette and how to raise the 1,000-row limit.
- 🎨 One-line theme change. The colour scheme is a single palette block: ink #3B1D5E, accent #2DD4BF and rose #F0A6CA for the second chart series.
📦 What’s Inside the Community Services Dashboard
Six tabs, linked by a navigation bar that repeats at the top of every page, plus the Data sheet behind them.
Page 1: Overview – Agency-Wide Performance
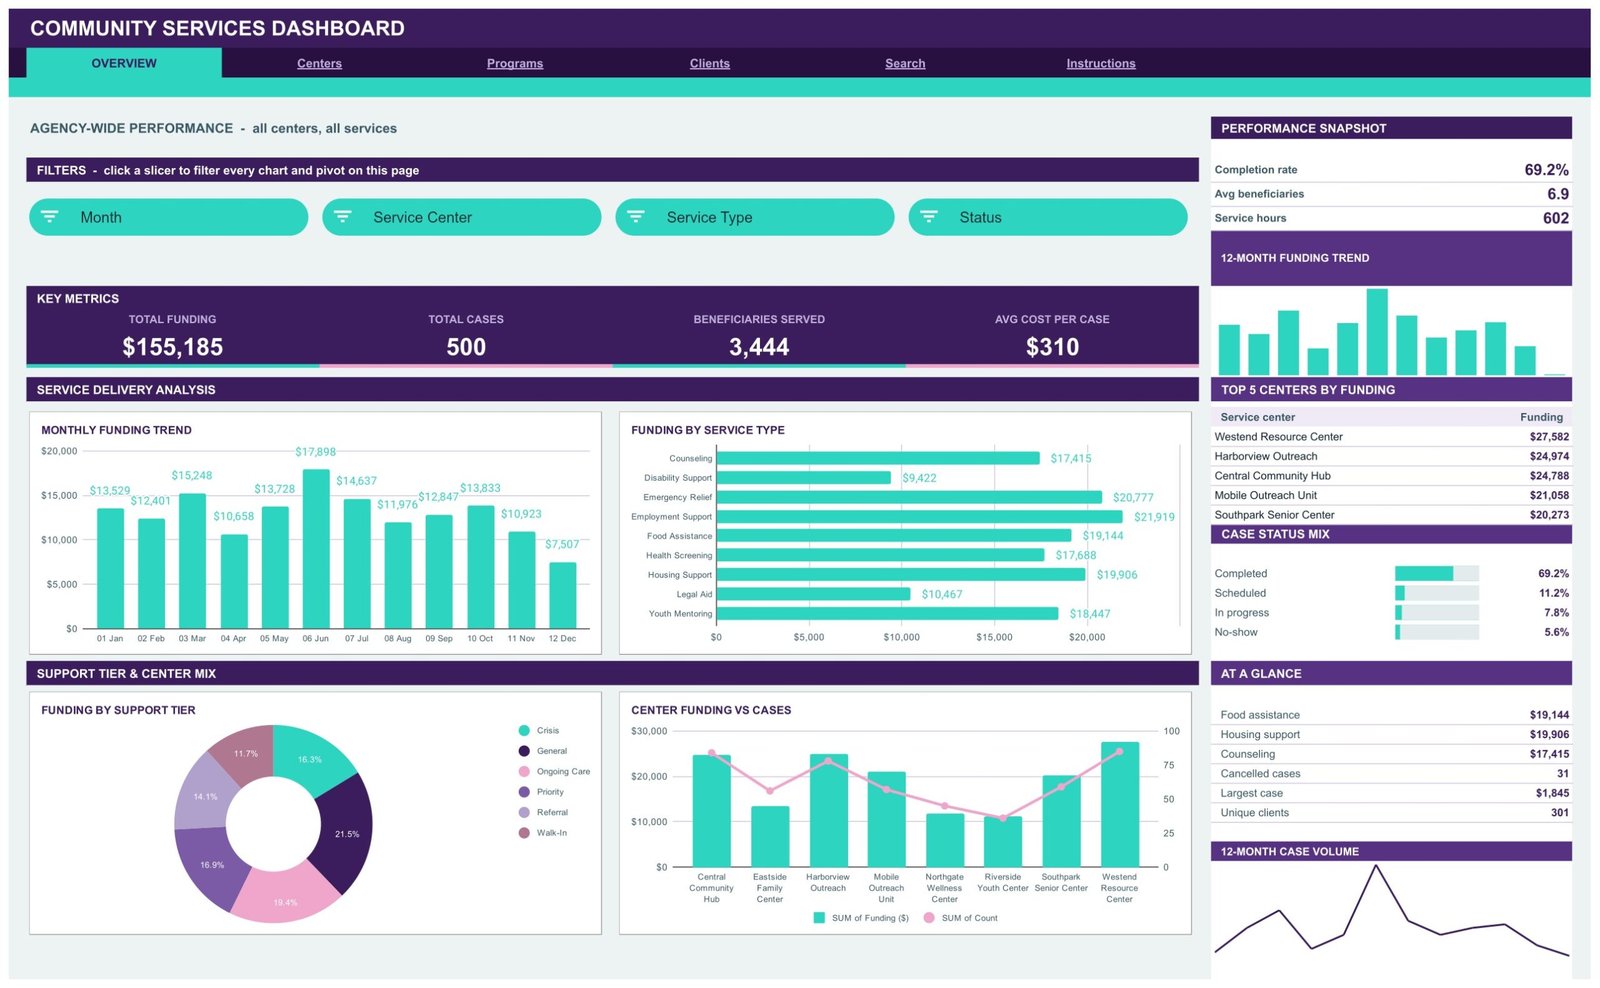
Slicers for Month, Service Center, Service Type and Status sit above four KPI cards: Total Funding $155,185, Total Cases 500, Beneficiaries Served 3,444 and Avg Cost Per Case $310. Charts are Monthly Funding Trend, Funding by Service Type, Funding by Support Tier and Center Funding vs Cases. The sidebar carries a Performance Snapshot (completion rate 69.2%, avg beneficiaries 6.9, service hours 602), a 12-Month Funding Trend, Top 5 Centers by Funding, a Case Status Mix bar list and an At a Glance summary.
Page 2: Centers – Utilisation by Service Centre
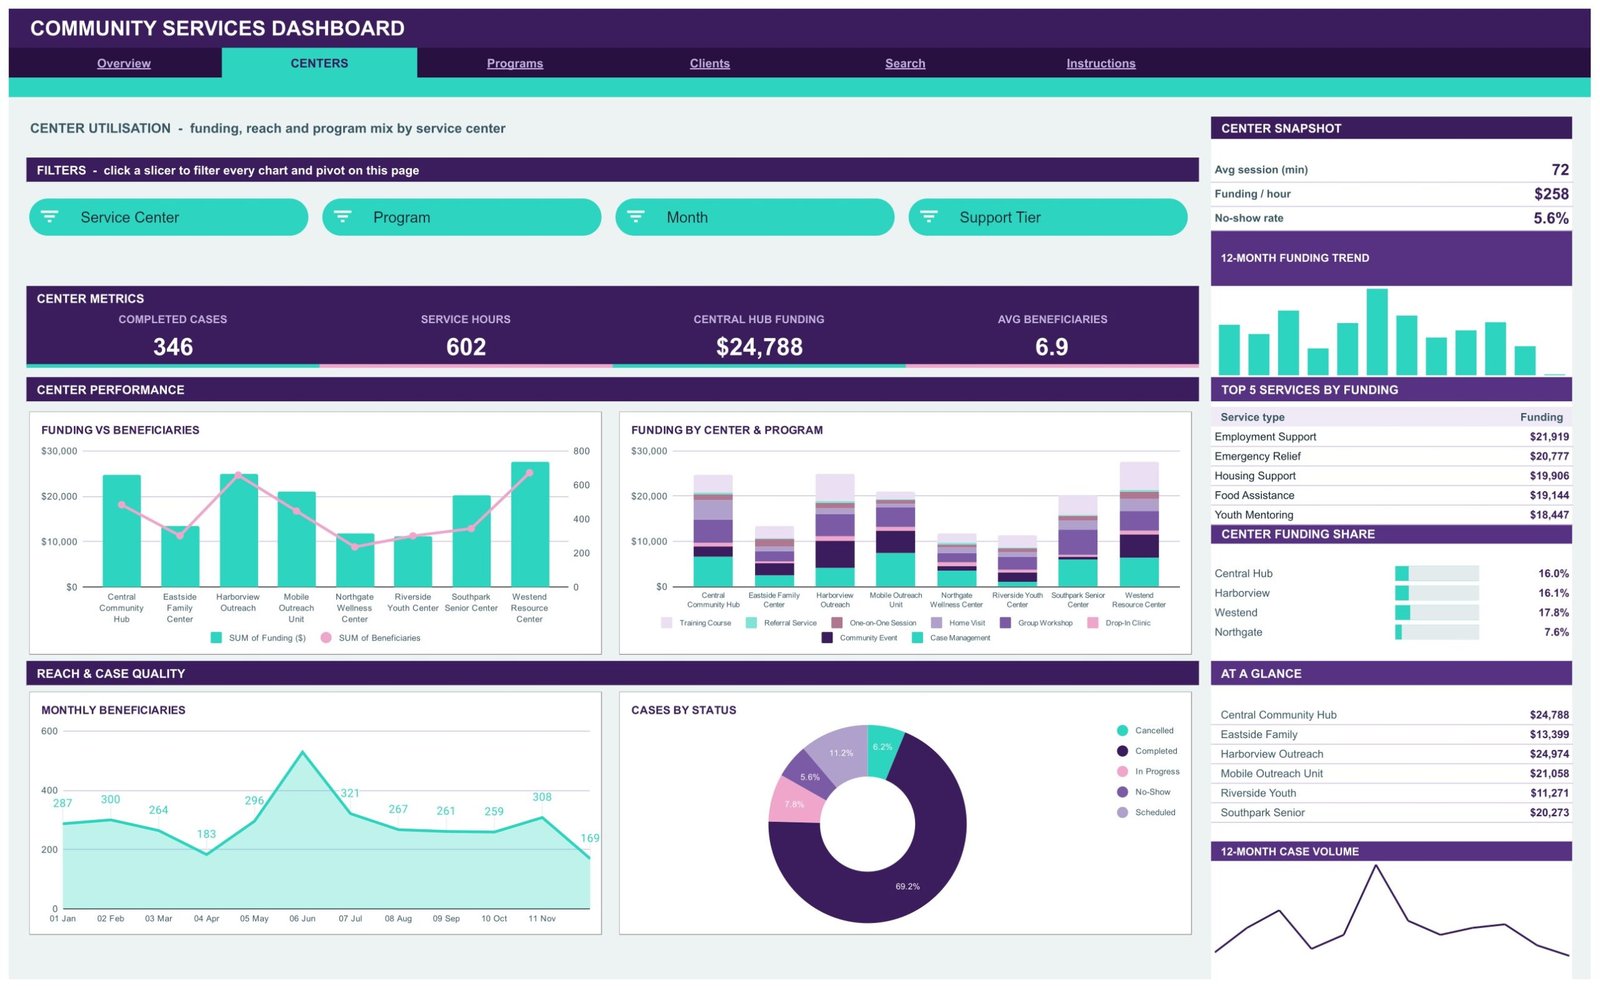
Slicers for Service Center, Program, Month and Support Tier drive KPI cards for Completed Cases 346, Service Hours 602, Central Hub Funding $24,788 and Avg Beneficiaries 6.9. Charts are Funding vs Beneficiaries, Funding by Center and Program, Monthly Beneficiaries and Cases by Status. The sidebar shows a Center Snapshot (avg session 72 minutes, funding per hour $258, no-show rate 5.6%), Top 5 Services by Funding and a Center Funding Share list.
Page 3: Programs – Program, Service and Case Worker Performance
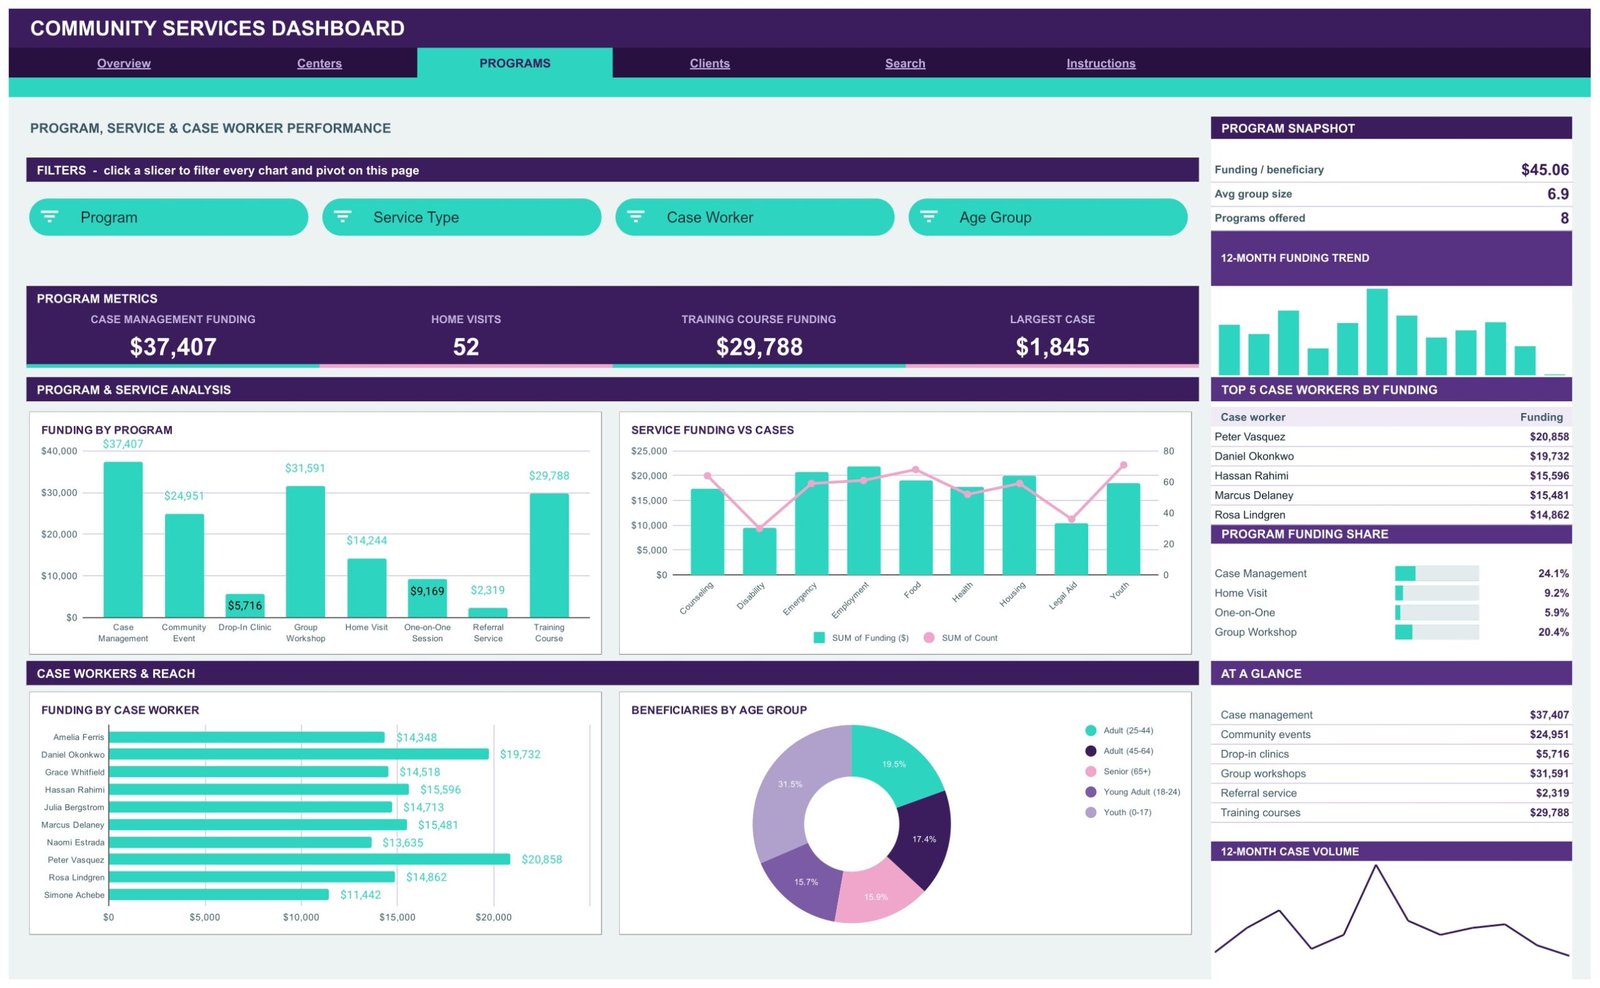
Slicers for Program, Service Type, Case Worker and Age Group sit above Case Management Funding $37,407, Home Visits 52, Training Course Funding $29,788 and Largest Case $1,845. Charts are Funding by Program, Service Funding vs Cases, Funding by Case Worker and Beneficiaries by Age Group. The sidebar adds a Program Snapshot (funding per beneficiary $45.06, avg group size 6.9, 8 programs offered), Top 5 Case Workers by Funding and a Program Funding Share list.
Page 4: Clients – Support Tiers, Age Groups and Funding Sources
Slicers for Support Tier, Age Group, Funding Source and Month drive Crisis Case Funding $25,264, Priority Cases 69, Unique Clients 301 and No-Show Rate 5.6%. Charts are Cases by Support Tier, Age Group Funding vs Beneficiaries, Funding by Source and Monthly Case Volume. The sidebar carries a Client Snapshot (funding per client $516, cases per client 1.7, grant funded 46.0%), Top 5 Tiers by Funding and a Tier Funding Share list.
Page 5: Search – Look Up Any Case by ID
Choose a Case ID from the dropdown and the Case Details panel returns every field for that record, including service centre, service type, program, client name, support tier, funding, beneficiaries, service time in minutes, case worker, funding source, status, age group, month and quarter.
Page 6: Instructions – How the Dashboard Works
A 10-step user guide explaining the pivot and slicer architecture, how to clear a slicer, why KPI cards use SUMIFS and stay unfiltered by design, how the auto-expand range covers 1,000 rows, and how to raise DATA_ROWS if you need more.
📊 Community Services Dashboard in Google Sheets vs. Microsoft Excel Dashboard vs. Paid Case Management SaaS – Where This Fits
| Feature | Community Services Dashboard in Google Sheets | Microsoft Excel Dashboard | Bonterra / CaseWorthy / Apricot |
|---|---|---|---|
| Cost | $9.99 one-time | $18-30 one-time | $100-400 per user / month |
| Platform | Any browser, no install | Desktop Excel required | Vendor cloud only |
| Setup time | Under 10 minutes ✅ | 15-30 minutes | 4-12 week implementation |
| Real-time team collaboration | Yes, native ✅ | Only via OneDrive co-authoring | Yes ✅ |
| Mobile access | Google Sheets app ✅ | Limited on mobile Excel | Dedicated app ✅ |
| Customisable fields and charts | Fully editable ✅ | Fully editable ✅ | Admin-gated, often paid |
| Share with a link | Yes ✅ | File attachment | Named seats only |
| Year-1 cost at 5 users | $9.99 total ✅ | $18-30 total | $6,000-24,000 |
| Case-level record lookup | Built-in Search tab ✅ | Usually manual filtering | Yes ✅ |
For small agencies and nonprofits that want funding, case and beneficiary reporting without a five-figure case management contract, the Community Services Dashboard in Google Sheets sits in the sweet spot.
👥 Who This Template Is For – and Who It’s Not For
✅ This template is built for:
- Program managers at community centres and nonprofits running 2-15 service sites
- Grant coordinators who report funding by source, program and quarter to funders
- Social services and outreach teams tracking cases, beneficiaries and no-show rates
- Volunteer-run organisations that need reporting without an IT budget or an admin seat
❌ This template is NOT for:
- Agencies handling protected health or identifiable client records that require HIPAA-grade, audit-logged storage
- Teams needing intake forms, referrals workflow and automated eligibility checks – that is a case management system, not a dashboard
- Case logs beyond roughly 20,000 rows, where a database-backed tool is the better fit
⚙️ How to Use the Community Services Dashboard
- Open the PDF in your download and click the Google Sheets copy link to create your own editable copy in Google Drive.
- Open the Data sheet and replace the 500 sample case rows with your own case log, keeping every column header exactly as it is.
- Update the dimension values you use – service centres, programs, service types, support tiers, funding sources and age groups.
- Return to the Overview tab. Every KPI card, chart and Top 5 panel has already recalculated.
- Click a slicer in the FILTERS strip to filter that page. Open the slicer and choose Select all to clear it.
- Use the Search tab to pull the full record for any Case ID when a funder or supervisor asks about a specific case.
- Need more than 1,000 rows? Open the Apps Script file, raise DATA_ROWS and run main() again.
💼 Real-World Use Cases
Marta coordinates four neighbourhood centres for a city-funded outreach charity. She uses the Centers page to compare funding against beneficiaries per site, spots that Northgate Wellness Center is delivering the fewest beneficiaries per dollar, and reallocates two drop-in clinic slots before the next quarter closes.
Devon writes quarterly grant reports for a family services nonprofit. The Clients page gives him the funding-source split in one screenshot – 46% grant funded, with federal and state grants covering just over half of all spend – so he stops rebuilding the same pivot table every reporting cycle.
Priya supervises ten case workers across an employment support program. She filters the Programs page by Case Worker, checks Funding by Case Worker and the Top 5 panel before one-to-ones, and uses the 5.6% no-show rate as the standing agenda item in her monthly team meeting.
❓ Frequently Asked Questions
What KPIs does the Community Services Dashboard in Google Sheets track?
The Community Services Dashboard tracks 16 KPIs across four pages, including total funding, total cases, beneficiaries served, average cost per case, completed cases, service hours, funding per beneficiary, unique clients, priority cases and no-show rate. All of them update when you replace the sample data.
How long does setup take?
Under 10 minutes. Click the copy link in the PDF, paste your case log onto the Data sheet keeping the existing headers, and the Community Services Dashboard recalculates every chart, KPI card and Top 5 panel automatically. No formula editing is required.
How many case records can it hold?
Pivots, slicers and formulas in the Community Services Dashboard already cover 1,000 data rows out of the box. To go further, open the bundled Apps Script file, raise the DATA_ROWS value and re-run main() to rebuild the ranges.
How does this compare to paid case management software?
Platforms like Bonterra, CaseWorthy and Apricot run $100-400 per user per month with a multi-week implementation. The Community Services Dashboard in Google Sheets is a one-time purchase that reports on the same funding, case and beneficiary metrics, but it is a reporting layer rather than an intake and workflow system.
Can my whole team use it at once?
Yes. Because the Community Services Dashboard runs in Google Sheets, you share it with a link and colleagues view or edit in real time. There are no per-user fees, no seat limits and nothing to install – only a browser.
Can I change the colours to match our branding?
Yes. The Community Services Dashboard uses one palette block at the top of its Apps Script file – ink #3B1D5E, accent #2DD4BF and rose #F0A6CA. Edit those three values and every header, KPI card and chart series recolours together.
👤 About the Author
Built by PK – Microsoft Certified Professional with 15+ years of Excel, Google Sheets, and Power BI experience. Founder of NextGenTemplates, reaching 300K+ subscribers across YouTube channels (@PK-AnExcelExpert, @NextGenTemplates, @NeoTechNavigators). Every template is hand-built and tested before release.
🔗 Explore Related Templates
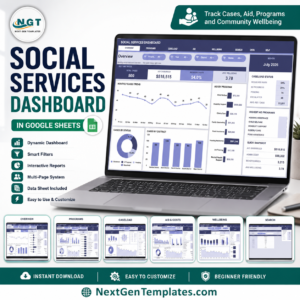
If you report on the wider social sector, the Social Services Dashboard in Google Sheets covers caseloads and outcomes at agency level, while the Nonprofit Fundraising Dashboard in Google Sheets handles the income side – campaigns, donors and pledges. For a lighter one-page summary, the Social Services KPI Scorecard in Google Sheets fits on a single screen.
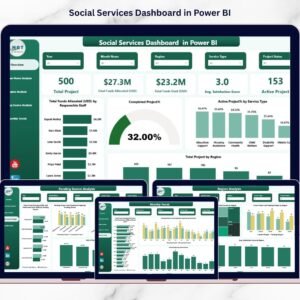
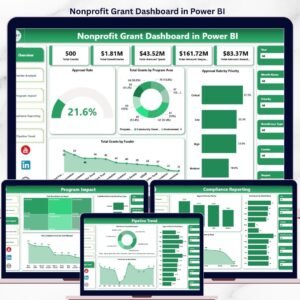
Also available as: Social Services Dashboard in Power BI and the Nonprofit Grant Dashboard in Power BI for teams already on Microsoft Fabric. Browse the full Google Sheets Dashboards collection or the wider Dashboard Templates category for more.
📖 Click here to read the Detailed Blog Post<
Watch the step-by-step video Demo:
🎥 Visit our YouTube channel for step-by-step video tutorials
👉 YouTube.com/@NextGenTemplates
📅 Last updated: August 2026






























Reviews
There are no reviews yet.