

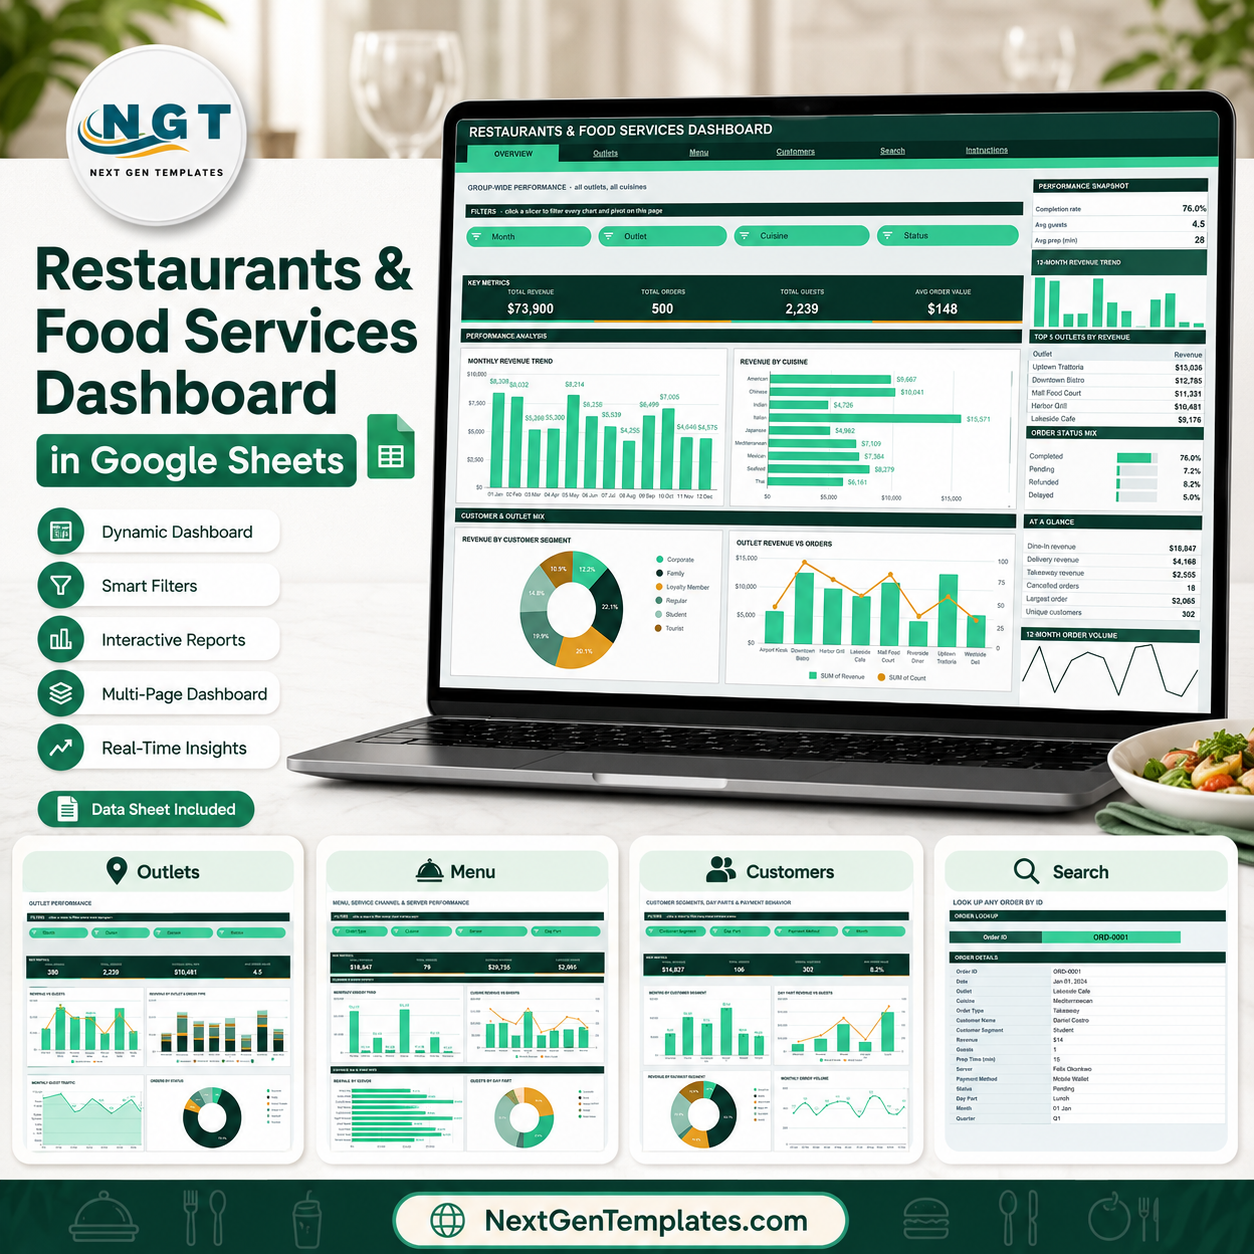
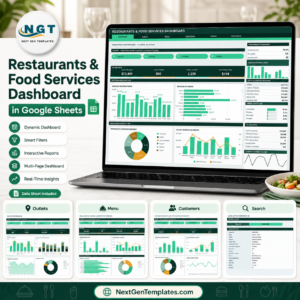
The Restaurants and Food Services Dashboard in Google Sheets tracks 16 KPIs across 4 interactive pages, driven by 24 native pivot tables, 16 charts and 16 slicers. It ships with 500 sample orders and auto-expands to 1,000 rows. Setup takes under 10 minutes — replace the sample data and every chart, KPI and pivot updates on its own.
🌍 Join 8,400+ teams in 40+ countries using NextGenTemplates to replace paid SaaS tools with one-time-purchase Excel, Google Sheets, Power BI, and HTML templates.
✅ Instant download · One-time payment · No subscription · No per-user fees · Lifetime access
🔑 Key Features of the Restaurants and Food Services Dashboard
🍽️ Built on native pivot tables and slicers. Every chart reads a real Google Sheets pivot table parked off-screen to the right of each page. There are no SUMPRODUCT or QUERY chains behind the visuals, so the workbook stays fast as your order log grows past a thousand rows.
📊 Four slicers on every analysis page. Month, Outlet, Cuisine, Order Type, Server, Day Part, Payment Method and Status are all filterable. Click one slicer and all four charts, both sidebar sparklines and the Top 5 panel on that page update together.
💵 Sixteen KPI cards across the four pages. The dashboard reports Total Revenue, Total Orders, Total Guests, Average Order Value, Completed Orders, Dine-In Revenue, Catering Revenue, Largest Order, Loyalty Revenue, Family Orders, Unique Customers and Refund Rate, among others.
🏪 Multi-outlet by design. Compare 8 outlets, 9 cuisines, 8 order types, 6 customer segments and 5 day parts side by side — the structure a single-location spreadsheet cannot give you. Explore more Google Sheets Dashboards if you need a different domain.
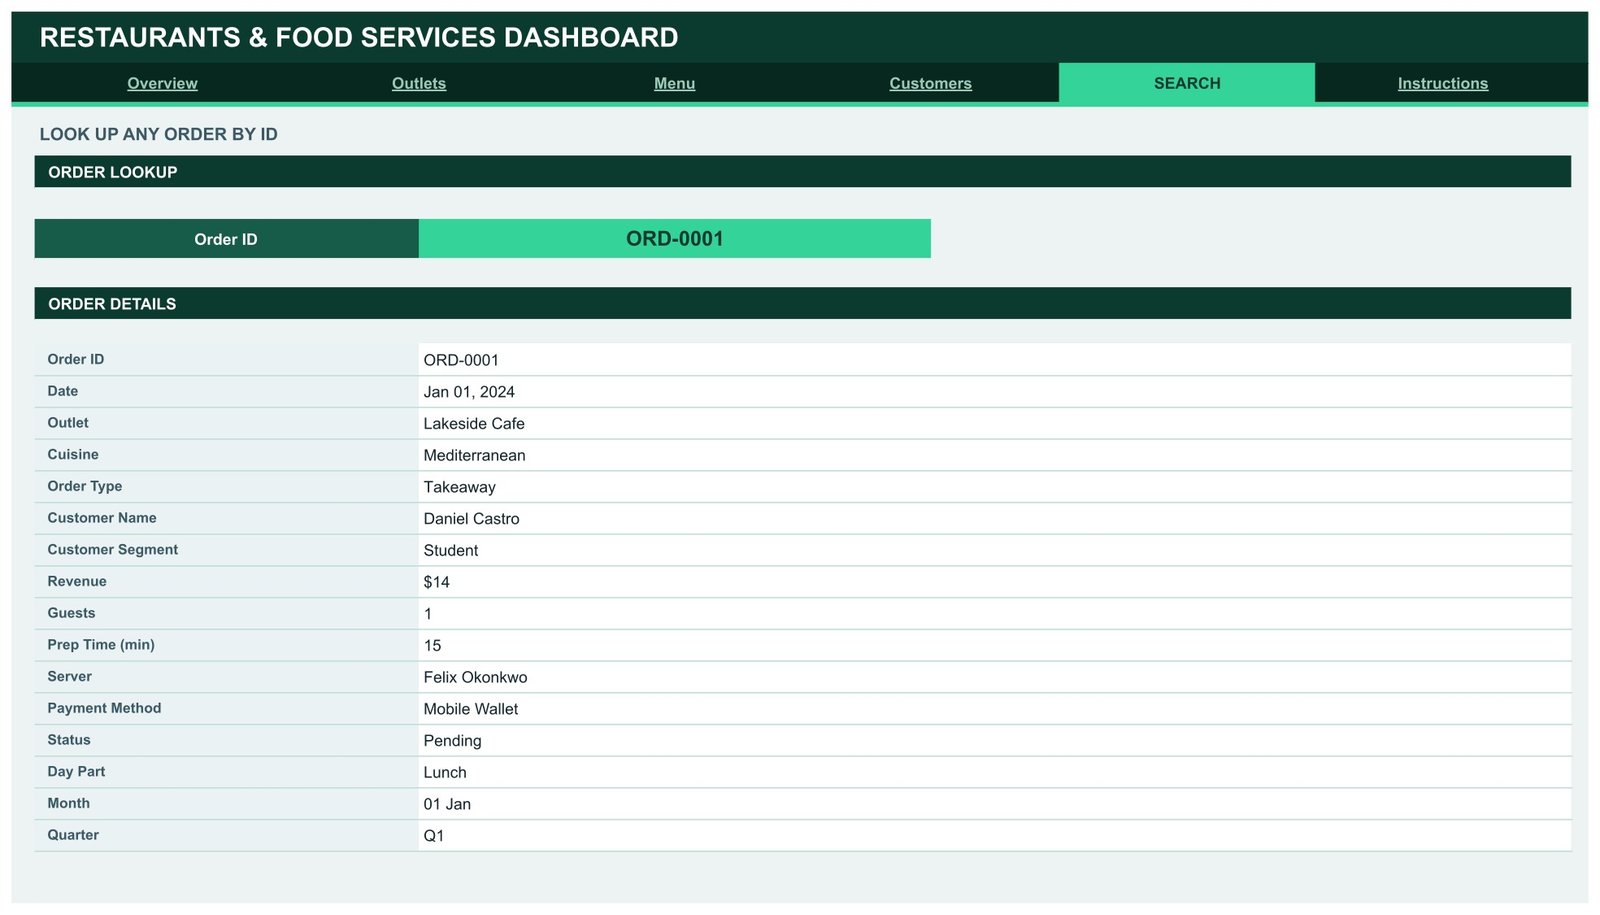
🔎 Order-level lookup. The Search page resolves any Order ID to all 16 fields of that record — outlet, cuisine, server, guests, prep time, payment method and status included.
📦 What’s Inside the Restaurants and Food Services Dashboard
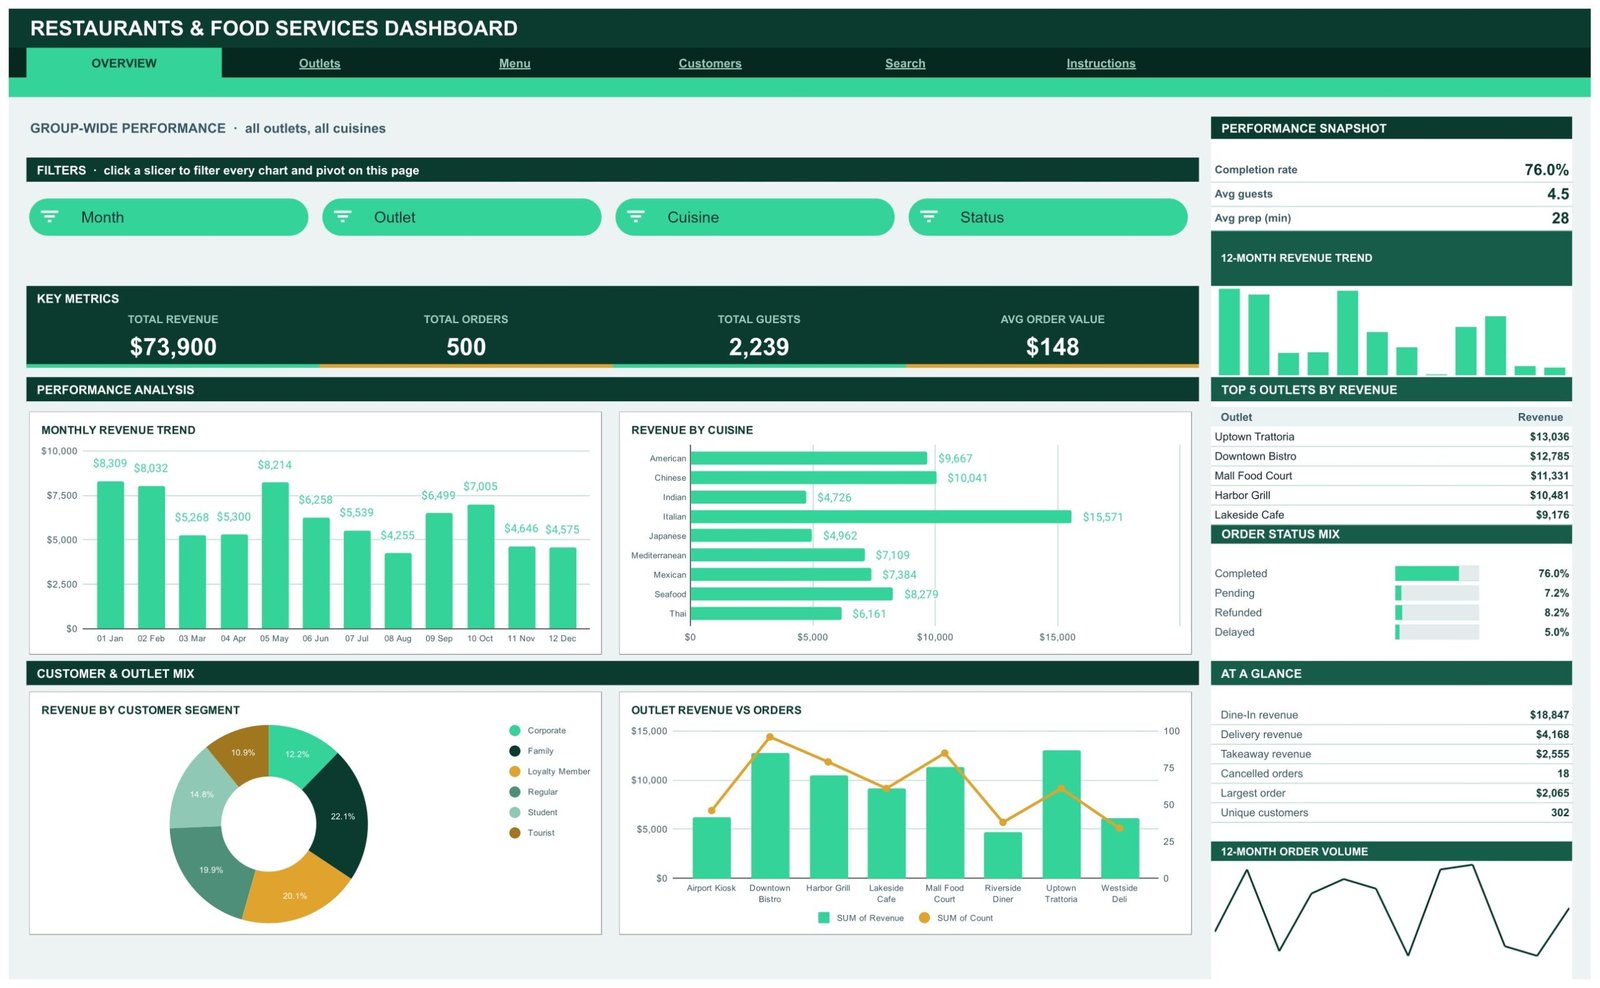
Page 1: Overview
The group-wide picture across every outlet and cuisine. Cards show Total Revenue, Total Orders, Total Guests and Average Order Value, and charts include Revenue by Month, Revenue by Cuisine, Revenue by Customer Segment, and Revenue and Orders by Outlet. The sidebar adds completion rate, average guests per order, average prep time, the Top 5 outlets and the full order status mix.
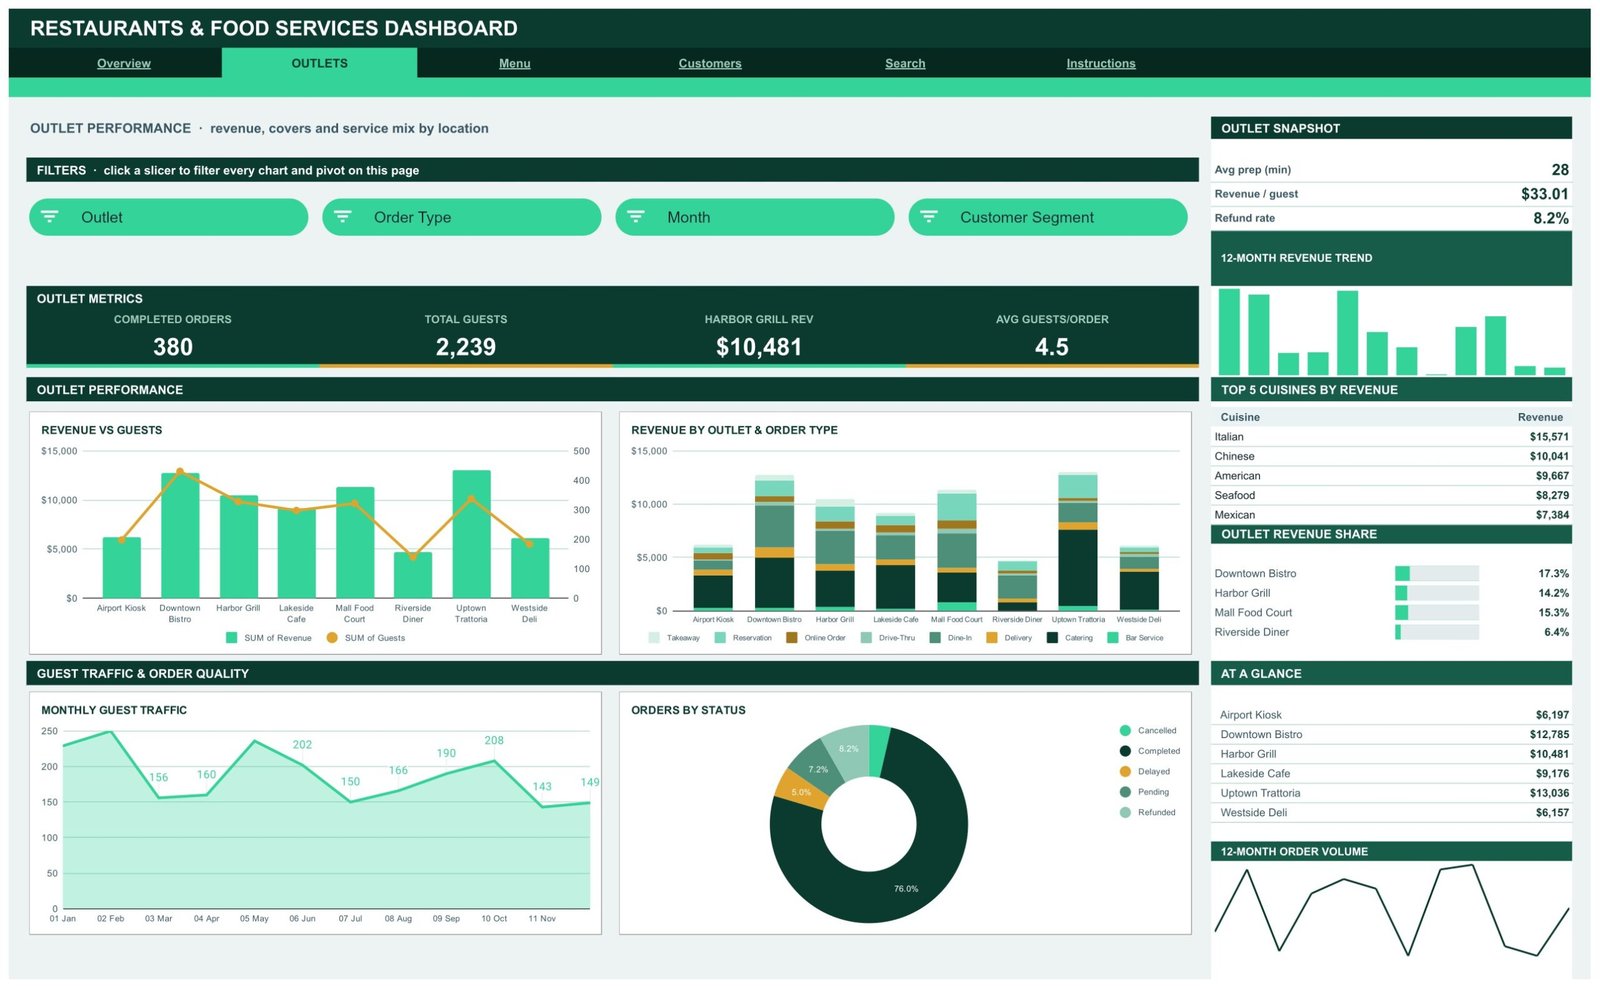
Page 2: Outlets
Location performance — revenue, covers and service mix by site. Cards show Completed Orders, Total Guests, a named outlet’s revenue and Average Guests per Order. Charts include Revenue and Guests by Outlet, Revenue by Outlet and Order Type, Guests by Month, and Orders by Status.
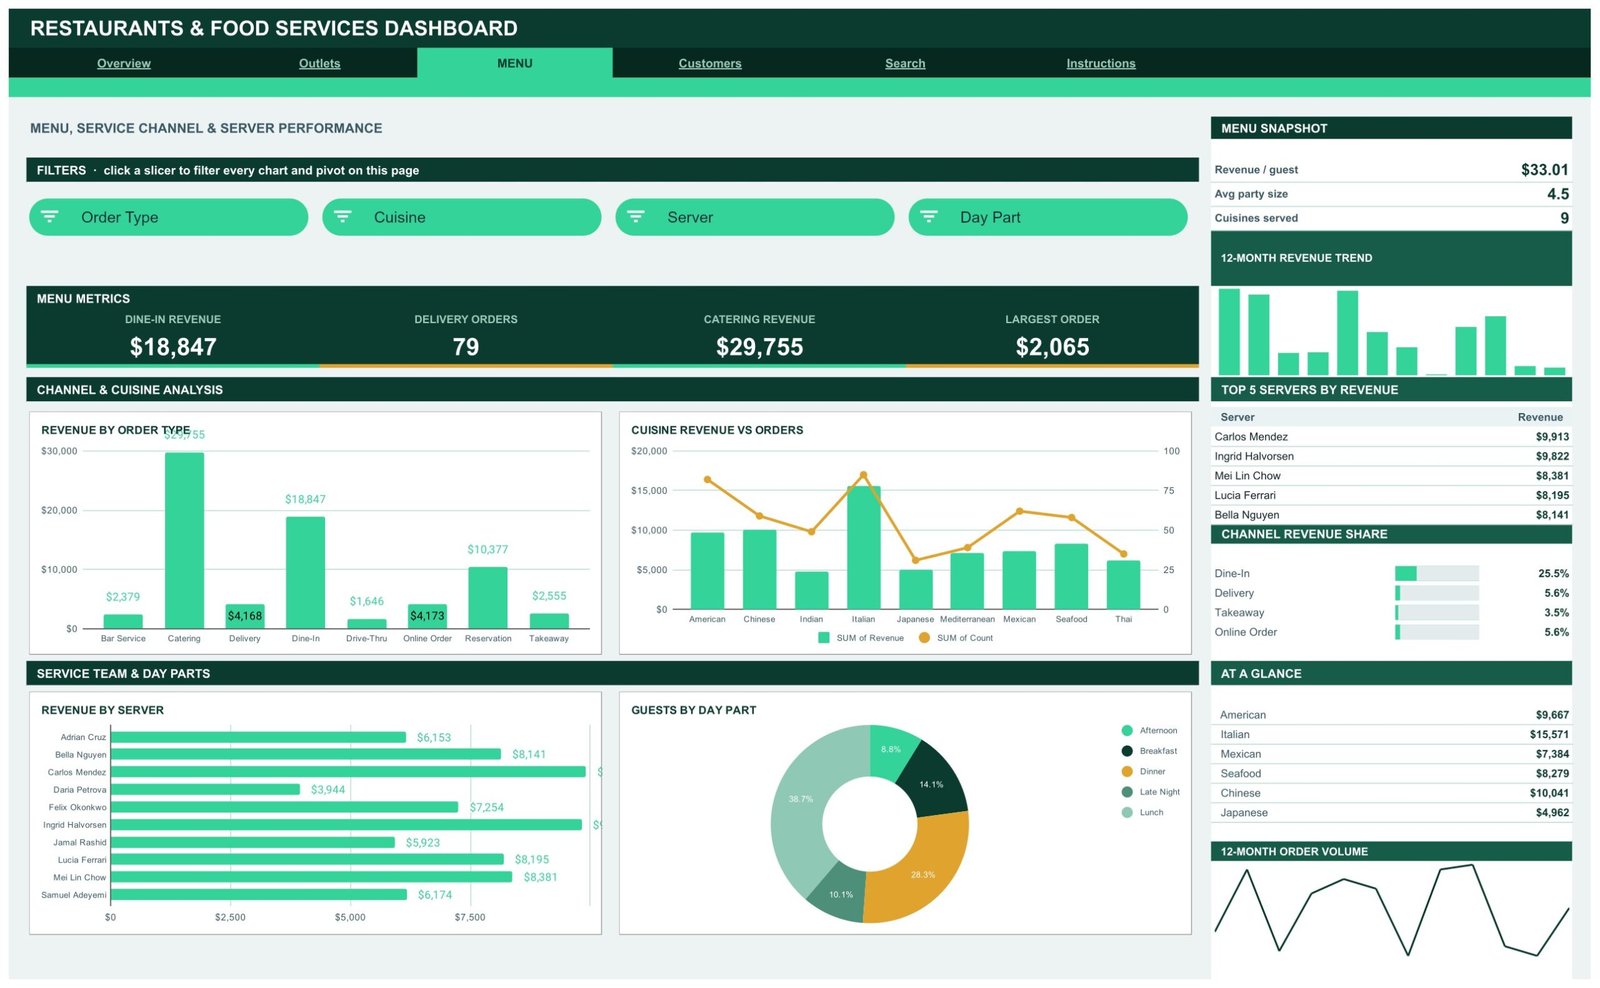
Page 3: Menu
Service channels, cuisines and the service team. Cards show Dine-In Revenue, Delivery Orders, Catering Revenue and Largest Order. Charts include Revenue by Order Type, Revenue and Orders by Cuisine, Revenue by Server, and Guests by Day Part.
Page 4: Customers
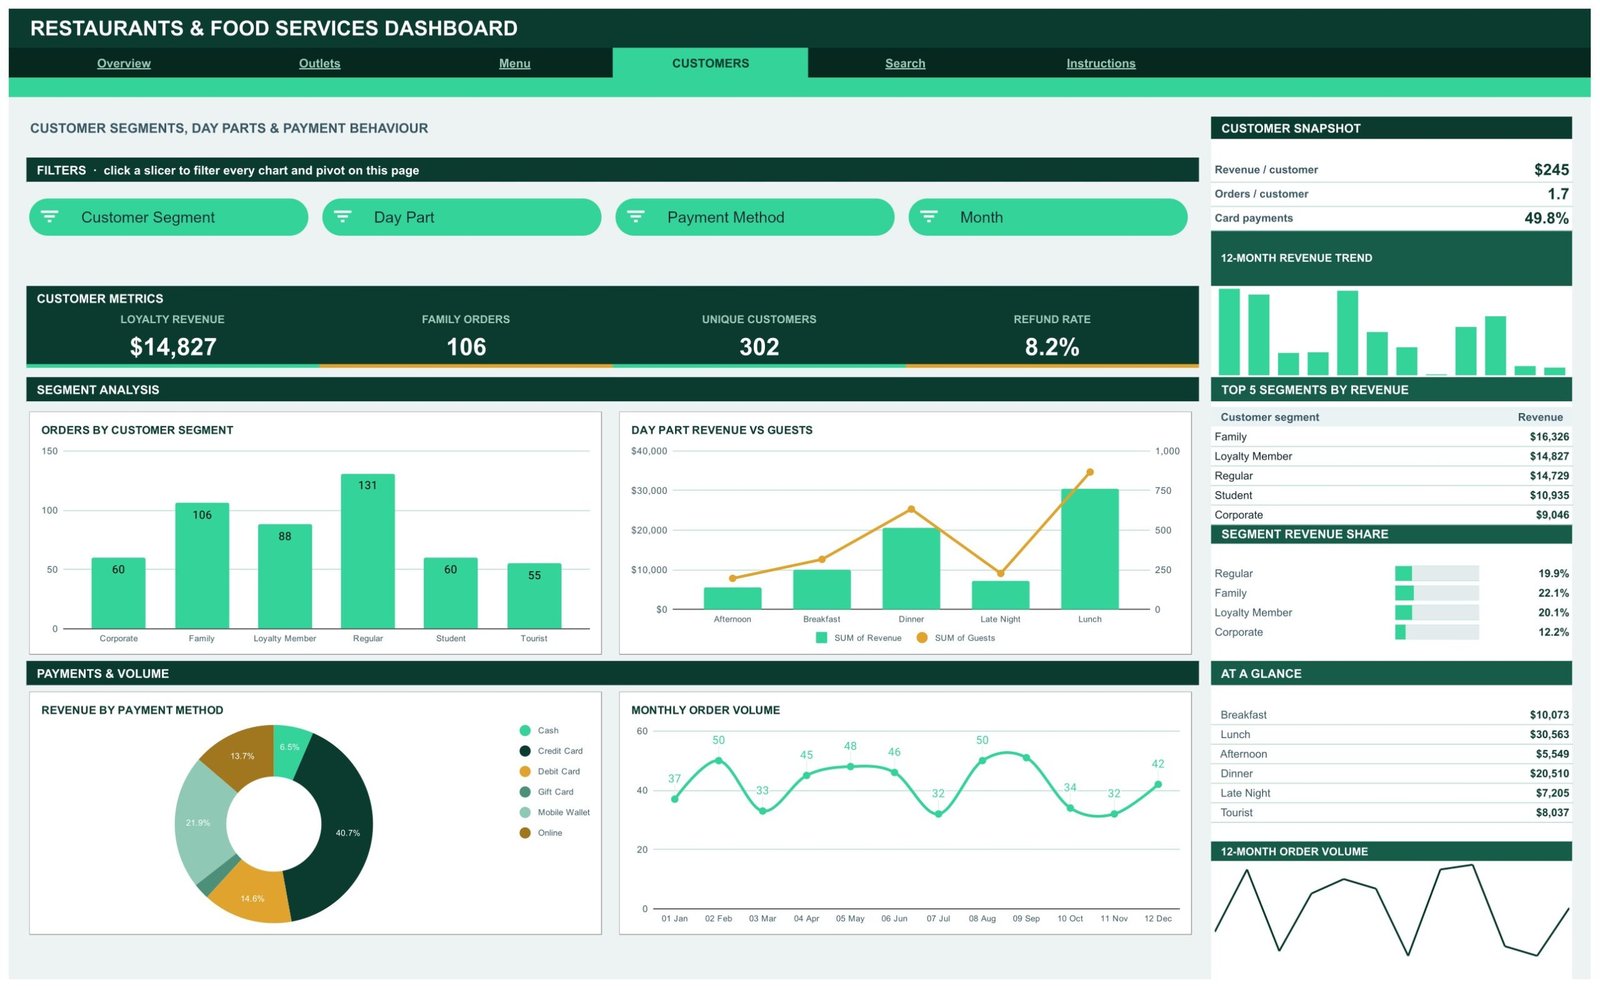
Who is actually buying, and how they pay. Cards show Loyalty Revenue, Family Orders, Unique Customers and Refund Rate. Charts include Orders by Customer Segment, Revenue and Guests by Day Part, Revenue by Payment Method, and Orders by Month.
Page 5: Search Sheet
Pick any Order ID from the dropdown and the complete record appears below it — date, outlet, cuisine, order type, customer name and segment, revenue, guests, prep time, server, payment method, status, day part, month and quarter.
Page 6: Instructions
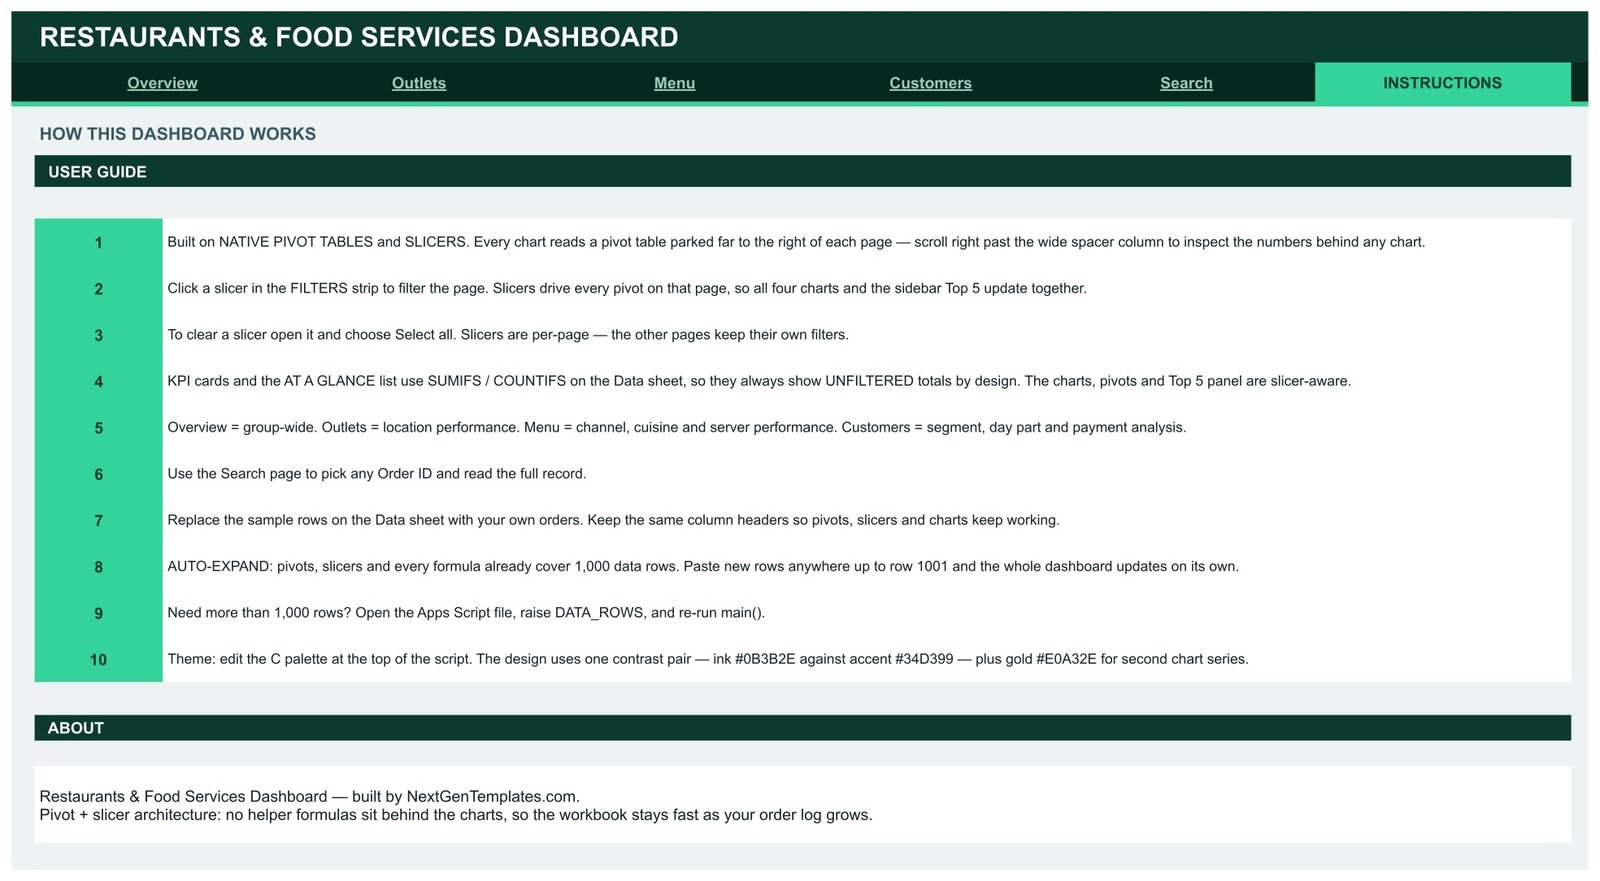
A built-in ten-point user guide covering how the pivots and slicers work, how to clear a filter, which page covers which analysis, how to replace the sample data, and how the dashboard expands as you add rows.
Data Sheet
One flat table of 18 columns — Order ID, Date, Outlet, Cuisine, Order Type, Customer Name, Customer Segment, Revenue, Guests, Prep Time, Server, Payment Method, Status, Day Part, Month, Year, Quarter and Count. Replace the 500 sample rows with your own; formulas and pivots already cover 1,000.
📊 Restaurants Dashboard vs. Microsoft Excel vs. Paid Restaurant SaaS — Where This Fits
| Feature | Restaurants and Food Services Dashboard | Excel Dashboard equivalent | Toast / Lightspeed Analytics |
|---|---|---|---|
| Cost | $9.99 one-time ✅ | $10-20 one-time | $69-165 / location / month |
| Platform | Google Sheets, any browser ✅ | Desktop Excel | Vendor cloud + POS lock-in |
| Setup time | Under 10 minutes ✅ | Under 10 minutes | Days — POS migration required |
| Real-time team collaboration | Yes, native ✅ | Only via OneDrive | Yes ✅ |
| Mobile access | Yes, Sheets app ✅ | Limited | Yes ✅ |
| Customizable fields | Fully — it’s your sheet ✅ | Fully ✅ | Vendor-defined only |
| Share with link | Yes ✅ | File attachment | Paid seat required |
| Multi-outlet comparison | Built in — 8 outlets ✅ | Built in ✅ | Higher tier only |
| Year-1 cost at 5 users | $9.99 ✅ | $10-20 | $4,140-9,900 |
For restaurant groups that want multi-outlet reporting without a POS migration or a per-location subscription, the Restaurants and Food Services Dashboard sits in the sweet spot.
👥 Who This Template Is For — and Who It’s Not For
✅ This template is built for:
- Owners and managers running 1-10 restaurant outlets, cafes, or cloud kitchens
- Catering and food-service operators who need revenue and cover analysis without a POS reporting add-on
- Restaurant consultants and accountants preparing monthly performance reviews for clients
- Franchise managers comparing outlets, cuisines and service channels side by side
❌ This template is NOT for:
- Teams wanting a live POS feed — this reads a sheet you paste or import into, not your till in real time
- Chains over ~50 outlets, where the 1,000-row window and per-page slicers get cramped
- Anyone needing stock-level inventory or recipe costing — this is a sales and guest analytics dashboard
⚙️ How to Use the Restaurants and Food Services Dashboard
- Sign in to Google in your browser, then open the link inside the downloaded PDF.
- Choose File > Make a copy to save a fully editable version to your own Google Drive.
- Open the Data tab and replace the 500 sample orders with your own, keeping the column headers unchanged.
- Return to the Overview page — every KPI, chart and pivot has already updated.
- Click any slicer to filter that page by month, outlet, cuisine, order type, server, day part, payment method or status.
- Use the Search page to pull up a single order by its Order ID.
💼 Real-World Use Cases
Maya runs three bistros in the same city. Every Monday she pastes the week’s orders into the Data tab and opens the Outlets page to see which site pulled the most covers, then uses the stacked revenue chart to check whether delivery is quietly eating into her dine-in margin.
Daniel manages a catering arm attached to a hotel restaurant. He filters the Menu page to Catering only and reads Catering Revenue and Largest Order straight off the KPI band before quoting his next event — no POS report request, no waiting on head office.
Priya consults for a small restaurant group. She keeps one copy of the dashboard per client, uses the Customers page to show which segments and day parts drive revenue, and shares a view-only link so owners can explore the numbers themselves.
❓ Frequently Asked Questions
What KPIs does the Restaurants and Food Services Dashboard track?
The Restaurants and Food Services Dashboard tracks 16 KPIs including Total Revenue, Total Orders, Total Guests, Average Order Value, Completed Orders, Dine-In Revenue, Catering Revenue, Largest Order, Loyalty Revenue, Unique Customers and Refund Rate. All metrics update automatically when you replace the sample data.
How long does setup take?
Under 10 minutes. Make a copy of the Restaurants and Food Services Dashboard, open the Data tab, and paste your own orders over the 500 sample rows. Keep the 18 column headers unchanged and every pivot, chart and slicer keeps working without any further configuration.
How does this compare to Toast or Lightspeed analytics?
Toast and Lightspeed charge roughly $69-165 per location per month and require their POS. The Restaurants and Food Services Dashboard is a one-time $9.99 purchase that works with any POS export, though it reports on data you paste in rather than streaming live from your till.
Can I use it for more than one outlet?
Yes. The Restaurants and Food Services Dashboard is built around multi-outlet comparison — the Outlets page ranks sites by revenue and guests, and the Outlet slicer appears on the Overview and Outlets pages so you can isolate any single location instantly.
How many orders can it hold?
Every pivot, slicer and formula in the Restaurants and Food Services Dashboard already covers 1,000 order rows. Paste new rows anywhere up to row 1001 and the dashboard updates on its own. For more, raise the DATA_ROWS value in the bundled Apps Script and re-run it.
Do I need Excel or any add-on?
No. The Restaurants and Food Services Dashboard runs entirely in Google Sheets using native pivot tables, slicers and sparklines. There is no add-on, no macro and no paid extension — just a browser and a free Google account.
Is the file editable after purchase?
Yes. The master link opens view-only on purpose so it stays clean for every customer. Choose File > Make a copy and your own version is fully editable — charts, pivot tables, slicers and formulas all come with it.
👤 About the Author
Built by PK — Microsoft Certified Professional with 15+ years of Excel, Google Sheets, and Power BI experience. Founder of NextGenTemplates, reaching 300K+ subscribers across YouTube channels (@PK-AnExcelExpert, @NextGenTemplates, @NeoTechNavigators). Every template is hand-built and tested before release.
🔗 Explore Related Templates
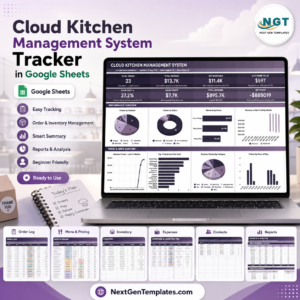
- Cloud Kitchen Management System Tracker in Google Sheets — order-level tracking for delivery-only kitchens.
- Catering Business Management Tracker in Google Sheets — event pipeline and costing for catering operators.
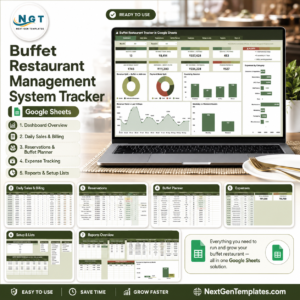
- Buffet Restaurant Management System Tracker in Google Sheets — covers, waste and session tracking for buffet service.
- Restaurant Order Data Entry System in Excel — a form-driven Excel companion for capturing orders.
Browse the full Dashboard Templates catalogue for other departments.
📖 Click here to read the Detailed Blog Post
🎥 Visit our YouTube channel for step-by-step video tutorials
👉 YouTube.com/@NextGenTemplates
Watch the step-by-step video Demo:
📅 Last updated: August 2026































Reviews
There are no reviews yet.