
Running a successful laundromat business means juggling revenue across multiple locations, machine uptime, customer satisfaction, staff costs and service mix — all at once. The Laundromat Dashboard in Excel pulls every one of those moving parts into a single, visual command centre so you can see exactly how your coin-op or card-operated laundry is performing and where the next revenue opportunity is hiding. Whether you run a single neighbourhood store or a multi-location self-service chain, this Excel dashboard template gives you data-driven clarity in minutes instead of hours.
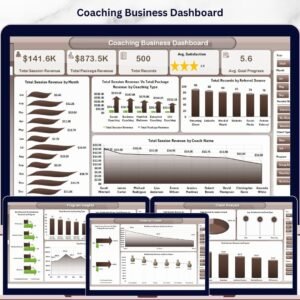
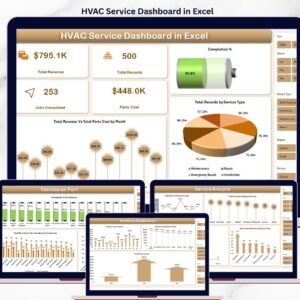
Built on a clean, modern Excel layout powered by pivot tables, this dashboard tracks 5 high-level KPIs, 15+ interactive charts and 5 dedicated analysis pages — from revenue by location to average cycle duration by machine type. It is the perfect companion to our other service-business templates like the HVAC Service Dashboard in Excel and Coaching Business Dashboard in Excel, giving you the same proven structure tailored for laundromat operators.

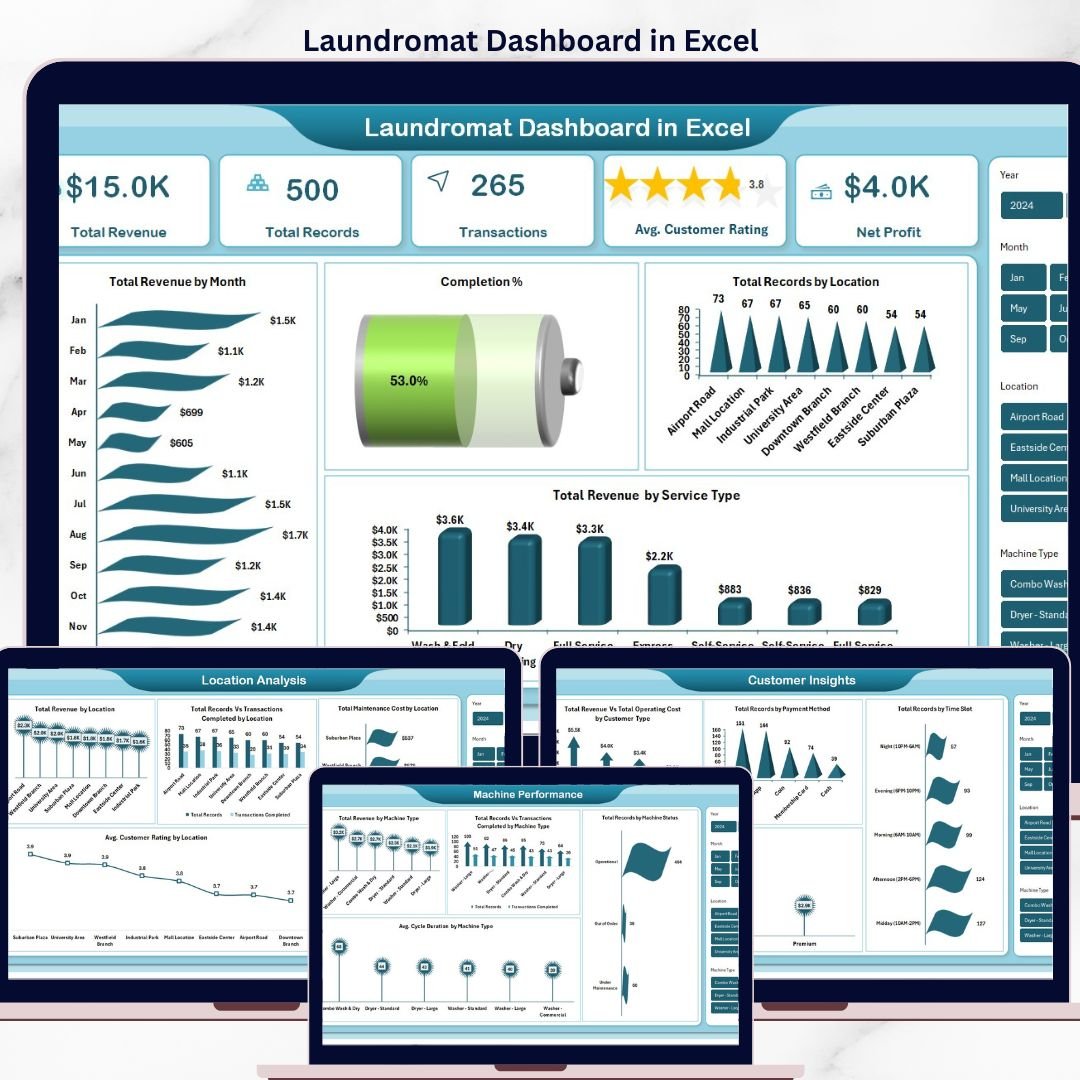
Laundromat Dashboard in Excel
🔑 Key Features of the Laundromat Dashboard in Excel
This dashboard includes 5 interactive pages, 5 KPI cards and 15+ visual charts covering every critical angle of a laundromat operation. Each page is connected through slicers so you can filter the entire report by location, machine type, service type, payment method or customer type in one click. 📊
🔹 Fully editable Excel .xlsx file — built on pivot tables so every chart refreshes the moment you update the data.
🔹 5 analysis pages covering overview, location, machine performance, customer insights and revenue trends.
🔹 Dynamic slicers for location, machine type, service type, time slot, membership and payment method.
🔹 Completion percentage tracking to measure cycle-complete vs abandoned loads at a glance.
🔹 Machine status monitoring — see how many units are operational, under maintenance or out of service.
🔹 Membership revenue split between walk-in customers and members to protect recurring revenue.
🔹 Average cycle duration by machine type to spot slow washers and dryers eating margin.
🔹 Maintenance cost by location so you know which store is dragging profitability.
🔹 Support sheet with pre-built pivot tables — just click Refresh All and the whole dashboard updates.
🔹 Print-ready, presentation-ready layout for investor reviews and monthly operator meetings.
📦 What’s Inside the Laundromat Dashboard in Excel
1 — Overview Page
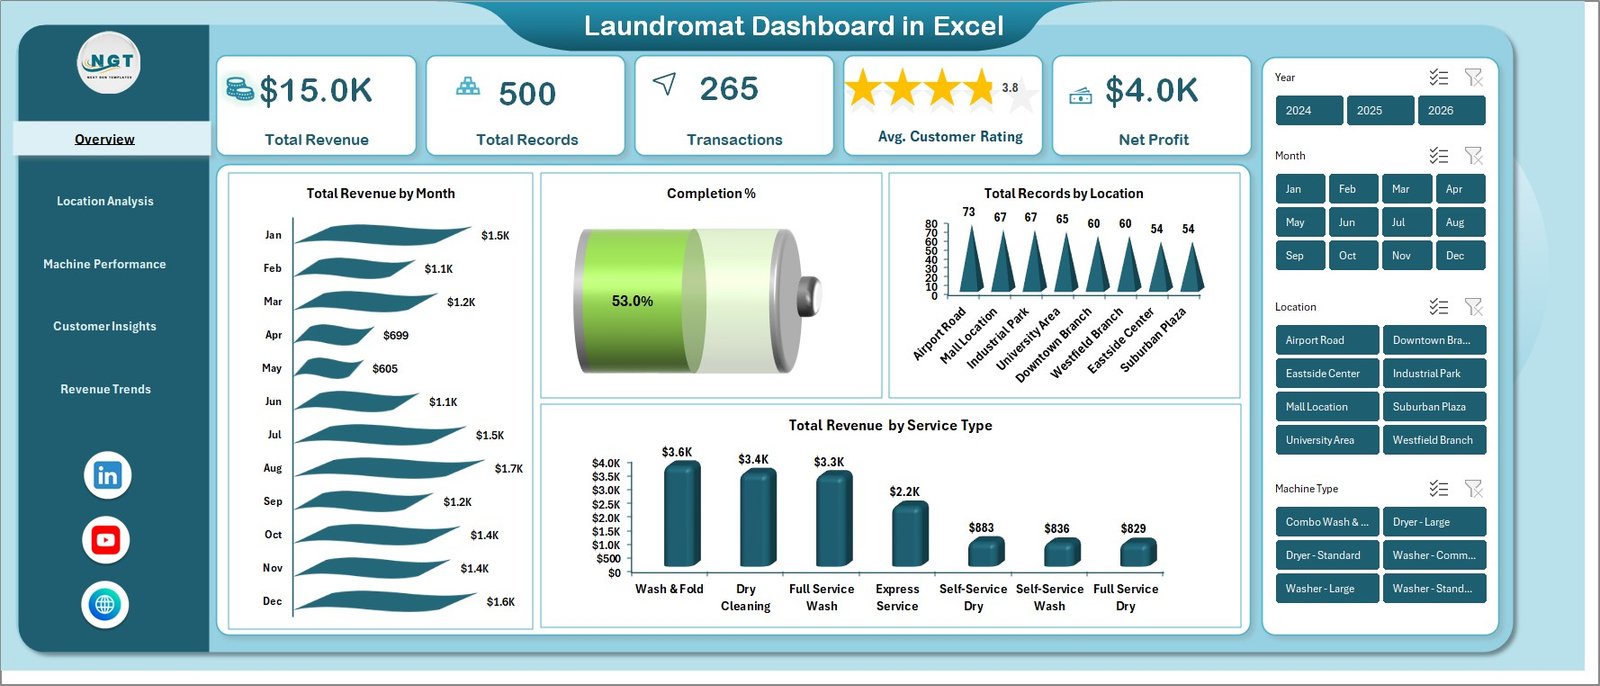
The overview page shows the high-level health of the entire laundromat business on a single screen. Five KPI cards summarise Total Revenue, Total Records, Transactions, Avg. Customer Rating and Net Profit, while slicers let you drill the entire workbook by any dimension.
📈 Total Revenue by Month — tracks the monthly revenue curve so you can spot seasonality and promotion impact.
🥧 Completion Percentage — visualises completed cycles vs aborted loads to flag operational issues early.
📍 Total Records by Location — compares transaction volume across every store to guide staffing and marketing.
💰 Total Revenue by Service Type — breaks revenue into wash, dry, fold, dry-clean and add-on services.
Laundromat Dashboard — Overview Page
2 — Location Analysis
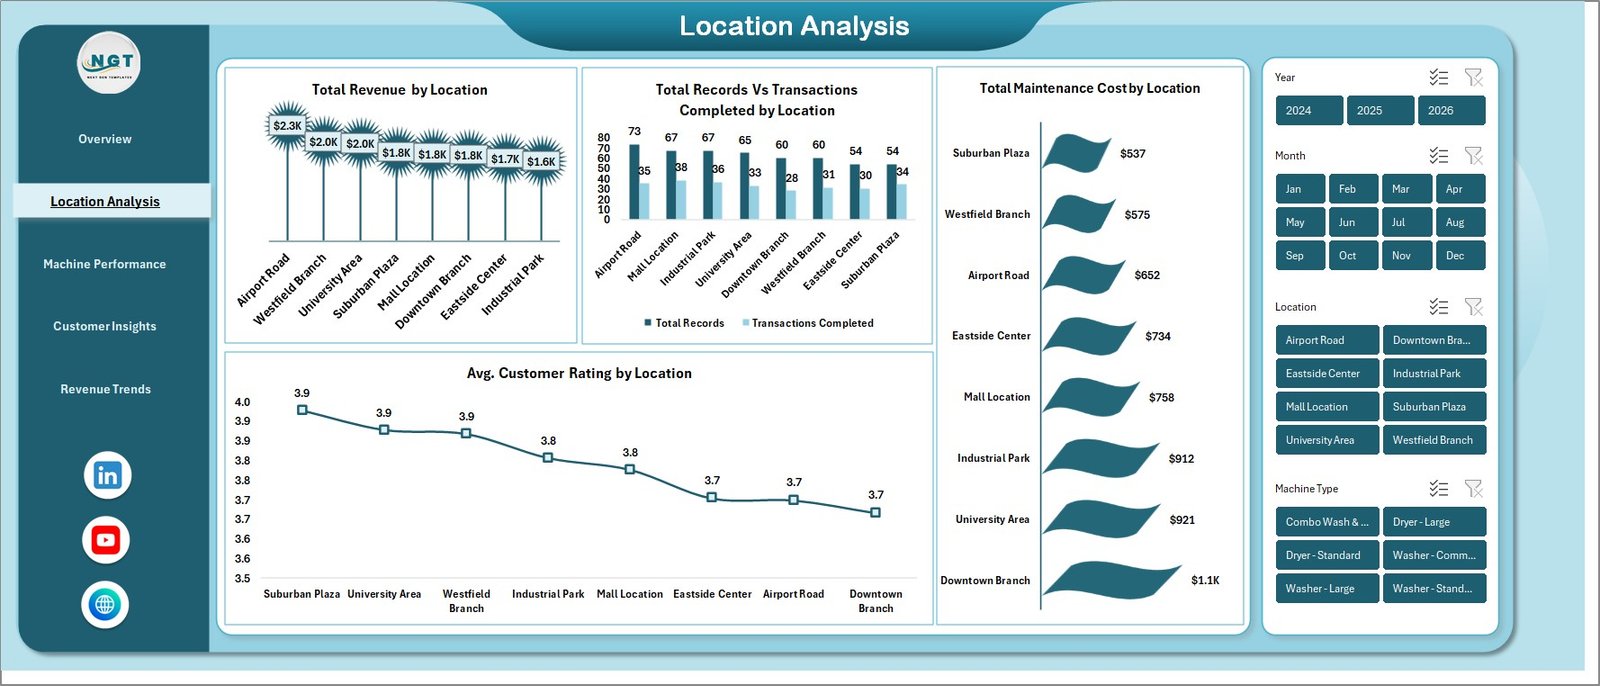
The location analysis page compares every branch side-by-side so multi-store operators know exactly which outlets are winning. Key visuals include Total Revenue by Location, Total Records vs Transactions Completed by Location, Total Maintenance Cost by Location and Avg. Customer Rating by Location. This page alone helps you decide where to invest in new machines and where to cut costs.

Laundromat Dashboard — Location Analysis
3 — Machine Performance
The machine performance page focuses on the heart of any laundromat — the equipment. It covers Total Revenue by Machine Type, Total Records vs Transactions Completed by Machine Type, Total Records by Machine Status and Avg. Cycle Duration by Machine Type. Use it to spot underperforming washers, schedule preventive maintenance and plan capacity upgrades.
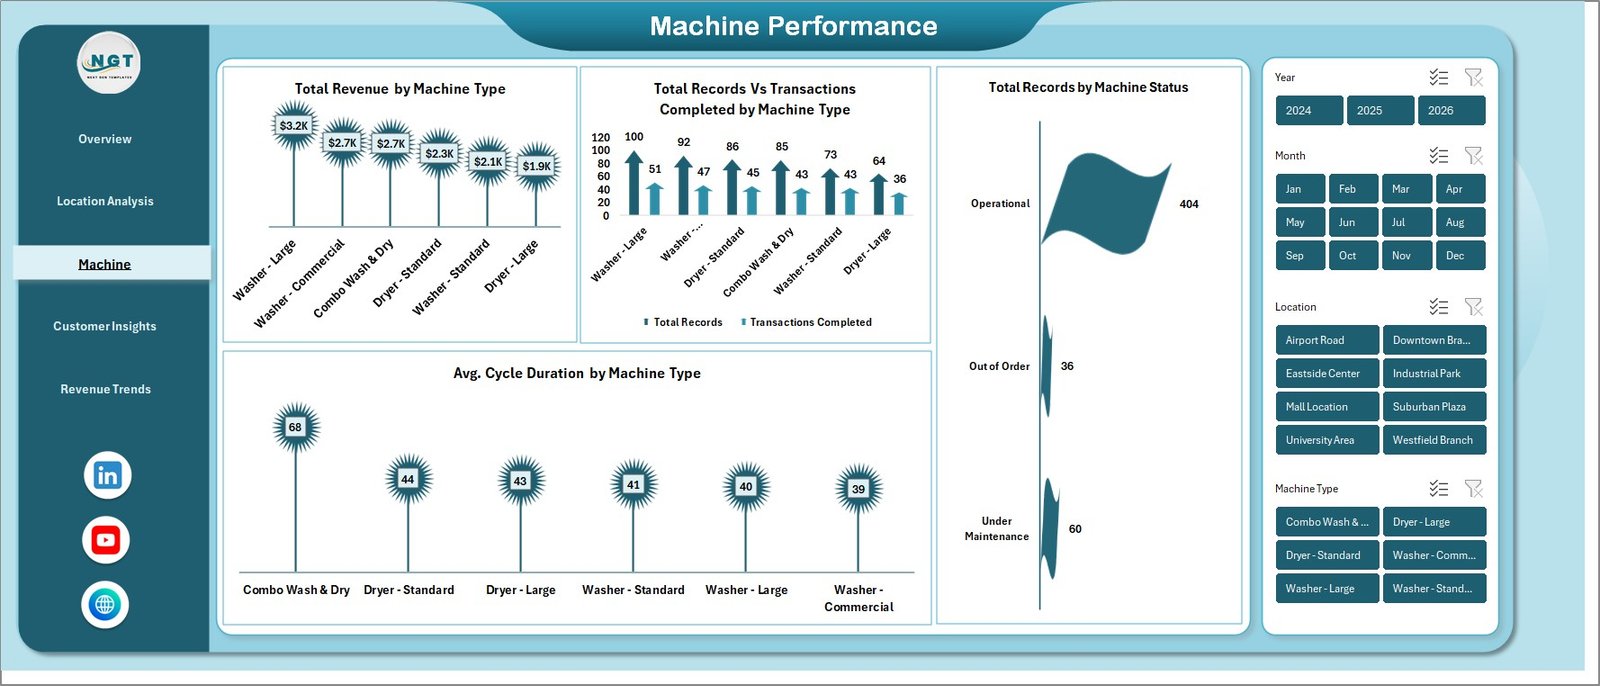
Laundromat Dashboard — Machine Performance
4 — Customer Insights
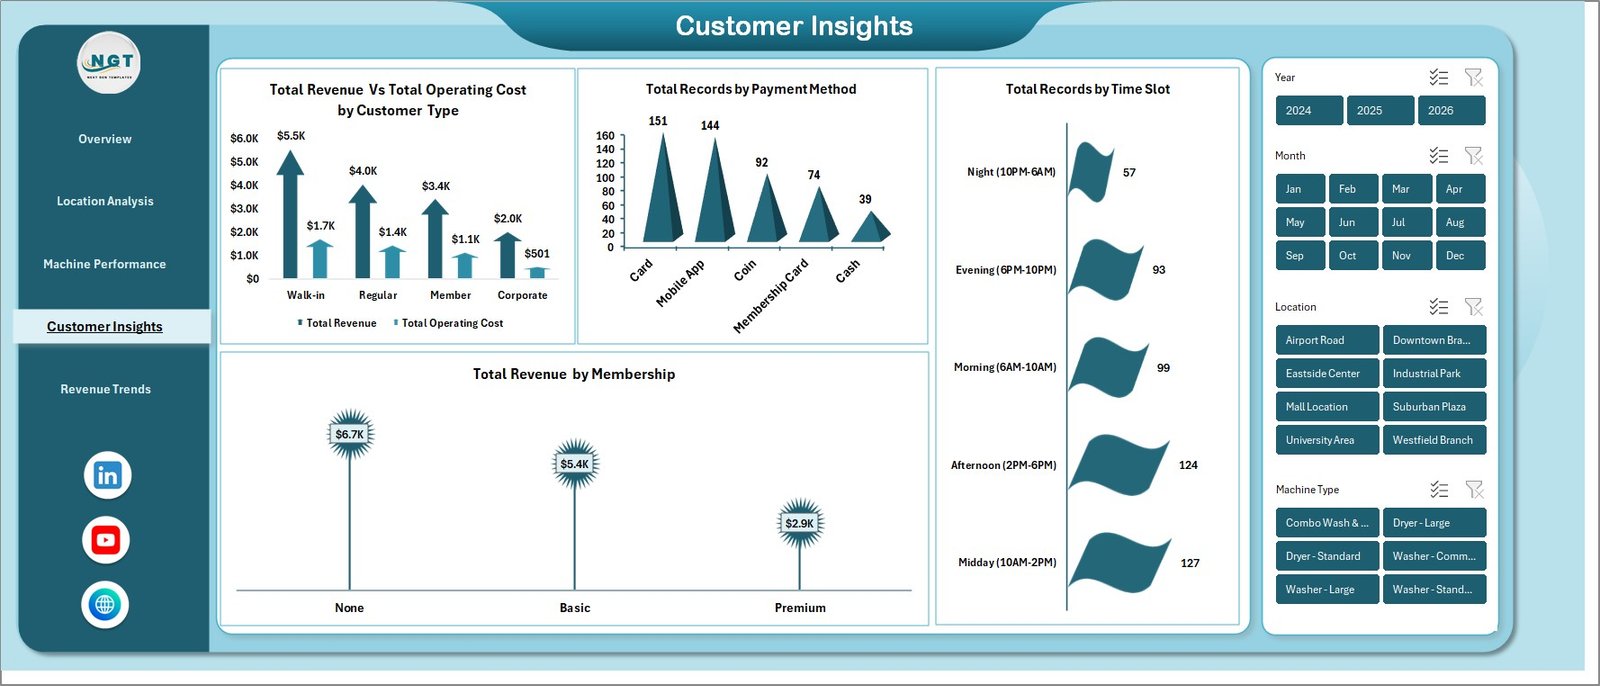
The customer insights page unpacks who is actually paying and when. Charts cover Total Revenue vs Total Operating Cost by Customer Type, Total Records by Payment Method, Total Records by Time Slot and Total Revenue by Membership. Perfect for planning loyalty programs, off-peak promotions and digital payment nudges.

Laundromat Dashboard — Customer Insights
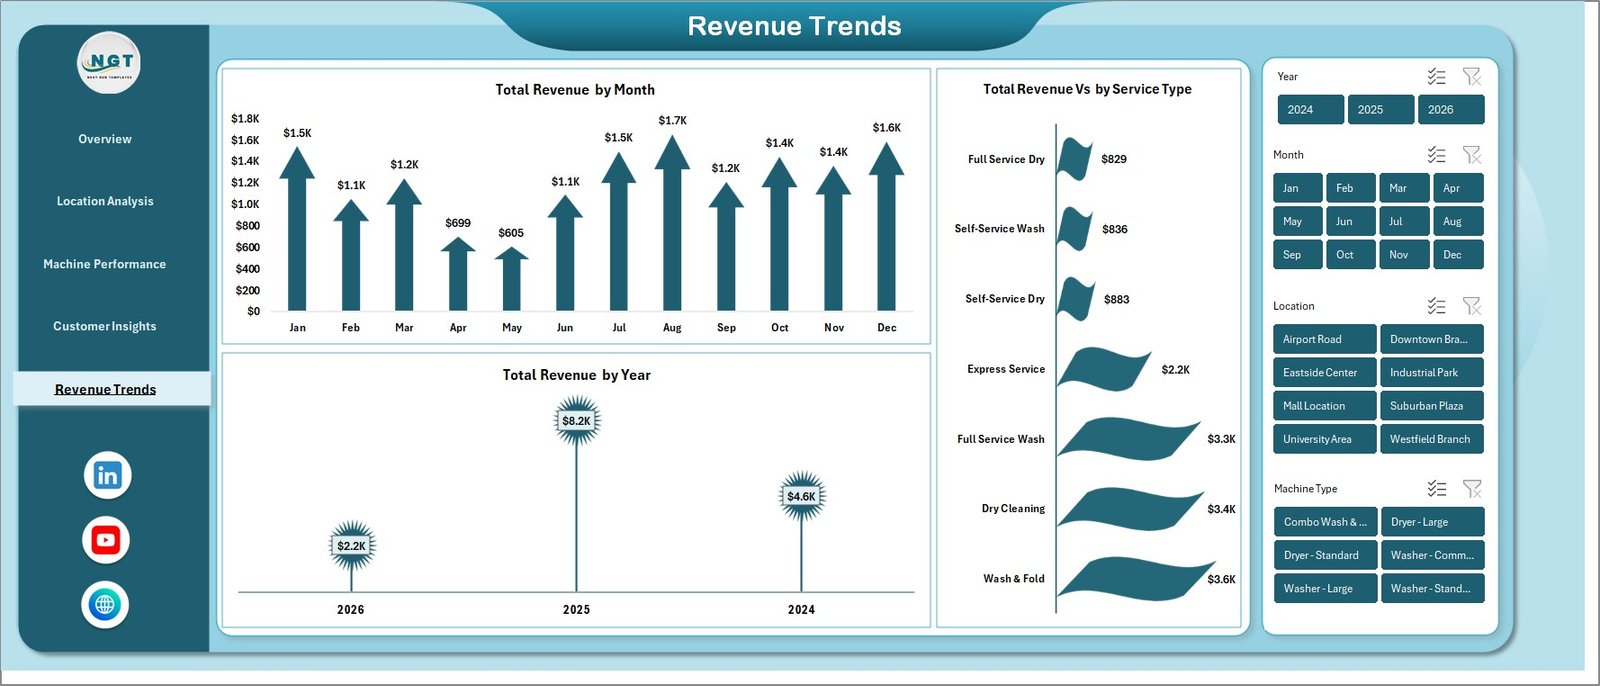
5 — Revenue Trends
The revenue trends page gives you the long-term financial view with Total Revenue by Month, Total Revenue by Year and Total Revenue vs by Service Type. It is the page you will open every board meeting and every year-end review to show growth and service-mix evolution.

Laundromat Dashboard — Revenue Trends
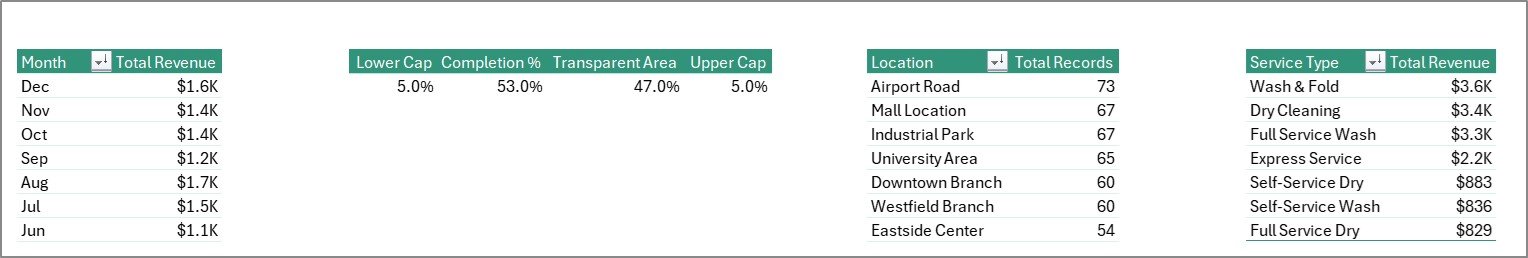
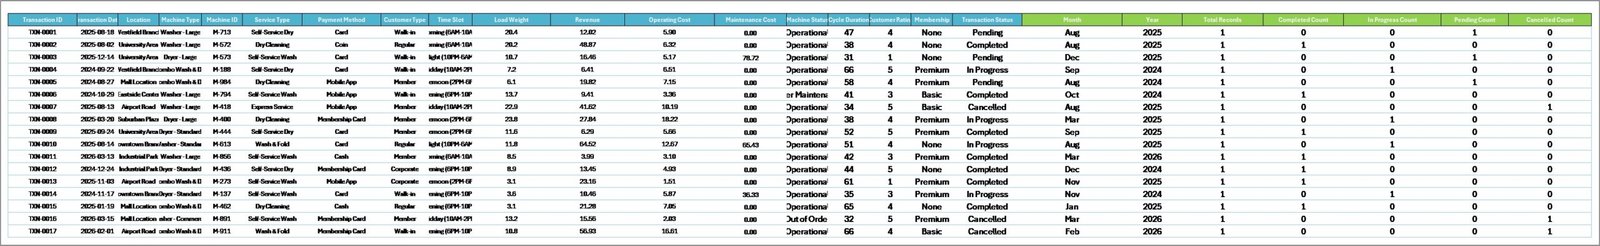
6 — Data Sheet
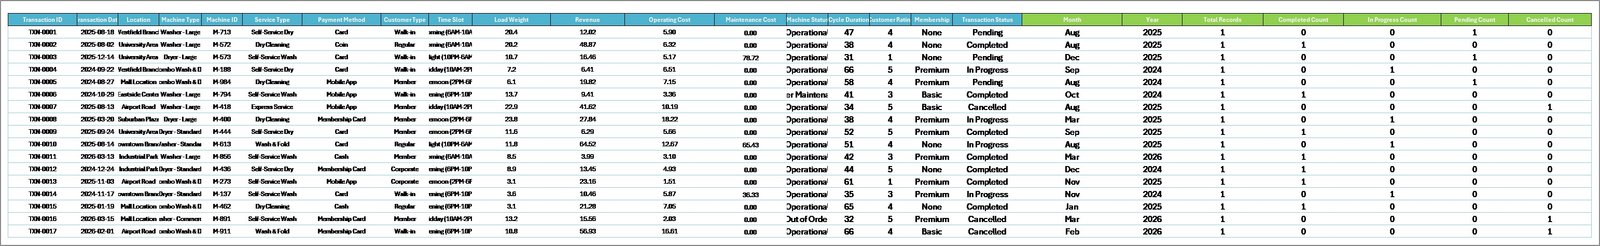
All your transaction data lives here. Keep the columns exactly as provided, paste your own records on top of the sample data, and every chart on every page refreshes automatically.
Laundromat Dashboard — Data Sheet
7 — Support Sheet
Behind the scenes the support sheet holds every pivot table that drives the dashboard. Update the data sheet, click Data > Refresh All, and every pivot and every chart recalculates instantly. You can safely keep this sheet hidden from end users.
Laundromat Dashboard — Support Sheet
⚙️ How to Use the Laundromat Dashboard in Excel
1️⃣ Download and unzip — extract the .xlsx file and open it in Microsoft Excel 2016 or later.
2️⃣ Paste your data — go to the Data sheet and replace the sample rows with your own transactions (date, location, machine, service type, amount, payment method, customer type, rating).
3️⃣ Refresh All — click Data > Refresh All. Every pivot and chart updates instantly.
4️⃣ Use the slicers — filter by location, machine type or any other field directly from the dashboard pages.
5️⃣ Present or export — print the pages or paste them into PowerPoint for monthly operator reviews.
👥 Who Can Benefit from This Laundromat Dashboard
🧺 Laundromat owners and operators who want a single source of truth for revenue and machine uptime.
🏢 Multi-location chain managers comparing branch-level performance.
🛠️ Facility and maintenance managers tracking breakdowns and service costs.
💼 Franchisees and investors evaluating store profitability before expansion.
📊 Business analysts and consultants supporting laundromat clients who need branded Excel reporting.
🎓 Students and educators studying small-business analytics use cases.
❓ Frequently Asked Questions
What is the Laundromat Dashboard in Excel?
The Laundromat Dashboard in Excel is a ready-made Excel template that tracks 5 KPIs and 15+ charts across 5 analysis pages, helping laundromat owners monitor revenue, machine performance, customer ratings and location profitability in one workbook.
Which KPIs does the Laundromat Dashboard track?
The dashboard tracks 5 key performance indicators: Total Revenue, Total Records, Transactions, Avg. Customer Rating and Net Profit — all updated automatically when you refresh the data.
Do I need advanced Excel skills to use this laundromat template?
No. If you can paste data into a sheet and click Refresh All, you can use this template. Every chart, KPI and slicer is pre-built using pivot tables, so there are no formulas to edit.
Can I use this dashboard for multiple laundromat locations?
Yes. The Location Analysis page and all slicers are designed for multi-location operators. Add a location column to every row in the data sheet and the dashboard will automatically compare every branch by revenue, transactions, maintenance cost and customer rating.
Does the dashboard work in Excel for Mac and Office 365?
Yes. The Laundromat Dashboard in Excel is compatible with Microsoft Excel 2016, 2019, 2021, Office 365 and Excel for Mac. You only need a version that supports pivot tables and slicers.
Will you help if I get stuck setting it up?
Absolutely. Watch the step-by-step walkthrough on the PK – An Excel Expert YouTube channel, and reach out via the contact form on nextgentemplates.com if you need personalised help.
🔗 Explore Related Templates
Looking for more service-business analytics? Check our HVAC Service Dashboard in Excel for field-service operators, the Food Truck Dashboard in Excel for mobile retail, or browse our full range of Excel Dashboard Templates across every industry.
📖 Click here to read the Detailed Blog Post
Watch the step-by-step video tutorial:


Reviews
There are no reviews yet.