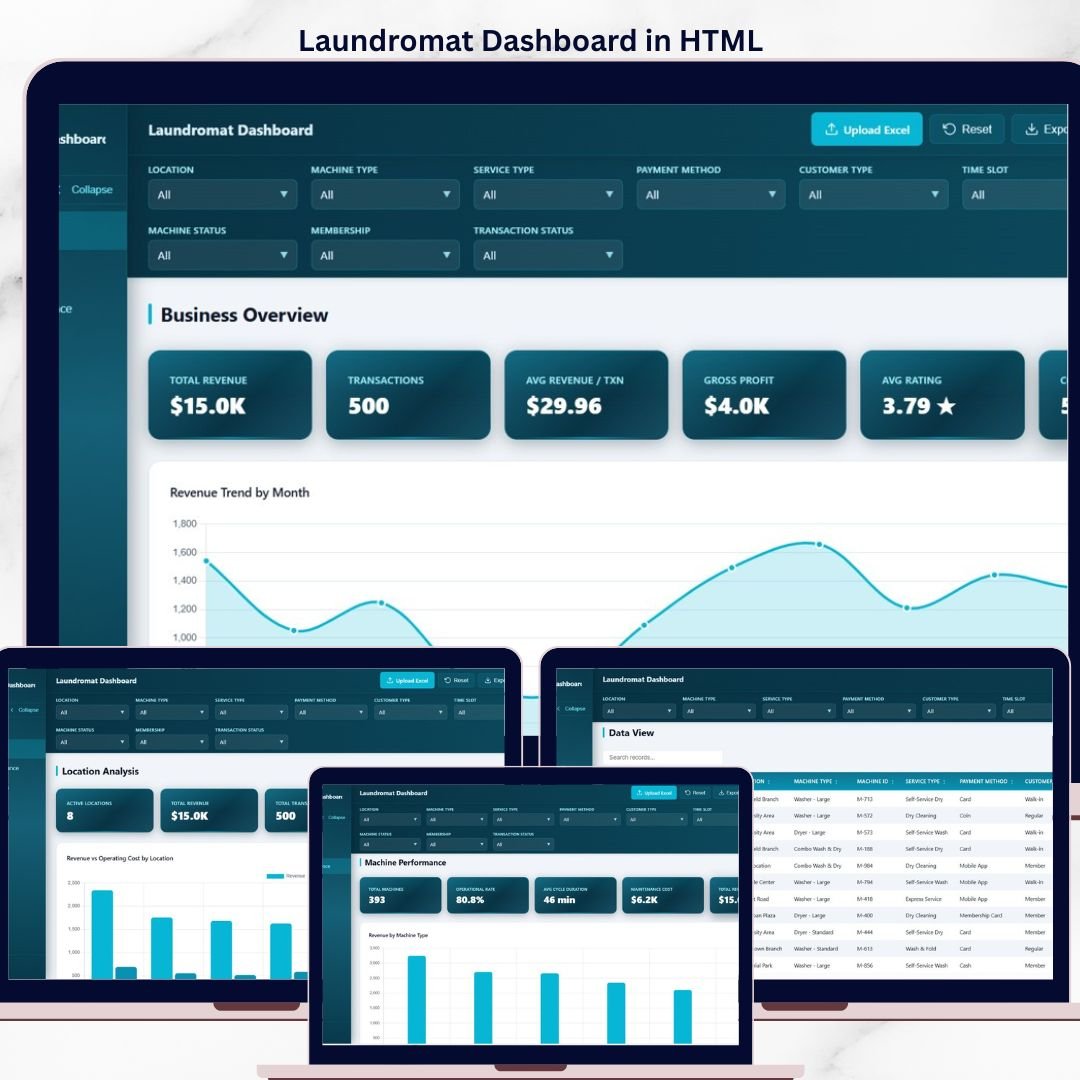
The Laundromat Dashboard in HTML tracks 6 core KPIs across 5 interactive browser pages, visualising 18+ charts covering revenue, machine performance, customer behaviour and multi-location analytics. Setup takes under 5 minutes — unzip the file, open index.html in any modern browser, and every chart updates automatically when you replace the sample data file.
🌍 Join 8,400+ teams in 40+ countries using NextGenTemplates to replace paid SaaS tools with one-time-purchase Excel, Google Sheets, Power BI, and HTML templates.
✅ Instant download · One-time payment · No subscription · No per-user fees · Lifetime browser-ready access
🔑 Key Features of the Laundromat Dashboard in HTML
This HTML Laundromat Dashboard Template is engineered for laundromat owners, multi-store operators, franchisees and facility managers who want a single browser-based command centre for every coin-op or card-operated laundry location they run. Because it is built in pure HTML, CSS and JavaScript, the dashboard works instantly on any laptop, desktop or tablet — no Microsoft Excel, Power BI licence or SaaS subscription required.
🔹 6 KPI cards on the Overview page — Total Revenue, Transactions, Avg Revenue per Txn, Gross Profit, Avg Rating and Completion Rate — so the financial and operational health of the business is visible in one glance.
🔹 18+ interactive charts spread across 5 dedicated pages covering revenue trends, location comparisons, machine performance, customer insights and a searchable data view.
🔹 Dynamic slicers let you filter the entire dashboard by location, service type, machine type, payment method and customer segment in one click.
🔹 Machine status monitoring shows which washers and dryers are operational, under maintenance or out of service, plus average cycle duration by machine type.
🔹 Completion Rate KPI tracks cycle-complete vs abandoned loads so operators can spot recurring issues in specific stores or machines.
🔹 CSV export on the Data View page lets you download filtered transaction records directly from the browser.
🔹 Zero software required — the dashboard opens in Chrome, Edge, Firefox or Safari and runs entirely on your own device (no data is sent anywhere).
🔹 Compatible with our full range of HTML Dashboard Templates so you can standardise reporting across multiple service businesses.
📦 What’s Inside the Laundromat Dashboard in HTML
1 — Overview Page
The Overview page is the executive cockpit of the dashboard. Six KPI cards at the top summarise the entire business: Total Revenue, Transactions, Avg Revenue per Txn, Gross Profit, Avg Rating and Completion Rate. Below the cards, five charts break down performance in detail.
📈 Revenue by Month — shows the monthly revenue curve to identify seasonal peaks, promotion effects and growth trends.
📍 Revenue by Location — compares every store side-by-side so you know which outlets drive the most money.
🧺 Transactions by Status — splits loads into completed, in-progress and cancelled to highlight operational leakage.
💰 Revenue by Service Type — breaks revenue across wash, dry, fold, dry-clean and add-on services.
💳 Transactions by Payment Method — tracks cash, card, app and membership payments to guide digital payment adoption.
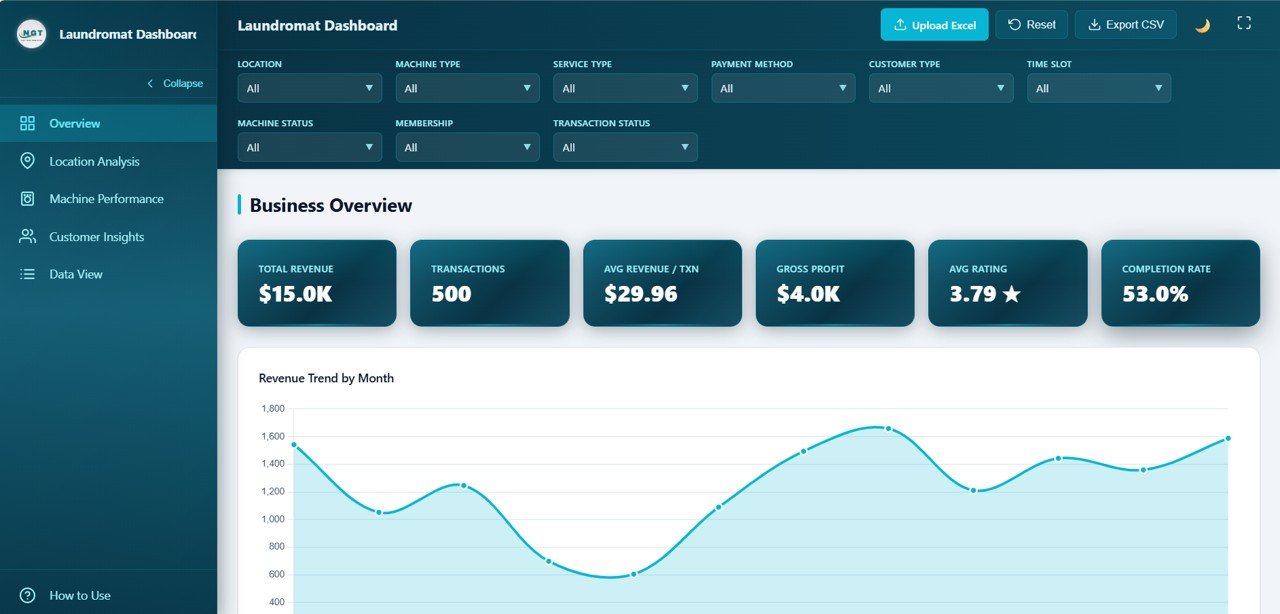
Laundromat Dashboard in HTML – Overview Page
2 — Location Analysis
The Location Analysis page is built for multi-store operators who need to compare branch performance at a glance.
🏢 Revenue and Operating Cost by Location — shows gross revenue against operating cost per store to highlight margin leaders and laggards.
📊 Transactions by Location — compares transaction volume across stores to guide staffing and marketing spend.
⭐ Average Rating by Location — pinpoints which branches have customer satisfaction issues.
🛠️ Maintenance Cost by Location — flags stores eating profit due to aging equipment.
💵 Average Revenue per Transaction by Location — identifies which stores upsell services most effectively.
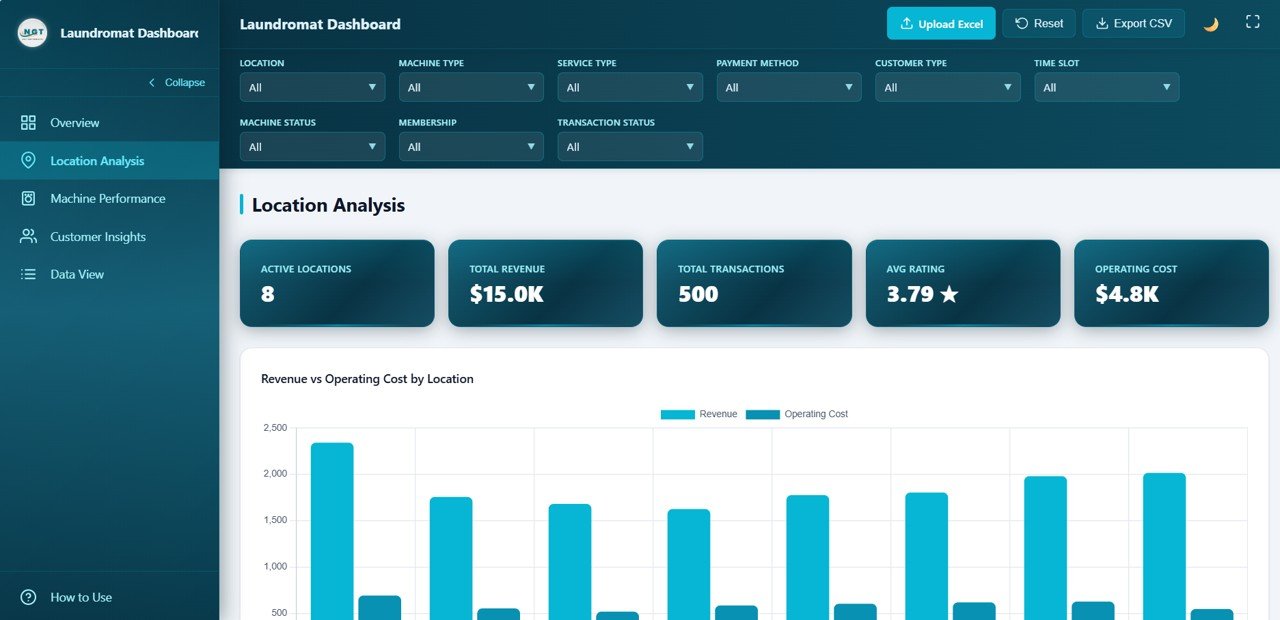
Laundromat Dashboard in HTML – Location Analysis
3 — Machine Performance
The Machine Performance page focuses on the heart of any laundromat — the equipment itself.
🧺 Revenue by Machine Type — compares income generated by top-loaders, front-loaders, stack dryers and commercial units.
⚙️ Transactions by Machine Status — shows how many runs came from operational, under-maintenance or out-of-service machines.
⏱️ Average Cycle Duration by Machine Type — flags slow washers and dryers eroding throughput and margin.
🛠️ Maintenance Cost by Machine Type — shows where preventive maintenance pays off and which units to replace.
🔁 Transactions by Machine Type — measures utilisation across equipment classes to plan capacity upgrades.
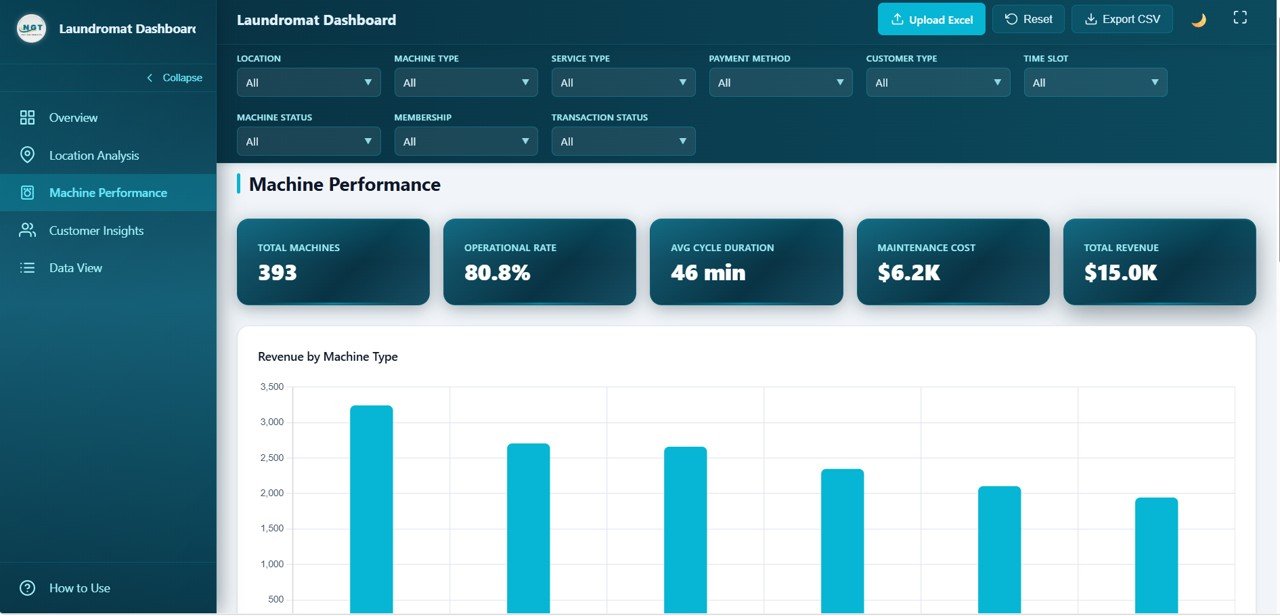
Laundromat Dashboard in HTML – Machine Performance
4 — Customer Insights
The Customer Insights page reveals who is paying, when and how much.
⏰ Revenue by Time Slot — identifies morning, afternoon, evening and late-night demand patterns for staffing and promotions.
👥 Revenue by Customer Type — splits revenue between walk-ins, members and commercial accounts.
⭐ Transactions by Customer Rating — correlates satisfaction scores with repeat behaviour.
🎟️ Transactions by Membership — protects recurring revenue by tracking member vs non-member activity.
⚖️ Average Load Weight by Customer Type — informs pricing tiers and capacity planning per customer segment.
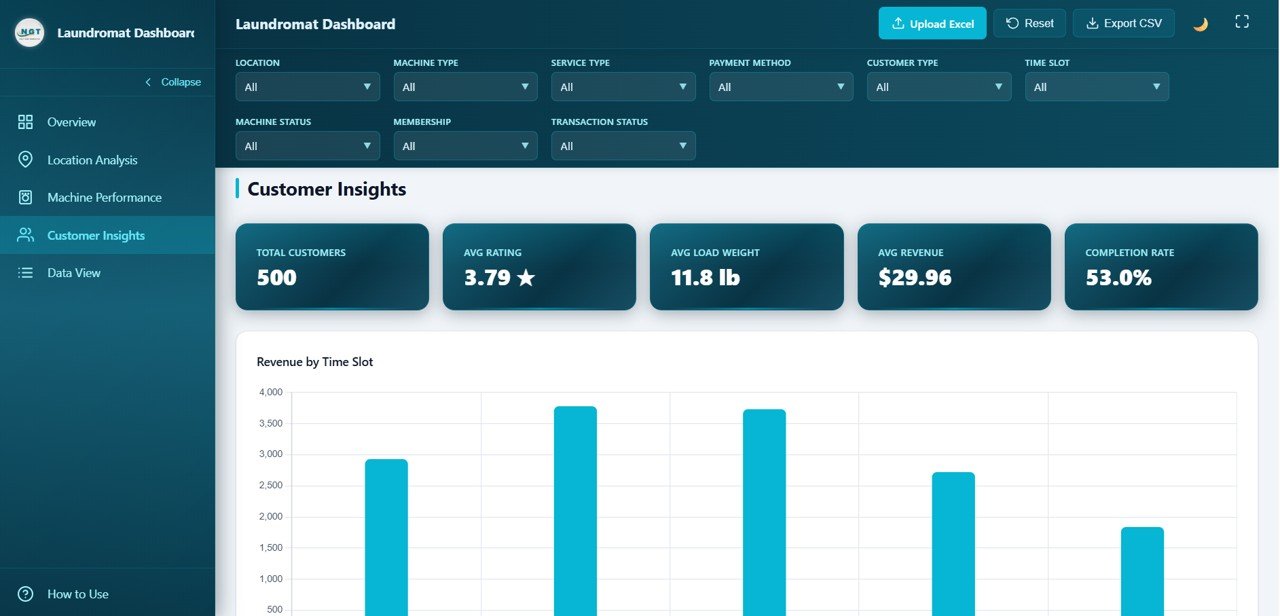
Laundromat Dashboard in HTML – Customer Insights
5 — Data View
The Data View page is the detailed transaction table. Every record is searchable, sortable and paginated, and you can export the filtered view to CSV with one click for tax filing, accounting or deeper analysis in Excel or Google Sheets.
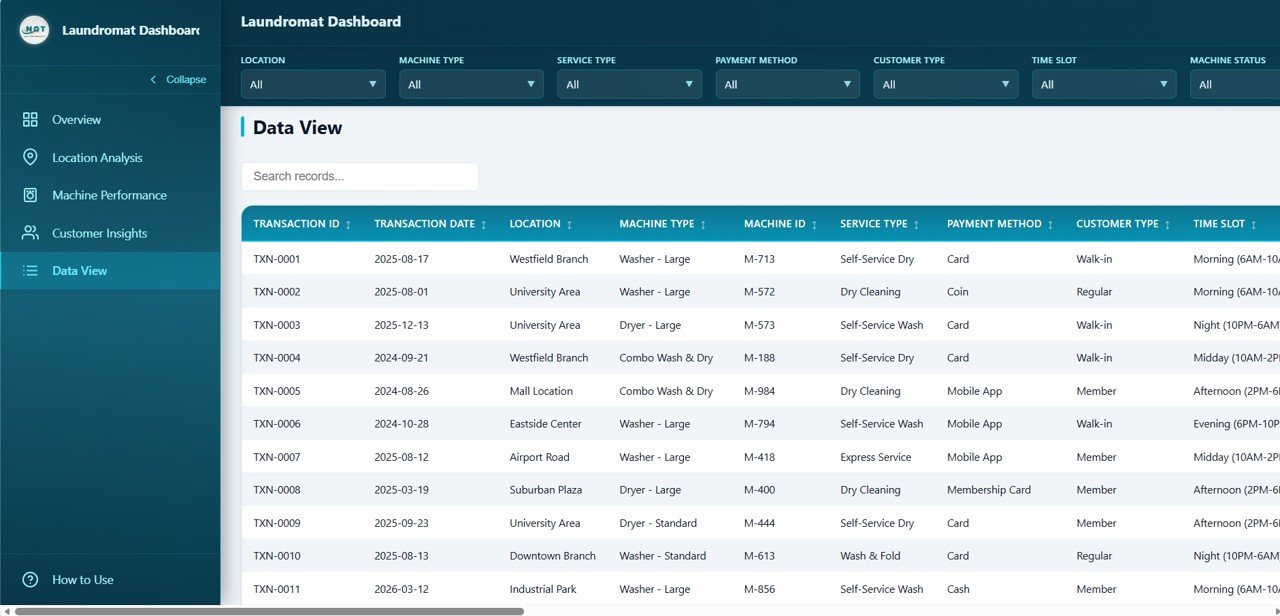
Data View tab
📊 Laundromat Dashboard in HTML vs. Excel Equivalent vs. Paid Laundromat POS/SaaS
| Feature | Laundromat Dashboard in HTML | Excel Laundromat Dashboard | Paid Laundromat POS/SaaS (CleanCloud, LaundryCard, SpinXpress) |
|---|---|---|---|
| Cost | $12.99 one-time ✅ | $17.99 one-time | $49–$199 / month / store |
| Platform | Any modern browser ✅ | Microsoft Excel 2016+ | Web + mobile app |
| Setup time | Under 5 minutes ✅ | Under 10 minutes | 1–3 weeks onboarding |
| Works offline on any laptop | ✅ | ✅ | ❌ (cloud only) |
| Software licence required | None ✅ | Excel licence | Paid subscription |
| Multi-location comparison | ✅ | ✅ | ✅ |
| Machine performance tracking | ✅ | ✅ | Varies |
| Customisable charts & fields | ✅ | ✅ | ❌ (vendor-controlled) |
| Year-1 cost at 3 stores | $12.99 ✅ | $17.99 | $1,764–$7,164 |
For laundromat owners who want real machine-level and location-level analytics without paying a monthly SaaS fee or waiting weeks for onboarding, the Laundromat Dashboard in HTML sits in the sweet spot.
👥 Who This Template Is For — and Who It’s Not For
✅ This template is built for:
- Laundromat owners running 1–20 coin-op or card-op self-service stores
- Multi-location chain managers who need branch-level comparison
- Franchisees and investors evaluating store profitability before expansion
- Facility and maintenance managers tracking machine uptime and repair cost
- Business analysts and consultants supporting laundromat clients
❌ This template is NOT for:
- Enterprise laundromat chains needing built-in POS hardware integration and live card-reader feeds
- Operators wanting a multi-user cloud platform with role-based access and audit logs
- Businesses whose primary need is a full accounting system (this is analytics, not bookkeeping)
⚙️ How to Use the Laundromat Dashboard in HTML
1️⃣ Download and unzip the file — you will see an index.html file plus a data file.
2️⃣ Open index.html in Chrome, Edge, Firefox or Safari by double-clicking it — the dashboard loads instantly in your browser.
3️⃣ Update the data file with your own laundromat transactions (date, location, machine, service, revenue, customer type, payment method, rating).
4️⃣ Refresh the browser — every KPI card, chart and slicer updates automatically with your real data.
5️⃣ Use slicers and filters on each page to drill into specific locations, machine types or customer segments.
6️⃣ Export to CSV from the Data View page whenever you need a filtered dataset for accounting or tax filing.
💼 Real-World Use Cases
Rahul owns a 3-store laundromat chain in suburban Chicago. He uses the Laundromat Dashboard in HTML every Monday morning to compare revenue and maintenance cost across his three locations, spot the store that keeps losing cycles to broken machines, and decide which units to replace this quarter — without paying $149 per store per month for CleanCloud.
Priya runs a single boutique laundromat offering premium wash-and-fold service. She uses the Customer Insights page to confirm that her members generate 62% of her revenue and that Saturday mornings drive the biggest transaction volume, then aligns staff schedules and loyalty promotions accordingly.
David is a franchise investor evaluating three laundromat acquisitions. He drops each seller’s transaction data into the Data View and uses the Location Analysis and Machine Performance pages to compare gross profit, cycle duration and maintenance cost — turning a messy CSV into a defensible valuation deck in under an hour.
❓ Frequently Asked Questions
What is the Laundromat Dashboard in HTML?
The Laundromat Dashboard in HTML is a browser-based analytics template that tracks 6 KPIs and 18+ charts across 5 dedicated pages — Overview, Location Analysis, Machine Performance, Customer Insights and Data View. It runs in any modern browser with no software installation.
Do I need Excel, Power BI or any other software to use it?
No. The Laundromat Dashboard in HTML is built with pure HTML, CSS and JavaScript. Just unzip the download and double-click index.html to open it in Chrome, Edge, Firefox or Safari. No Microsoft Office, Power BI licence or SaaS subscription is required.
How long does it take to set up the Laundromat Dashboard in HTML?
Setup takes under 5 minutes. Unzip the file, open index.html in your browser, replace the sample data file with your own transaction records, and refresh the browser. Every chart and KPI updates automatically.
Can I use this dashboard across multiple laundromat locations?
Yes. The Location Analysis page is specifically designed for multi-store operators. Tag every transaction with a location name and the dashboard will compare revenue, operating cost, maintenance cost, transactions and average rating across all your branches automatically.
How does it compare to paid laundromat POS systems like CleanCloud or LaundryCard?
Paid laundromat POS and SaaS platforms typically charge $49–$199 per store per month. The Laundromat Dashboard in HTML is a one-time $12.99 purchase. It does not replace POS hardware, but it delivers the same analytics layer — revenue, machine performance, location comparison — for a tiny fraction of the annual cost.
Can I export my filtered data for accounting or tax filing?
Yes. The Data View page includes a CSV export button. Apply any filter or search, click Export, and download a clean CSV you can import into Excel, Google Sheets, QuickBooks or hand to your accountant.
What is the best HTML dashboard template for a laundromat business?
The Laundromat Dashboard in HTML from NextGenTemplates is one of the best options available. It covers 5 analytical pages, 6 KPIs and 18+ charts designed specifically for laundromat owners and multi-store operators — all in a single browser-ready HTML file with no software dependency.
👤 About the Author
Built by PK — Microsoft Certified Professional with 15+ years of Excel, Google Sheets, Power BI and HTML dashboard experience. Founder of NextGenTemplates, reaching 300K+ subscribers across YouTube channels (@PK-AnExcelExpert, @NextGenTemplates, @NeoTechNavigators). Every template is hand-built and tested before release.
🔗 Explore Related Templates
📌 Laundromat Dashboard in Excel — Same Laundromat analytics as a pivot-powered Excel workbook for Office 365 users
📌 Salon and Spa Dashboard in HTML — Another service-business HTML dashboard for salon and spa operators
📌 Restaurant Profit and Loss Dashboard in HTML — Multi-branch food-service P&L analytics in pure HTML
📌 Small Business CFO Dashboard in HTML — Finance-focused HTML dashboard for small business owners
Browse the full range of HTML Dashboard Templates across every industry.
📖 Click here to read the Detailed Blog Post
Watch the step-by-step video tutorial:
🎥 Visit our YouTube channel for step-by-step video tutorials
👉 YouTube.com/@NextGenTemplates


Reviews
There are no reviews yet.