



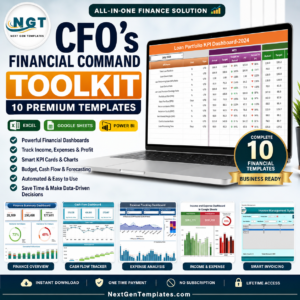
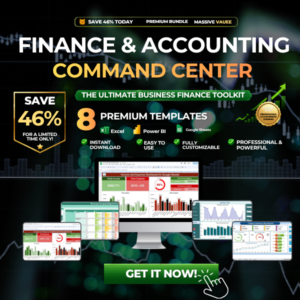
The Finance & Accounting Command Center is the ultimate bundle for finance professionals who want complete visibility and control over their organization’s financial health. This powerful collection brings together 8 premium finance templates across Excel, Power BI, and Google Sheets — covering everything from P&L tracking and cash flow monitoring to budget forecasting and revenue analysis. Instead of buying each template individually for $102.92, you get the entire suite for just $64.99 — a massive 37% savings ($37.93 saved)!
Whether you manage a startup’s budget or oversee a corporation’s financial operations, this bundle equips you with professional-grade dashboards, automated calculations, and interactive visuals to make faster, smarter financial decisions.
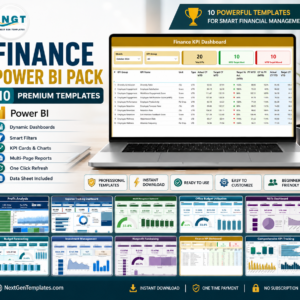
🎯 Finance & Accounting Command Center
8 Premium Templates | $102.92 → $64.99 | Save 37%
🔑 Key Features of the Finance & Accounting Command Center
📊 Complete Financial Overview – Monitor income, expenses, profit margins, cash flow, budgets, and revenue from one centralized bundle
💰 Multi-Platform Compatibility – Templates available in Excel, Power BI, and Google Sheets for maximum flexibility
📈 Interactive KPI Dashboards – Visual cards, charts, slicers, and graphs that update automatically when you enter your data
🔄 Automated Calculations – Built-in formulas handle totals, variances, profit margins, and trend analysis with zero manual effort
🎯 Target vs Actual Tracking – Compare budget plans with real spending and revenue targets across regions and channels
📉 Expense Drill-Down by Category & Department – Identify exactly where money goes and spot cost-saving opportunities
🧾 Cash Flow Waterfall Charts – Visualize how money moves from opening balance through inflows and outflows to closing balance
💡 Budget Forecasting & Variance Alerts – Predict future spending and flag over-budget departments before it’s too late
📂 Clean Data Entry Sheets – Beginner-friendly input pages that feed directly into the automated dashboard
🚀 No Coding Required – Every template is plug-and-play ready with professional formatting and design
📦 What’s Inside the Finance & Accounting Command Center
1. Finance Summary Dashboard in Excel
A comprehensive financial overview dashboard to track income, expenses, profit margins, and cash flow with interactive charts and real-time reporting. Perfect as your central finance hub.
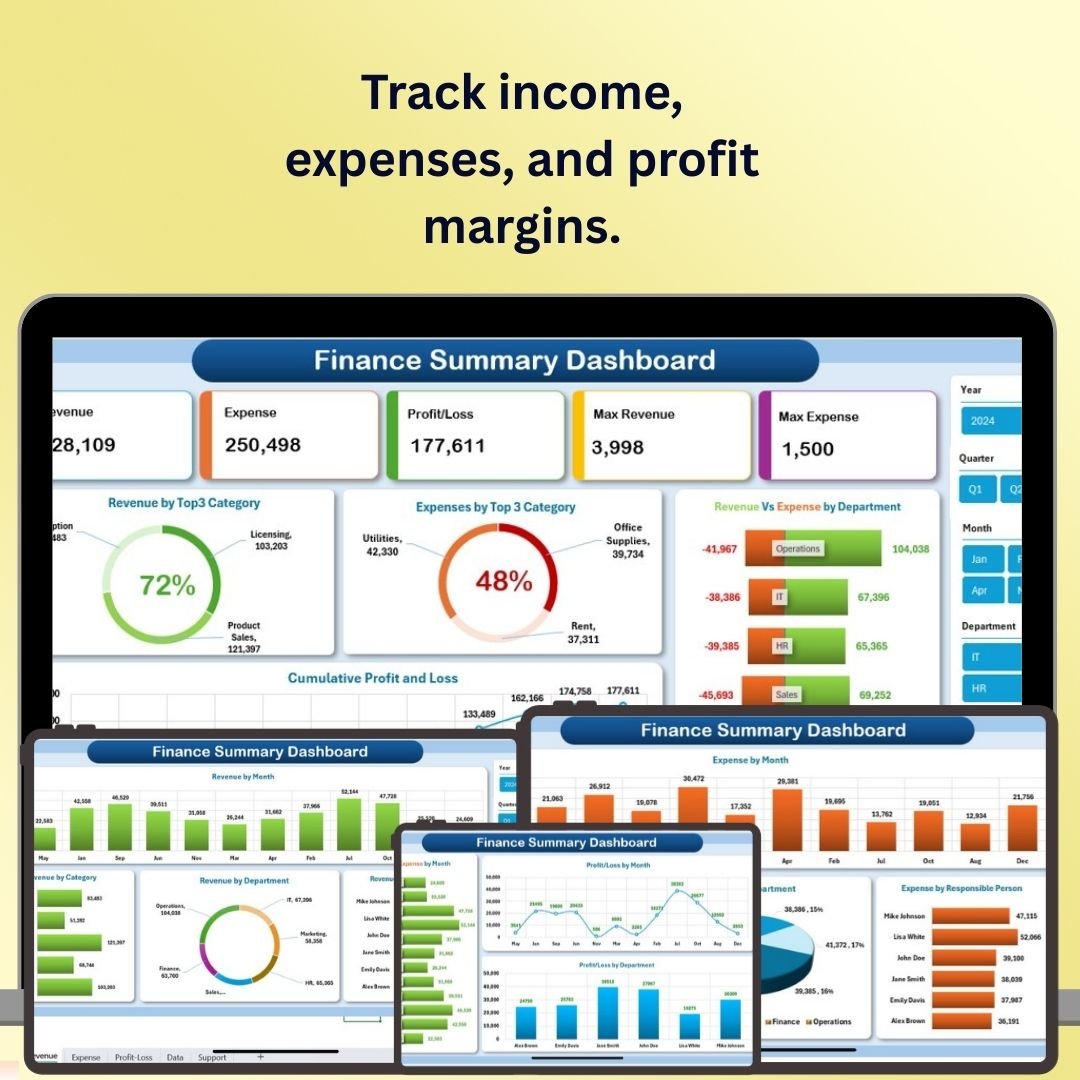
Finance Summary Dashboard in Excel
2. Expense Tracking Dashboard in Power BI
An interactive Power BI dashboard to monitor, analyze, and optimize business expenses across departments, categories, vendors, and projects with real-time analytics and dynamic filtering.

Expense Tracking Dashboard in Power BI
3. Cash Flow Template in Excel
Track monthly cash inflows, outflows, net cash, and closing balances with automated calculations, a professional dashboard, and a waterfall chart showing your cash movement journey.
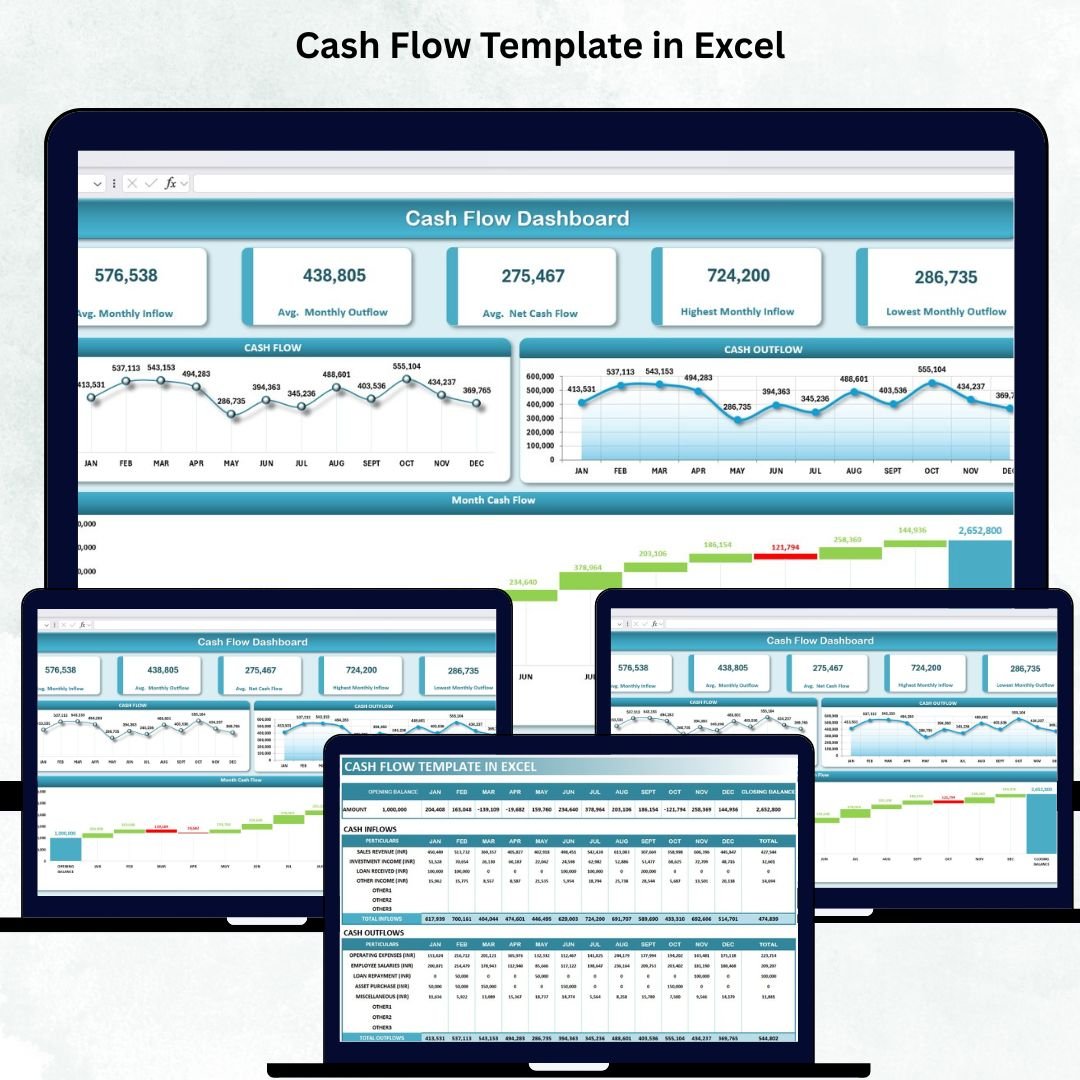
Cash Flow Template in Excel
4. Revenue Analysis Dashboard in Power BI
A 5-page Power BI dashboard covering overview, regional analysis, sales channel performance, product-level tracking, and monthly revenue trends with 7 interactive slicers and KPI cards.
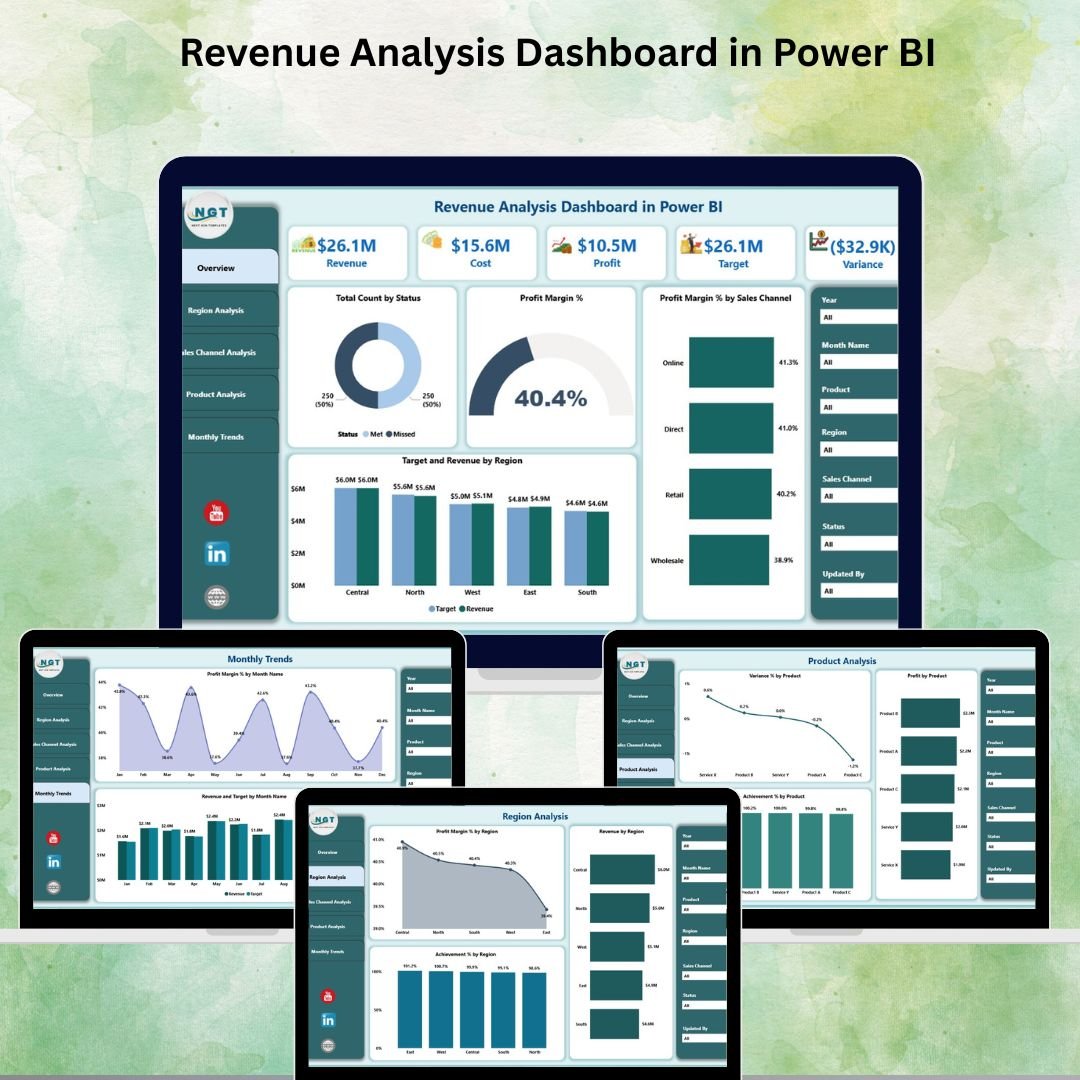
Revenue Analysis Dashboard in Power BI
5. Income and Expense Dashboard in Google Sheets
A cloud-based financial tracker for income and expenses with automated calculations, customizable categories, real-time data entry, and visual charts for spending analysis.

Income and Expense Dashboard in Google Sheets
6. Revenue Analysis Report in Excel
A dynamic Excel reporting template with 5 KPI cards, slicers, and charts for tracking revenue by region, sales channel, and month — complete with variance and profit margin analysis.
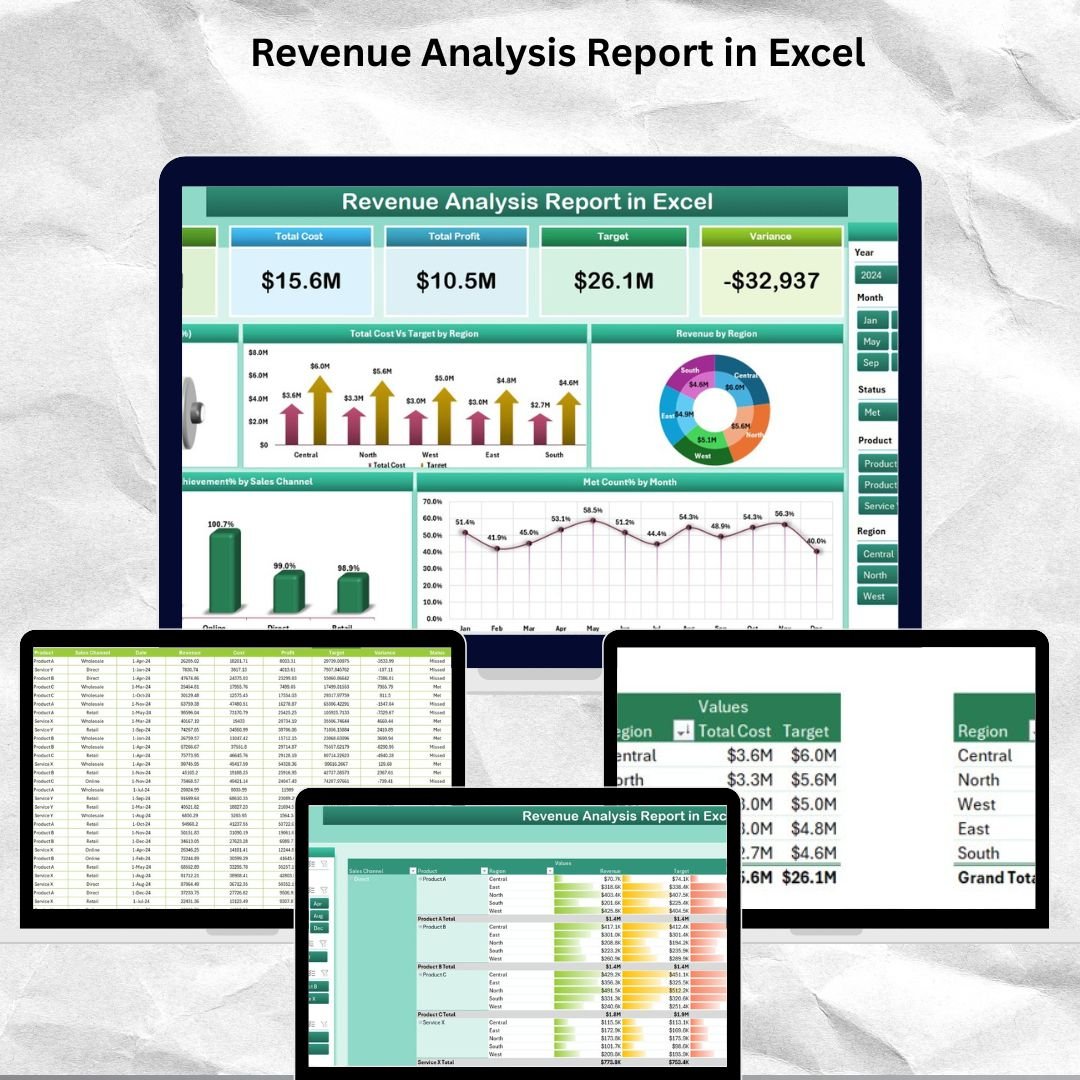
Revenue Analysis Report in Excel
7. Monthly Budget Tracker in Microsoft Excel
Track income, expenses, and savings with automated calculations, dynamic pie charts and bar graphs, customizable categories, and interactive slicers for daily and category-wise analysis.
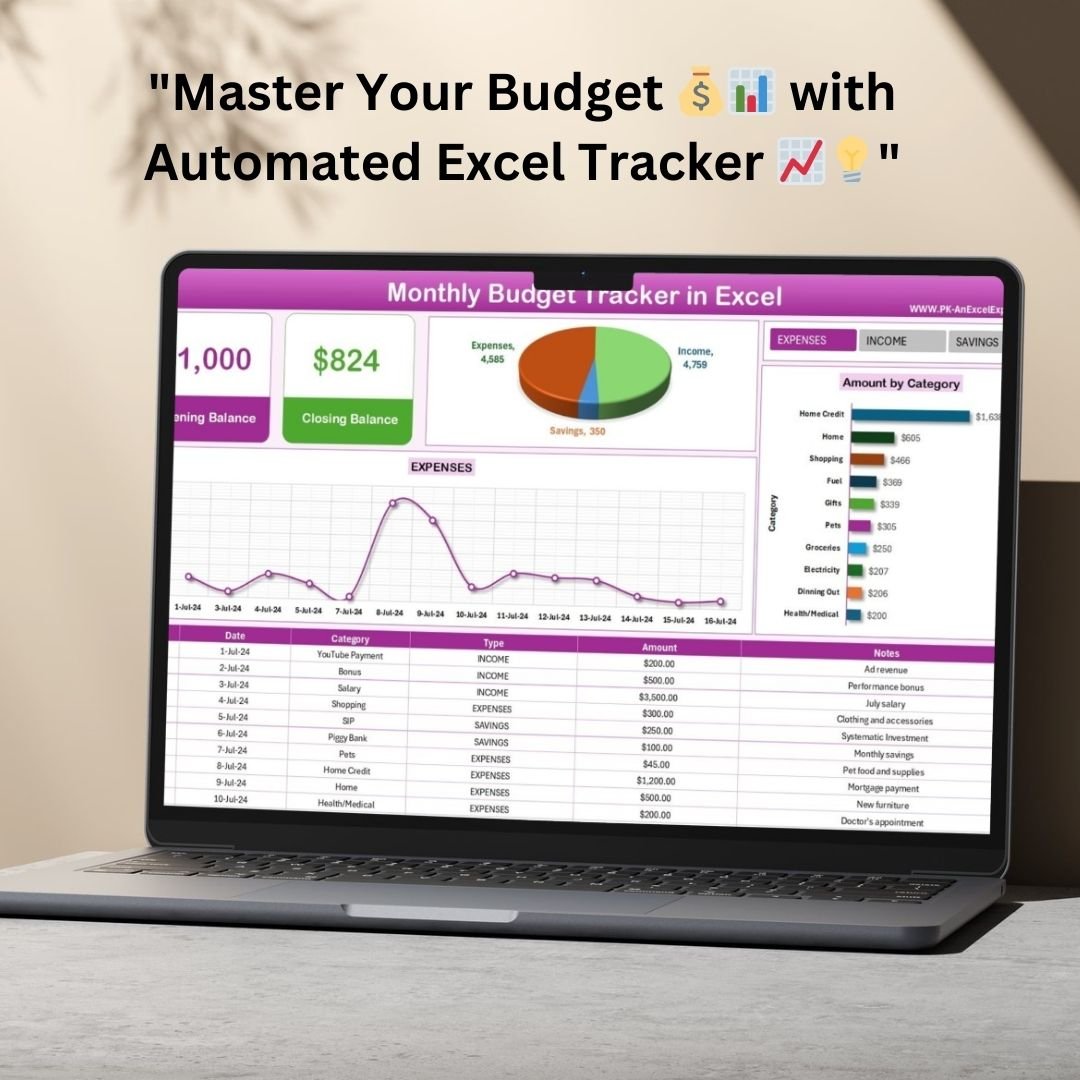
Monthly Budget Tracker in Microsoft Excel
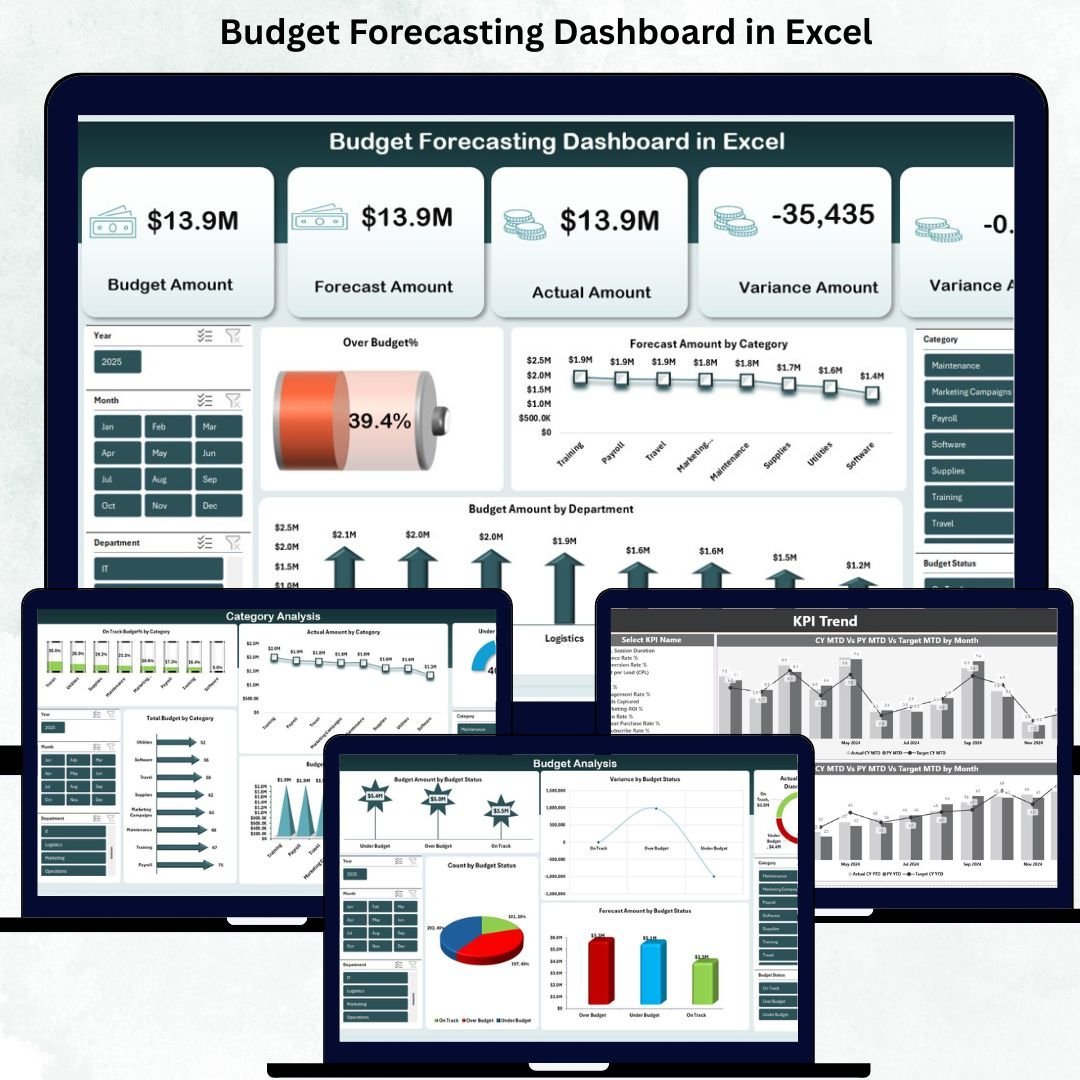
8. Budget Forecasting Dashboard in Excel
A powerful budget management tool with KPI cards for total cost, forecast, variance %, and over-budget tracking. Includes department analysis, category insights, budget status tracking, and monthly trends.
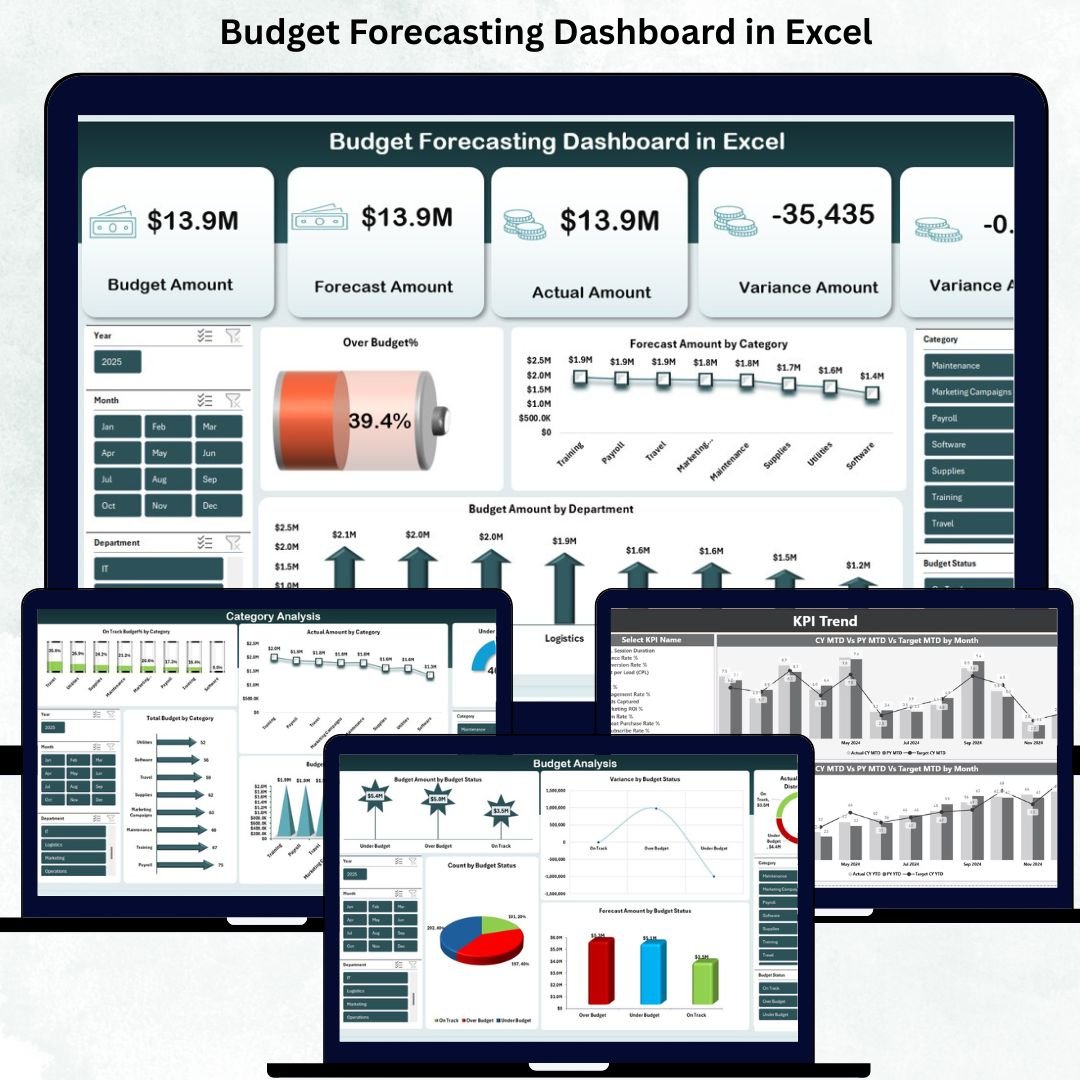
Budget Forecasting Dashboard in Excel
💡 Smart Comparison — Individual vs Bundle
| Feature | Buy Individually | 🏆 Bundle Deal |
|---|---|---|
| Number of Templates | 8 (separate purchases) | 8 (one download) |
| Platforms Covered | Excel + Power BI + Google Sheets | Excel + Power BI + Google Sheets |
| Total Price | $64.99 | |
| Savings | $0 | $37.93 (37%) |
| Best Value | ❌ | ✅ Best Deal |
📋 Product Breakdown
| # | Product Name | Platform | Individual Price |
|---|---|---|---|
| 1 | Finance Summary Dashboard in Excel | Excel | $17.99 |
| 2 | Expense Tracking Dashboard in Power BI | Power BI | $17.99 |
| 3 | Cash Flow Template in Excel | Excel | $6.99 |
| 4 | Revenue Analysis Dashboard in Power BI | Power BI | $17.99 |
| 5 | Income & Expense Dashboard in Google Sheets | Google Sheets | $9.99 |
| 6 | Revenue Analysis Report in Excel | Excel | $6.99 |
| 7 | Monthly Budget Tracker in Microsoft Excel | Excel | $6.99 |
| 8 | Budget Forecasting Dashboard in Excel | Excel | $17.99 |
| Total Individual Price | |||
| 🏆 Bundle Price (Save 37%) | $64.99 | ||
⚙️ How to Use the Finance & Accounting Command Center
1️⃣ Download All Files – After purchase, download the bundle ZIP containing all 8 templates instantly.
2️⃣ Open in Your Preferred Platform – Launch Excel files in Microsoft Excel, Power BI files in Power BI Desktop, and Google Sheets via the provided link.
3️⃣ Enter Your Financial Data – Replace demo data with your actual income, expenses, budgets, and revenue figures.
4️⃣ Analyze & Monitor KPIs – Use interactive dashboards, slicers, and charts to track financial performance in real time.
5️⃣ Make Data-Driven Decisions – Identify cost-saving opportunities, forecast future spending, and optimize your financial strategy.
👥 Who Can Benefit from This Bundle?
💼 CFOs & Financial Controllers – Complete financial command center for executive decision-making
📊 Finance Managers & Analysts – Deep-dive analytics across budgeting, expenses, and revenue
🧾 Accountants & Auditors – Structured reporting tools for accurate financial tracking
🏢 Business Owners & Entrepreneurs – Affordable enterprise-grade financial tools
📈 Operations & Department Heads – Department-level budget monitoring and expense control
🎓 Finance Students & Educators – Practical templates for learning real-world financial management
🚀 Take Control of Your Finances Today!
8 Premium Templates | Was $102.92 → Now $64.99 | Save $37.93
📖 Click here to read the Detailed Blog Post
Visit our YouTube channel to learn step-by-step video tutorials
Youtube.com/@PKAnExcelExpert







Reviews
There are no reviews yet.