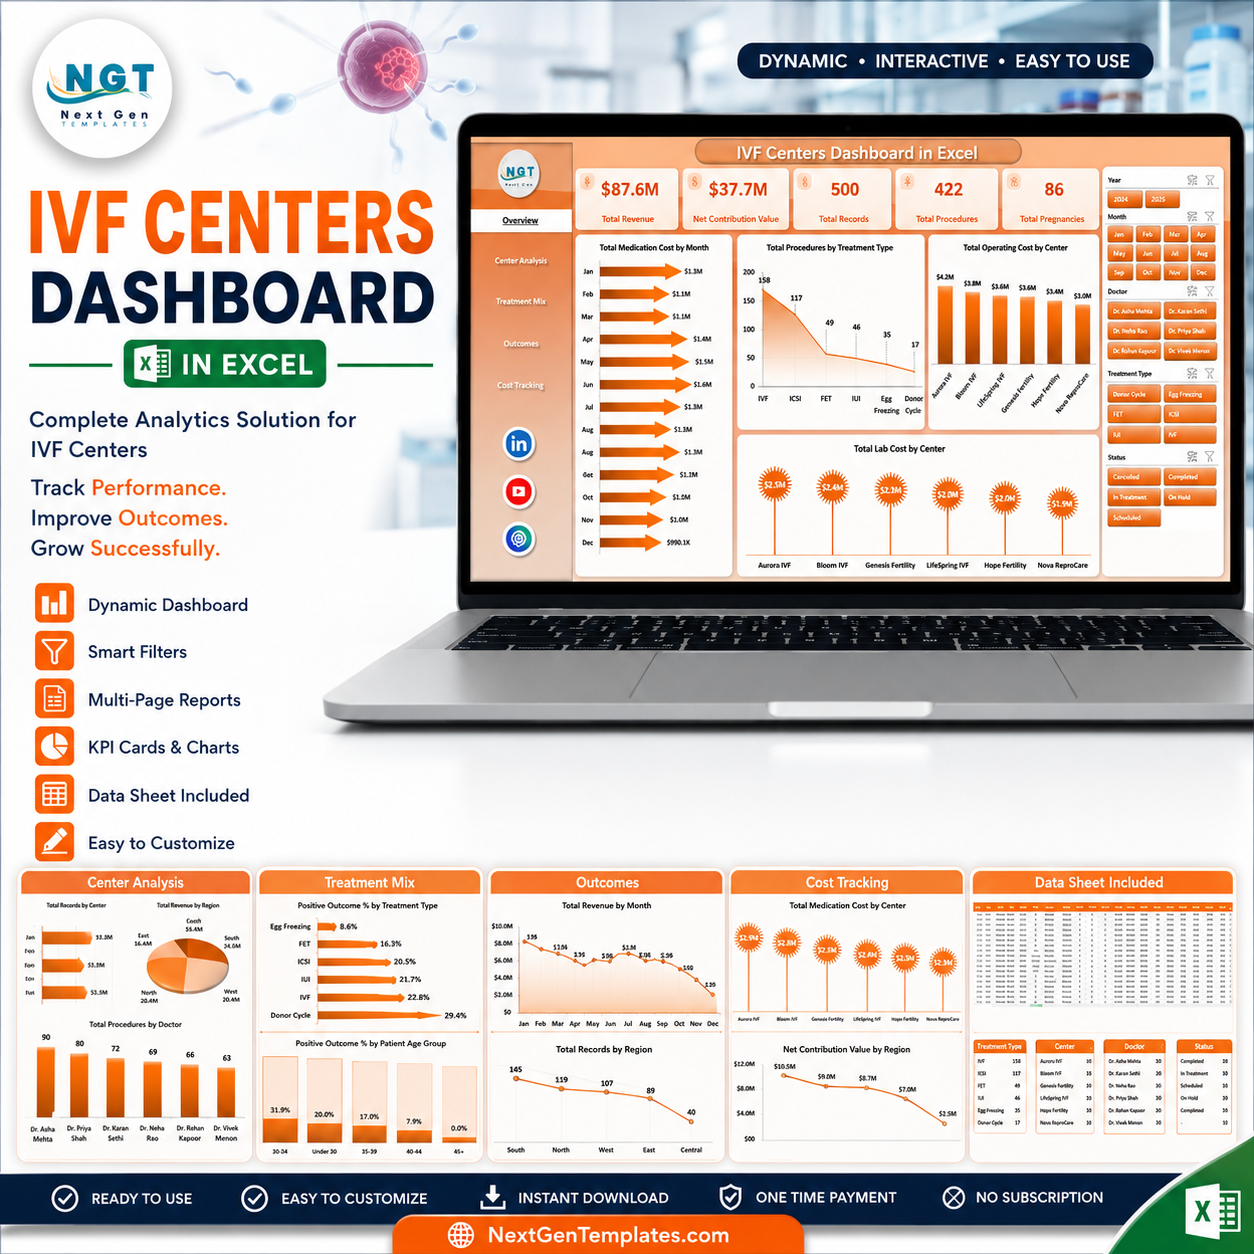
IVF Centers Dashboard in Excel helps fertility clinics turn procedure, revenue, cost, pregnancy, treatment, center, and doctor-level records into a clear management dashboard. CDC ART surveillance reported 435,426 ART cycles across 457 reporting U.S. clinics in 2022, which shows how important accurate clinic reporting has become for IVF operations. This template gives clinic managers a ready Excel structure, built-in sample data, multiple dashboard pages, and a risk-reducing workflow: replace the sample rows, refresh the workbook, and review the updated charts before making monthly decisions.
Key Features of IVF Centers Dashboard in Excel
- Seven worksheet tabs covering overview, center analysis, treatment mix, outcomes, cost tracking, source data, and support pivots.
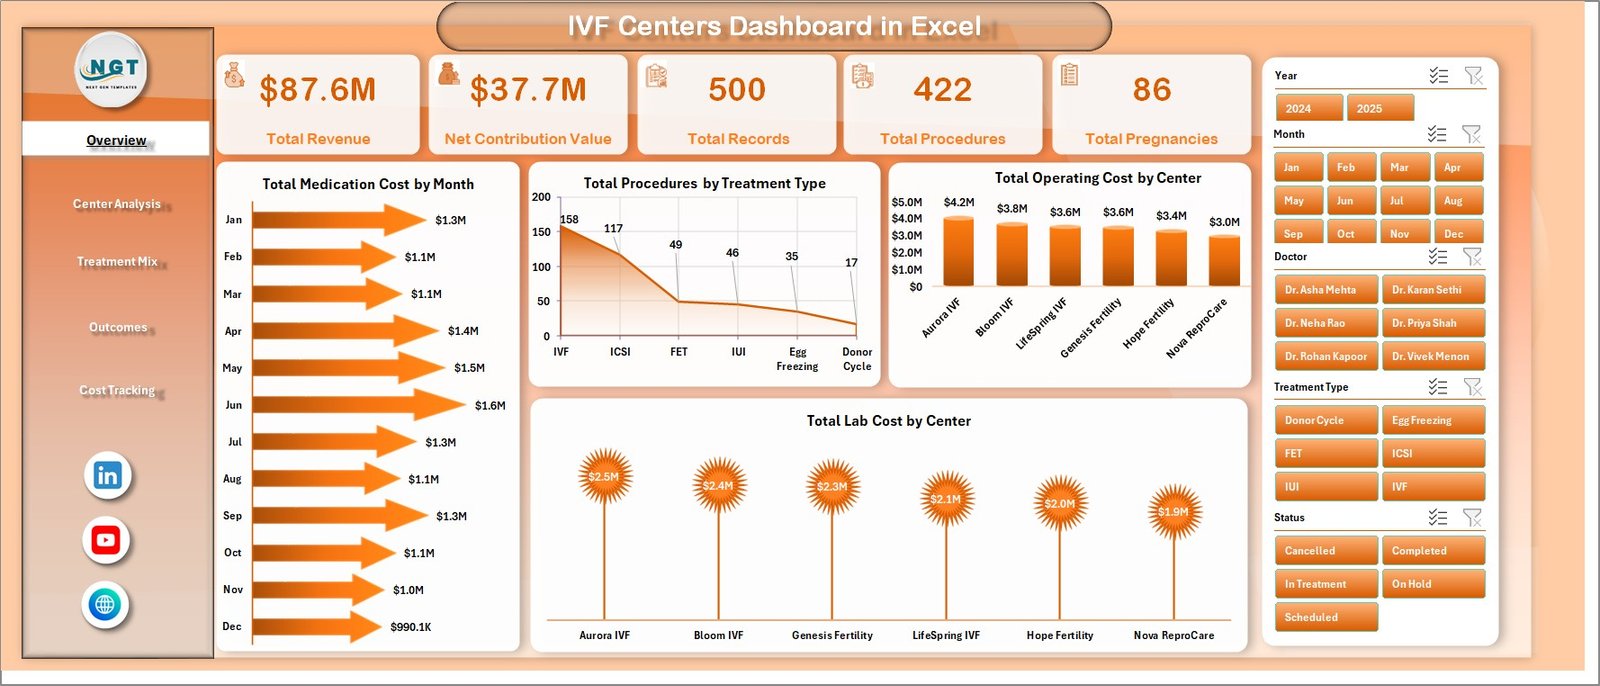
- High-level cards for Total Revenue, Net Contribution Value, Total Records, Total Procedures, and Total Pregnancies.
- Interactive slicers for quick filtering by clinic dimensions such as month, region, treatment type, center, doctor, and patient group.
- Cost and contribution analysis across medication cost, lab cost, operating cost, revenue, and net contribution.
- Outcome-focused views for pregnancy results, positive outcome percentage, patient age group, cycle stage, and source channel analysis.
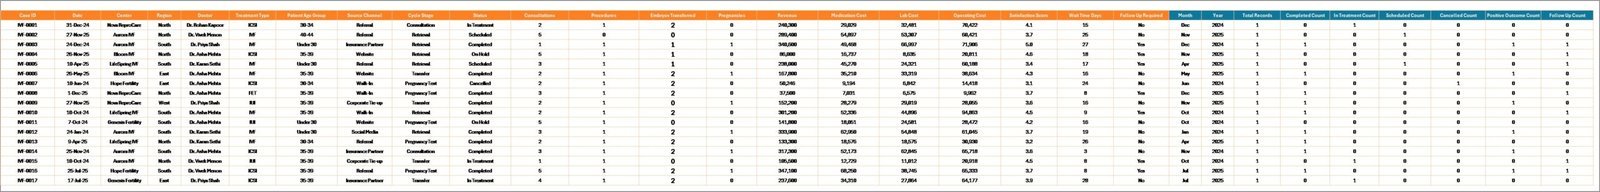
- Editable Excel data sheet so your team can paste new records in the same format and refresh all pivot-driven visuals.
IVF Centers Dashboard in Excel
What’s Inside the IVF Centers Dashboard in Excel
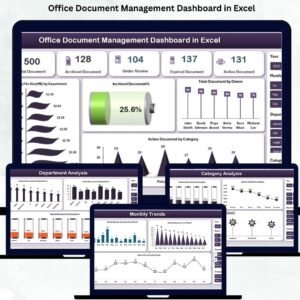
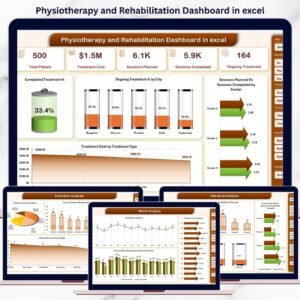
The workbook is built as a multi-page Excel reporting system for IVF center performance. The Overview Page gives leadership a fast read on revenue, net contribution, procedure volume, pregnancy volume, and record count. It also includes charts for Total Medication Cost by Month, Total Procedures by Treatment Type, Total Operating Cost by Center, and Total Lab Cost by Center.
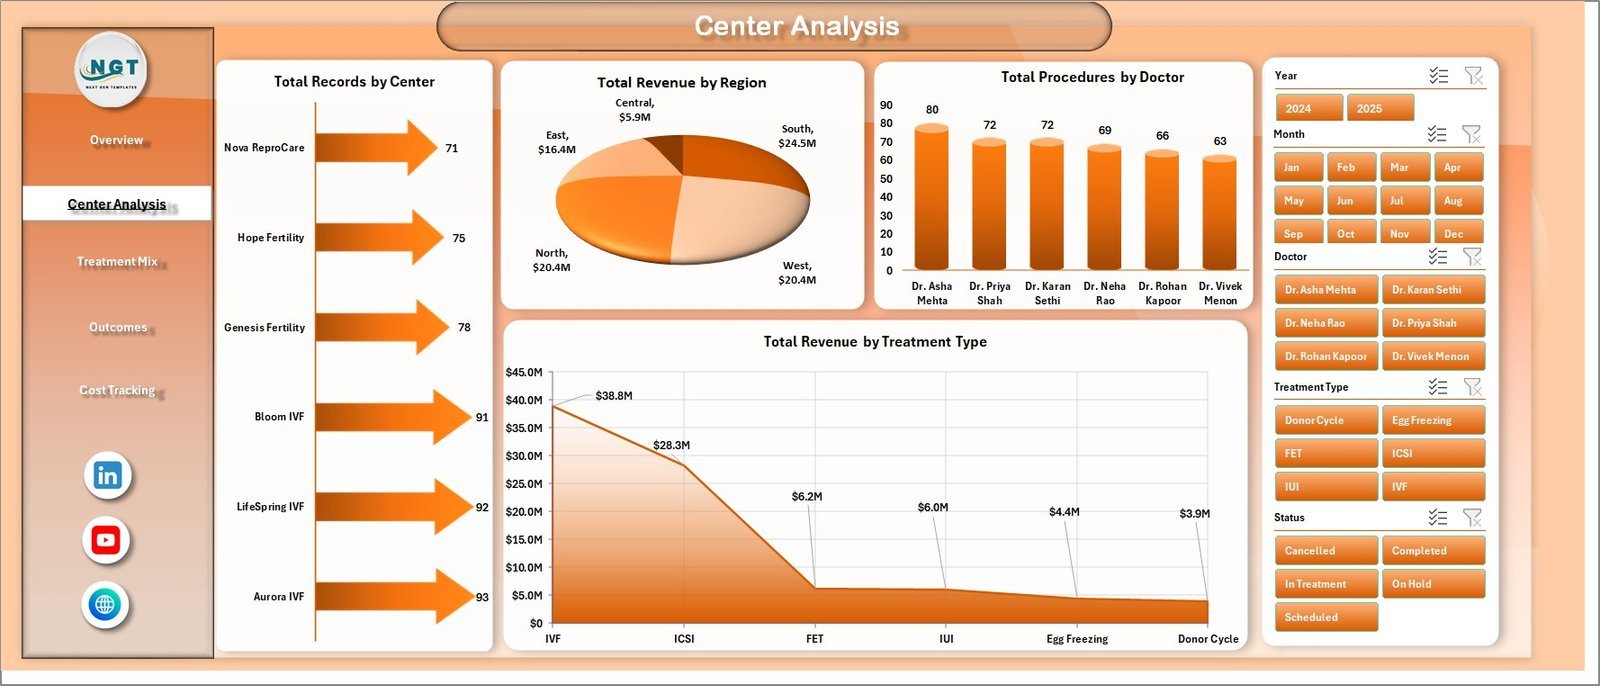
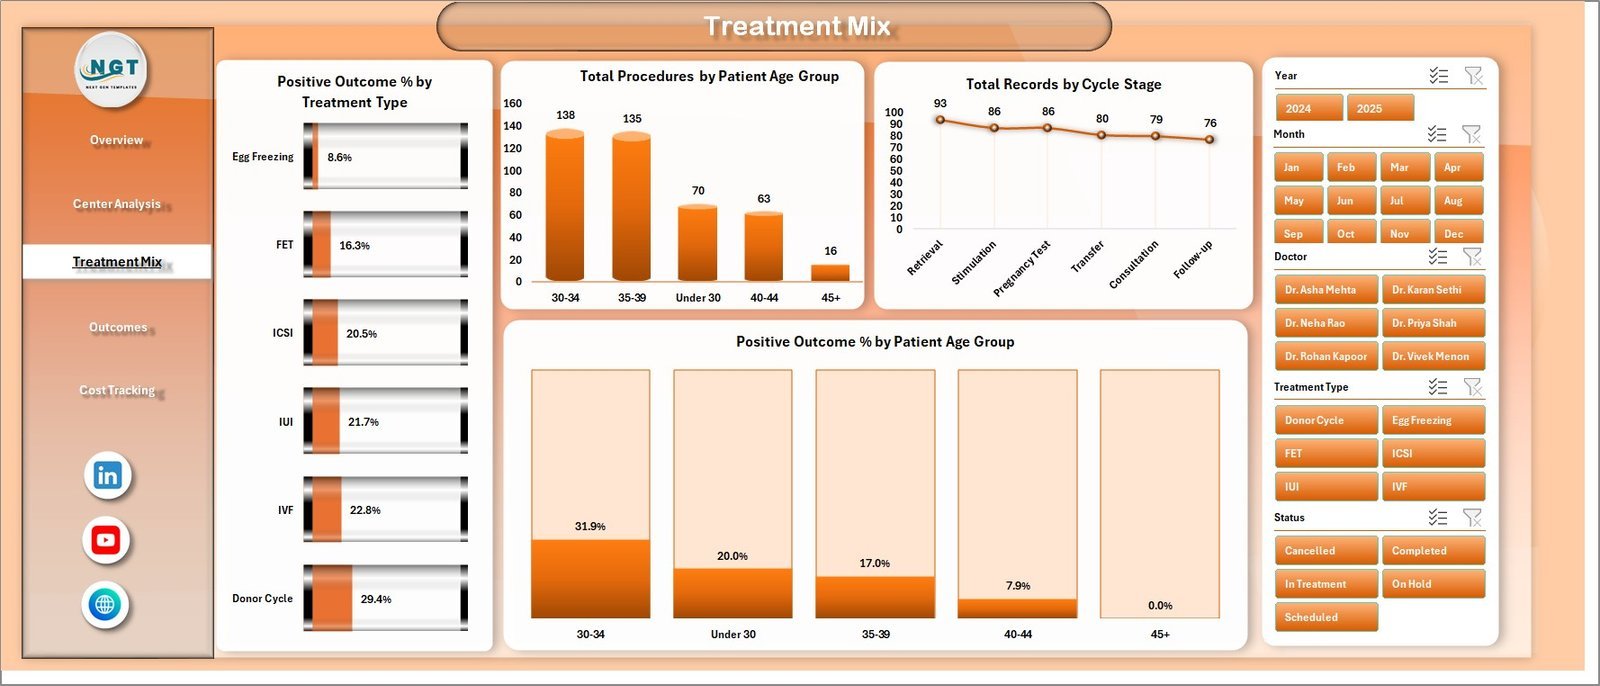
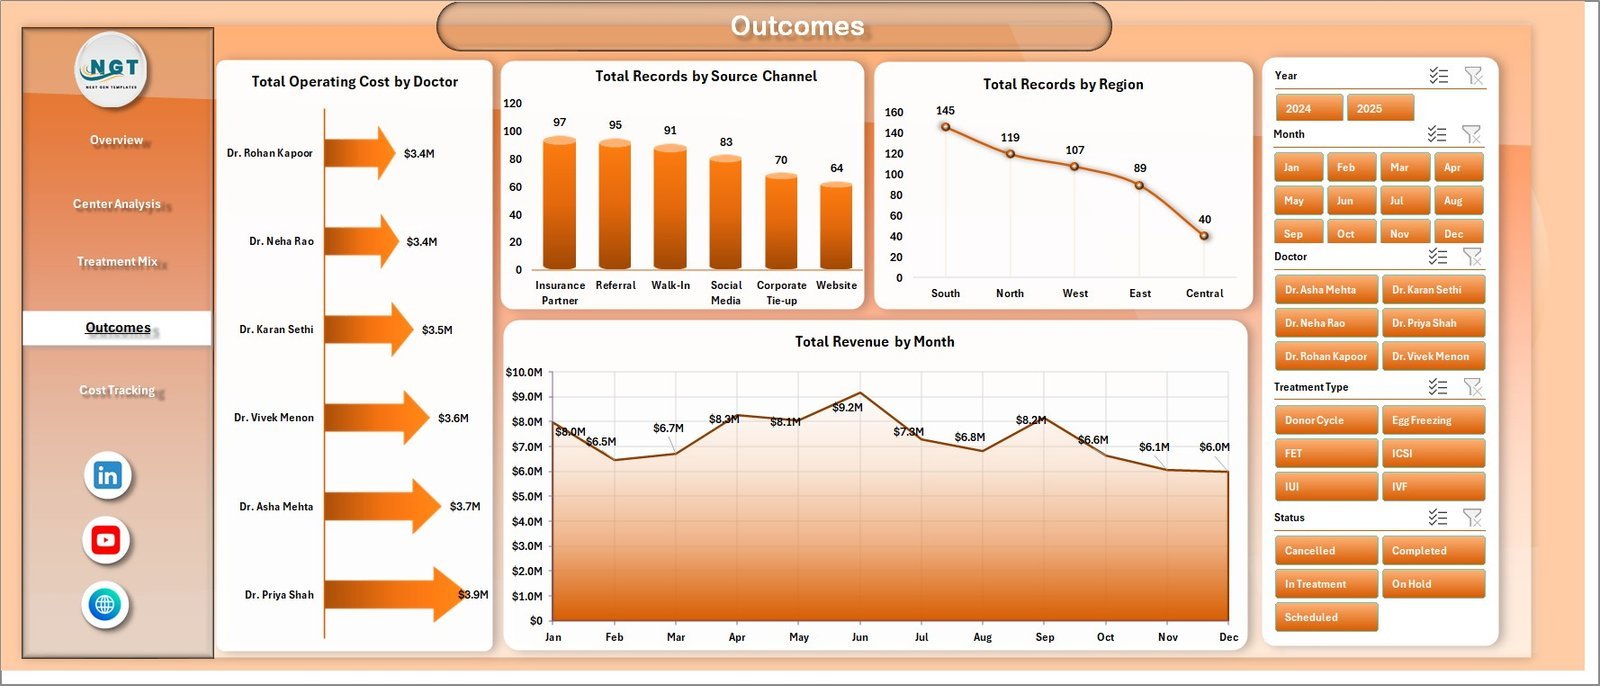
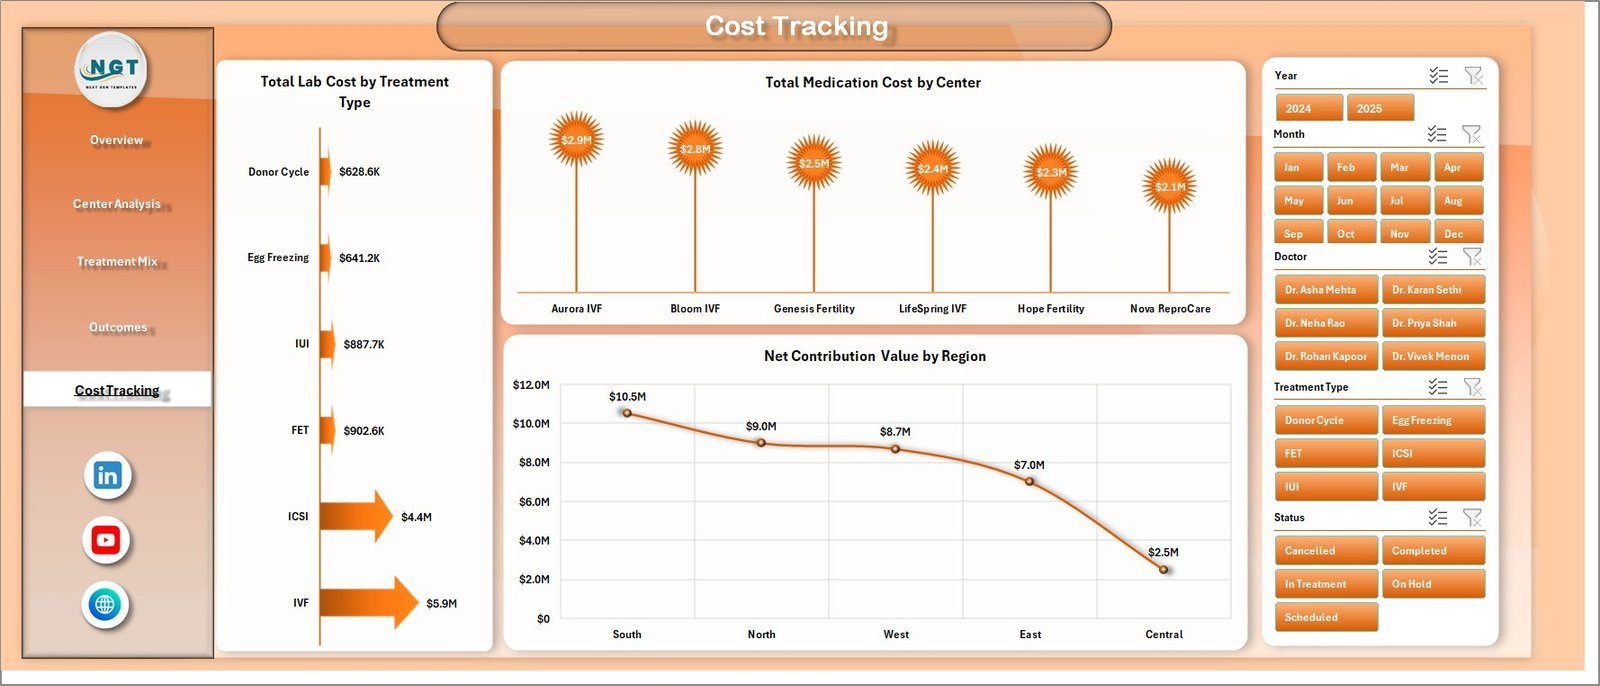
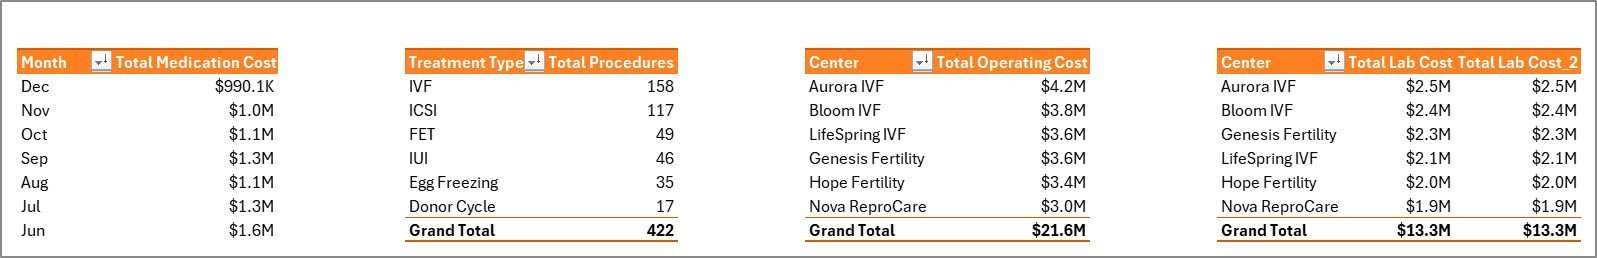
The Center Analysis page compares performance by center, region, doctor, and treatment type. The Treatment Mix page focuses on positive outcome percentage, treatment distribution, patient age group, and cycle stage. The Outcomes page combines operating cost by doctor, records by source channel, records by region, and revenue by month. The Cost Tracking page helps you monitor lab cost, medication cost, and net contribution by region. The Data Sheet stores the editable source table, while the Support Sheet holds the pivot tables that power the dashboards.
IVF Centers Dashboard in Excel vs. Google Sheets vs. Paid Healthcare SaaS – Where This Fits
| Area | This Excel Dashboard | Google Sheets Alternative | Paid Healthcare SaaS |
|---|---|---|---|
| Cost | One-time template purchase | Low cost, but may need rebuild | Monthly or annual subscription |
| Setup time | Start by replacing sample data | Requires layout and chart setup | Longer onboarding and configuration |
| Customization | Editable Excel formulas, pivots, and charts | Flexible but lighter Excel features | Often limited by vendor settings |
| Collaboration | Best for controlled offline or shared-drive reporting | Best for browser collaboration | Best for multi-user clinical workflows |
| Clinic analytics | Center, doctor, treatment, outcome, and cost views | Possible with manual build | Usually deeper but more expensive |
Who This Template Is For – and Who It’s Not For
This dashboard is useful for IVF center owners, fertility clinic administrators, finance teams, operations managers, and healthcare analysts who need a practical monthly reporting file. It is also a good fit for consultants who prepare clinic performance packs for multiple centers.
It is not a patient medical record system, billing system, appointment scheduler, or clinical decision tool. It does not replace your EMR, consent process, laboratory system, or regulated medical reporting. It is a business and operations dashboard for internal analysis.
How to Use the IVF Centers Dashboard in Excel
- Open the Excel file and review the sample data structure.
- Go to the Data Sheet and replace the sample rows with your IVF center records.
- Keep the same column format so pivots and charts can read the data correctly.
- Open Excel’s Data tab and click Refresh All.
- Use slicers on each dashboard page to filter by time period, center, region, treatment type, doctor, age group, or source channel.
- Review the Overview, Center Analysis, Treatment Mix, Outcomes, and Cost Tracking pages before sharing results.
Real-World Use Cases
Clinic Director Ananya uses the Overview page before monthly leadership meetings to compare revenue, procedures, pregnancies, and cost patterns. Finance Manager David uses Cost Tracking to identify which centers or treatment types are driving medication, lab, and operating cost changes. Operations Analyst Meera uses Treatment Mix and Outcomes to compare positive outcome percentage by treatment type and patient age group.
Frequently Asked Questions
Can I use this dashboard for multiple IVF centers?
Yes. The template includes center and region analysis, so you can compare multiple centers as long as your data uses a consistent structure.
Does this file include sample data?
Yes. It includes a Data Sheet with sample records that you can replace with your own clinic data.
Do the charts update automatically?
The workbook uses pivot tables and charts. After updating the Data Sheet, click Refresh All from the Excel Data tab to update the dashboard.
Can I hide the support sheet?
Yes. The Support Sheet contains pivot tables used by the dashboard, and it can remain hidden after setup.
Is this a medical reporting system?
No. It is an Excel dashboard for business, operations, cost, and management analysis. It is not a clinical diagnosis or regulated reporting system.
Can I edit the workbook?
Yes. You can adjust the data, labels, charts, and formulas based on your reporting process.
About the Author
Built by PK – Microsoft Certified Professional with 15+ years of Excel, Google Sheets, and Power BI experience. Founder of NextGenTemplates, reaching 300K+ subscribers across YouTube channels. Every template is hand-built and tested before release.
Explore Related Templates
For nearby healthcare analytics templates, see the IVF Centers KPI Dashboard in Excel, Home Healthcare KPI Dashboard in Excel, and Healthcare Project Timeline KPI Dashboard in Excel. You can also browse the Excel Dashboard templates and MS Excel templates categories.
Download the IVF Centers Dashboard in Excel today and build a cleaner reporting workflow for IVF center performance, cost, treatment mix, and outcomes.
Last updated: June 27, 2026.


Reviews
There are no reviews yet.