

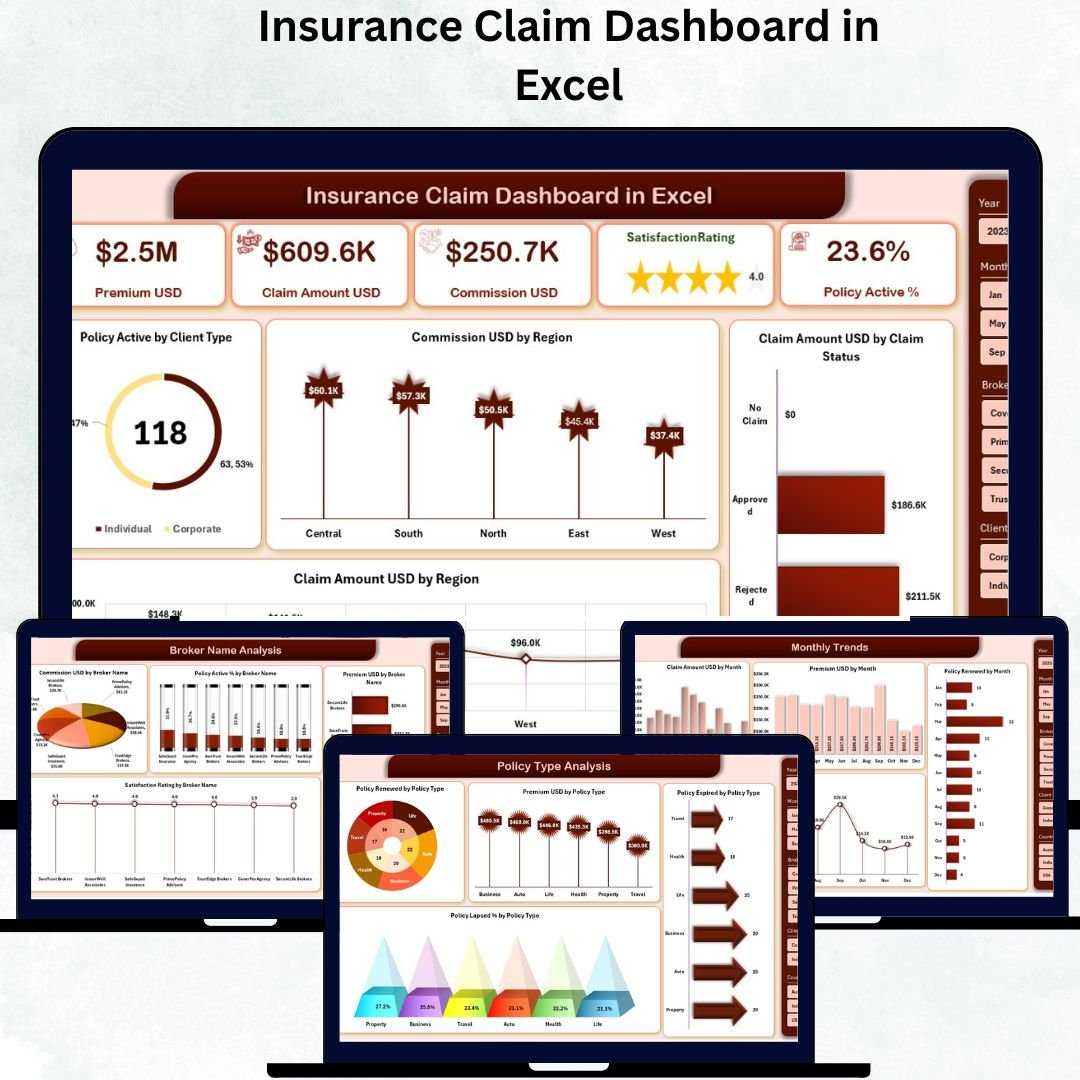

In the dynamic insurance industry, every decision revolves around data. From tracking policies to managing claims and commissions, insurance professionals deal with huge datasets daily. The Insurance Claim Dashboard in Excel is a ready-to-use, interactive tool that transforms this complex data into clear insights, enabling smarter, faster decisions — all within Microsoft Excel.
This powerful Excel-based dashboard helps insurance companies, agencies, and brokers visualize and monitor key performance indicators (KPIs) such as total claims, active policies, premiums, commissions, and customer satisfaction. Built with user-friendly navigation, dynamic slicers, and automated charts, it simplifies performance analysis without requiring advanced software or coding knowledge.
Whether you’re managing client portfolios or auditing regional performance, this dashboard gives you a 360° view of your insurance operations — helping you track what matters most, in real time.
⚙️ Key Features of the Insurance Claim Dashboard in Excel
📊 Multiple Analytical Pages – Overview, Broker Analysis, Policy Type, Country Analysis, Monthly Trends.
📈 Interactive Slicers – Filter data by region, broker, time, or policy type.
📋 Five Core KPIs – Active Policies, Total Claims, Commissions, Premiums, and Renewals.
📍 Dynamic Charts – Analyze claim amount, satisfaction ratings, and policy trends visually.
📎 Support & Data Sheets – Maintain data consistency with well-structured back-end design.
💡 Automatic Refresh – All visuals and KPIs update instantly when new data is entered.
🧩 Customizable Design – Add new metrics, visuals, or filters easily.
📊 Pivot Table Integration – Enables deeper analysis without manual recalculations.
💻 No Coding Required – 100% Excel-based solution for all experience levels.
📤 Export-Ready Reports – Save or print visuals for presentations and management reviews.
🧭 Dashboard Pages and Structure
🏠 1️⃣ Overview Page – Business Summary
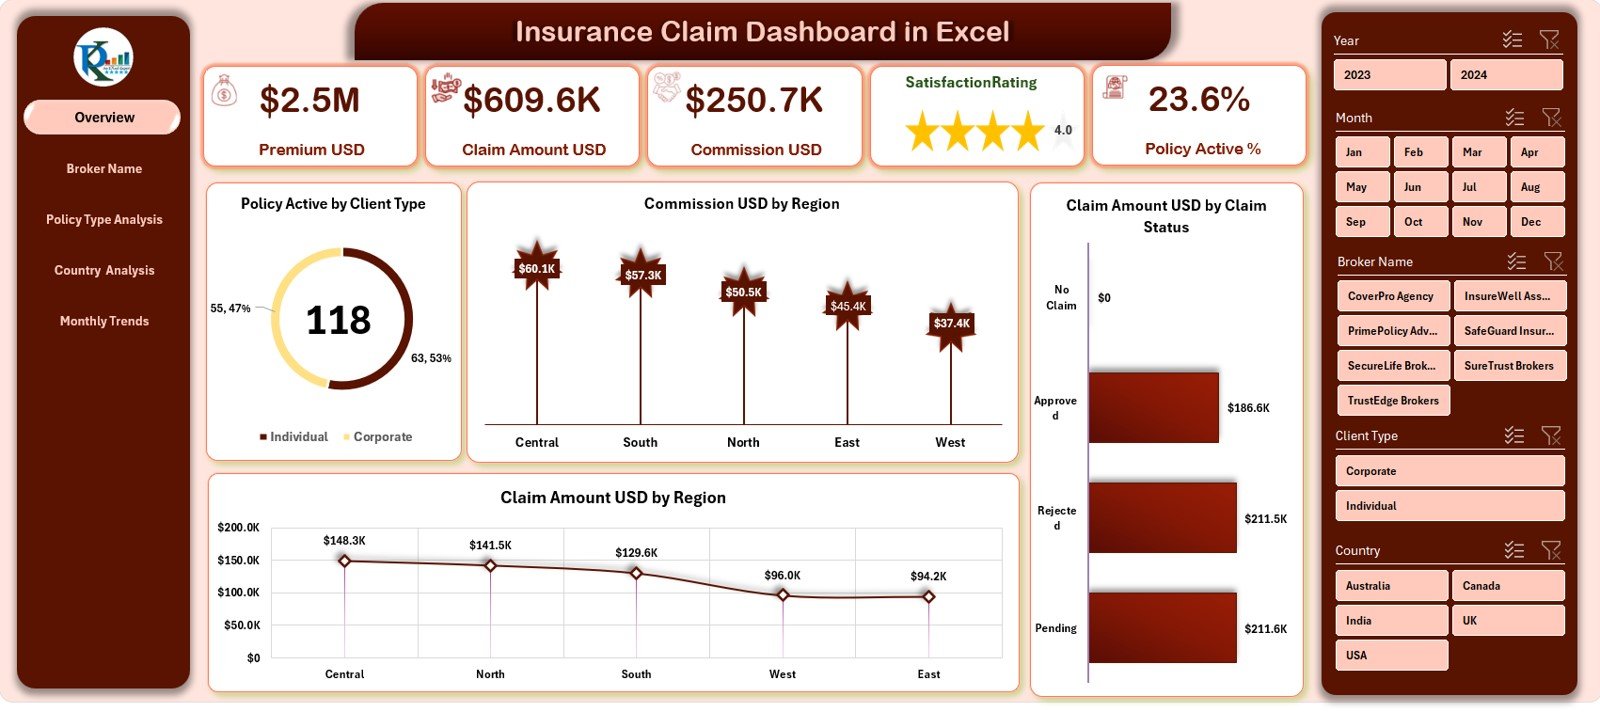
This is the main dashboard page that provides a comprehensive summary of business performance.
Slicers: Located on the right to filter data by Month, Region, Broker, or Policy Type.
KPI Cards: Display Total Claims, Premiums, Commissions, and Active Policies.
Visual Charts:
Policy Active % by Client Type
Commission (USD) by region
Claim Amount (USD) by region
Claim Amount (USD) by Claim Status
💡 Purpose: Gives management an instant, data-driven view of insurance operations.
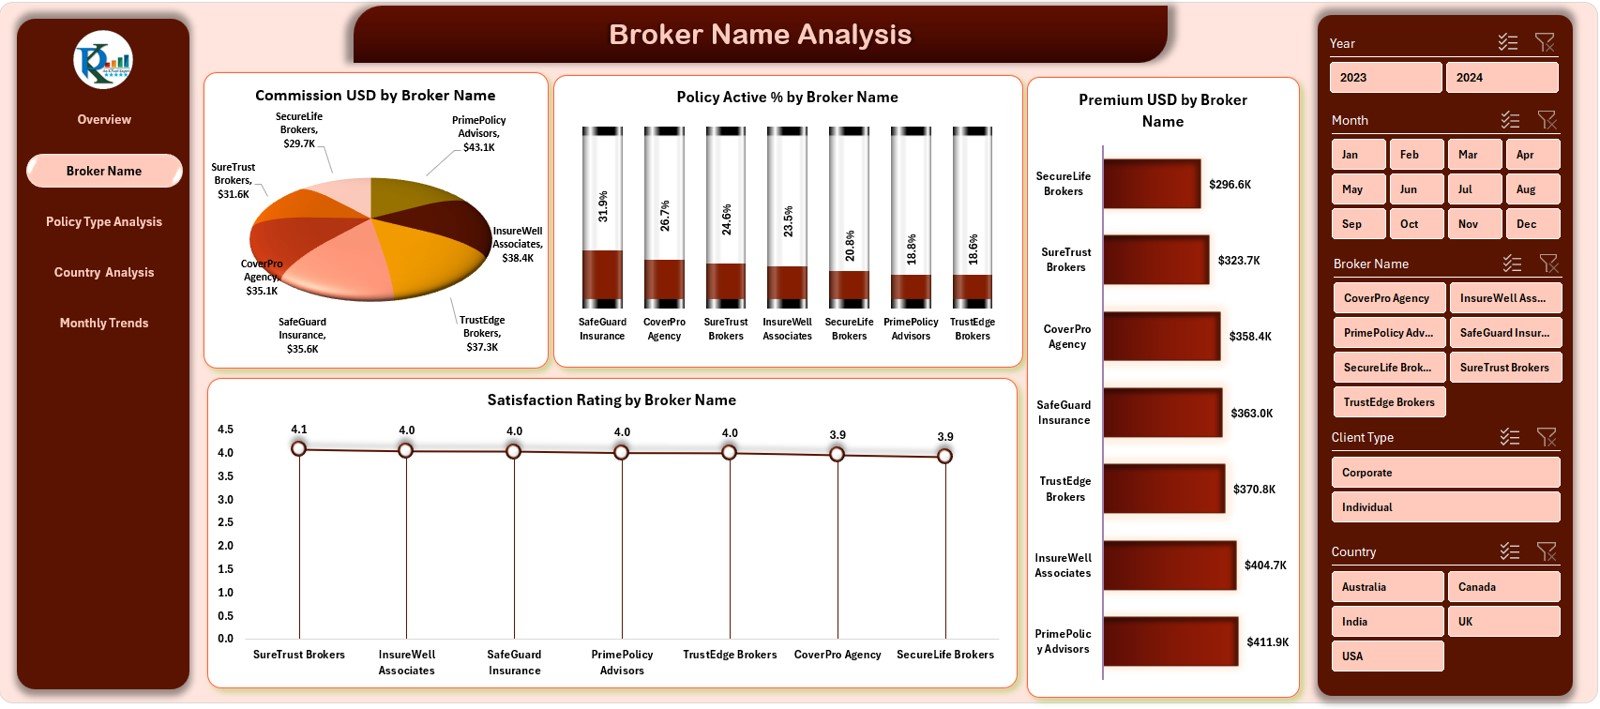
👔 2️⃣ Broker Name Analysis – Performance by Broker
This section focuses on evaluating broker efficiency.
Charts Display:
Commission by Broker Name
Policy Active % by Broker
Satisfaction Rating by Broker
Premium by Broker
🏆 Outcome: Identify top-performing brokers and discover areas for improvement.
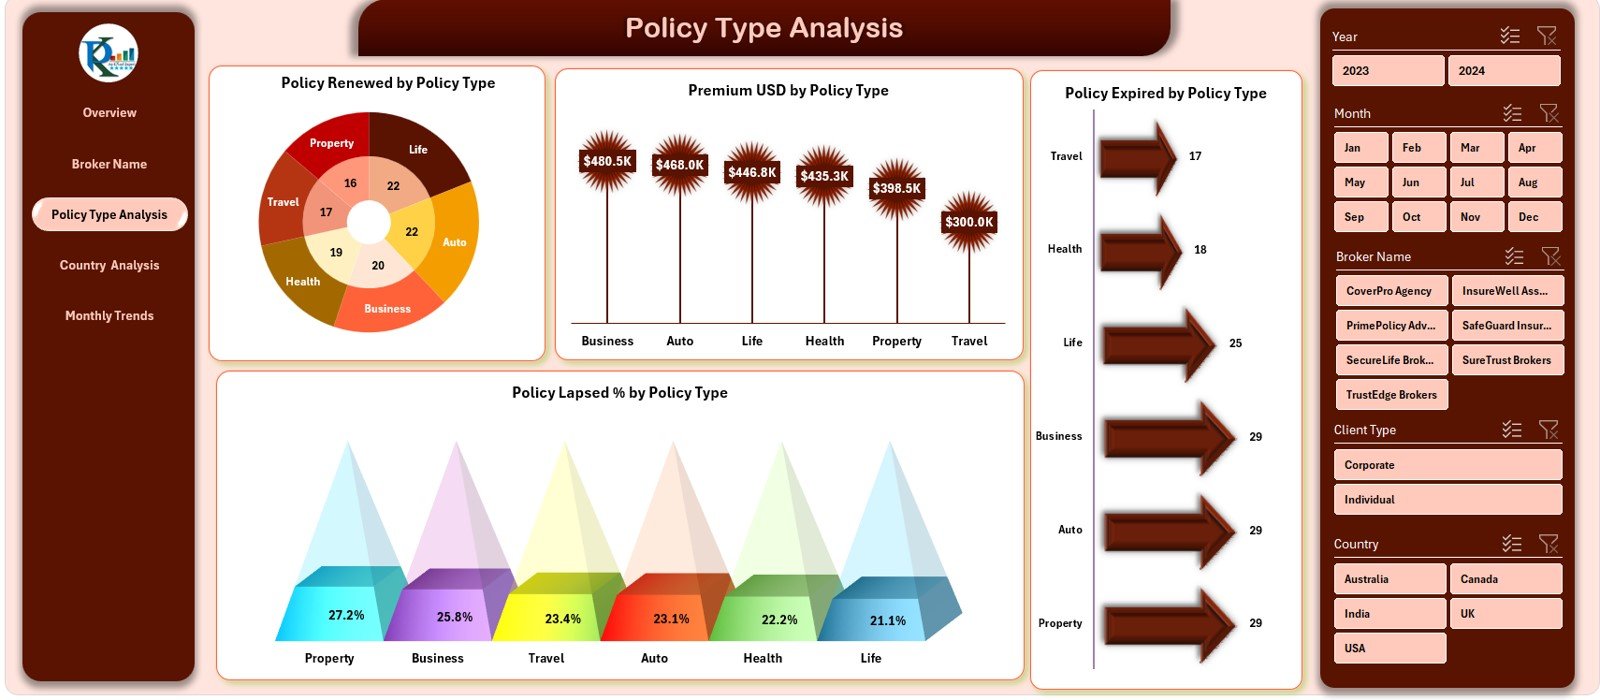
📜 3️⃣ Policy Type Analysis – Product Portfolio Insight
Understand how each policy type performs in terms of renewals, lapses, and revenue.
Charts Include:
Policies Renewed by Policy Type
Premium (USD) by Policy Type
Policy Lapsed % by Type
Policy Expired by Type
🎯 Outcome: Detect profitable policy categories and manage underperforming ones.
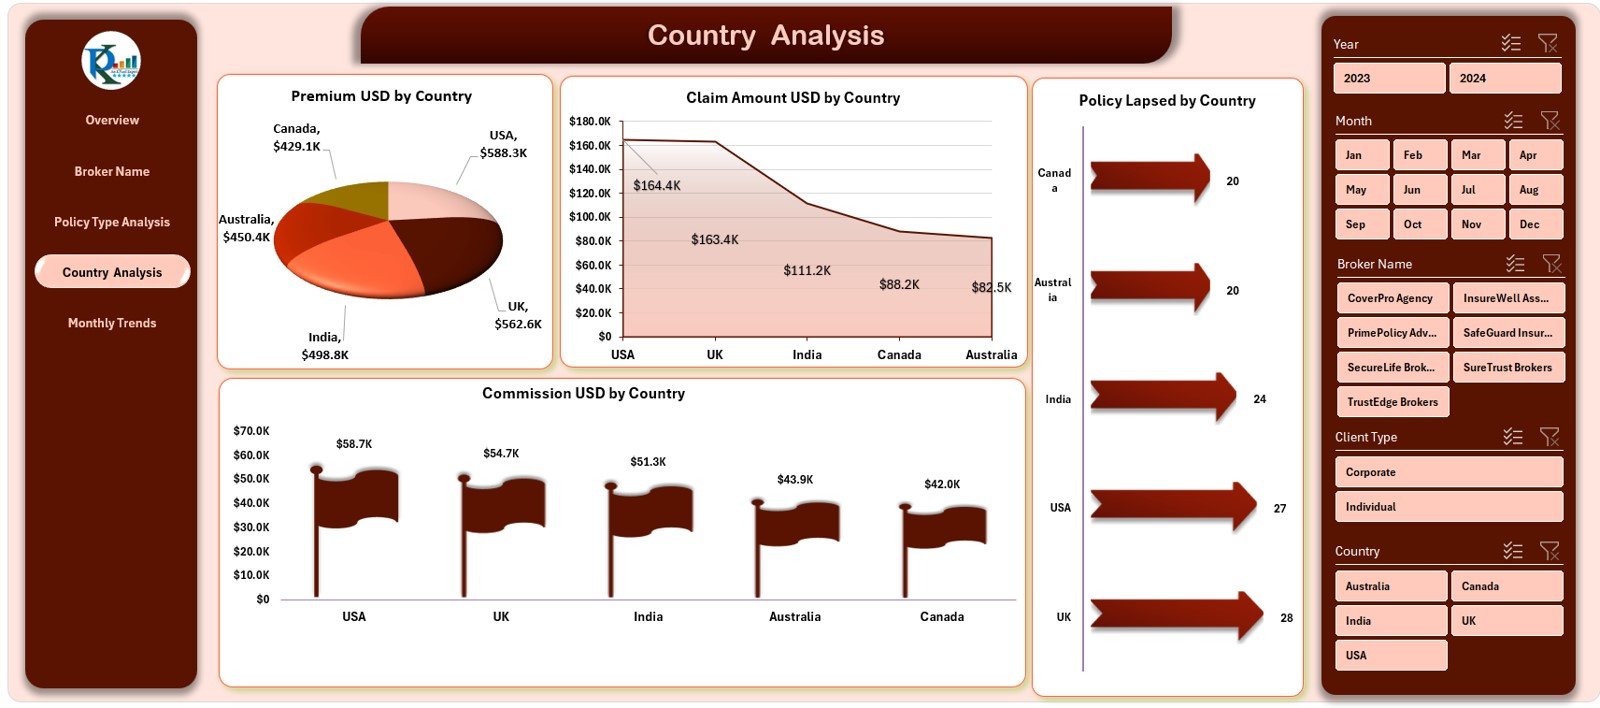
🌍 4️⃣ Country Analysis – Regional Comparison
Visualize country-wise performance across key KPIs.
Charts Include:
Premium by Country
Claim Amount by Country
Commission by Country
Policy Lapsed by Country
📊 Outcome: Pinpoint high-growth regions and monitor claim trends geographically.
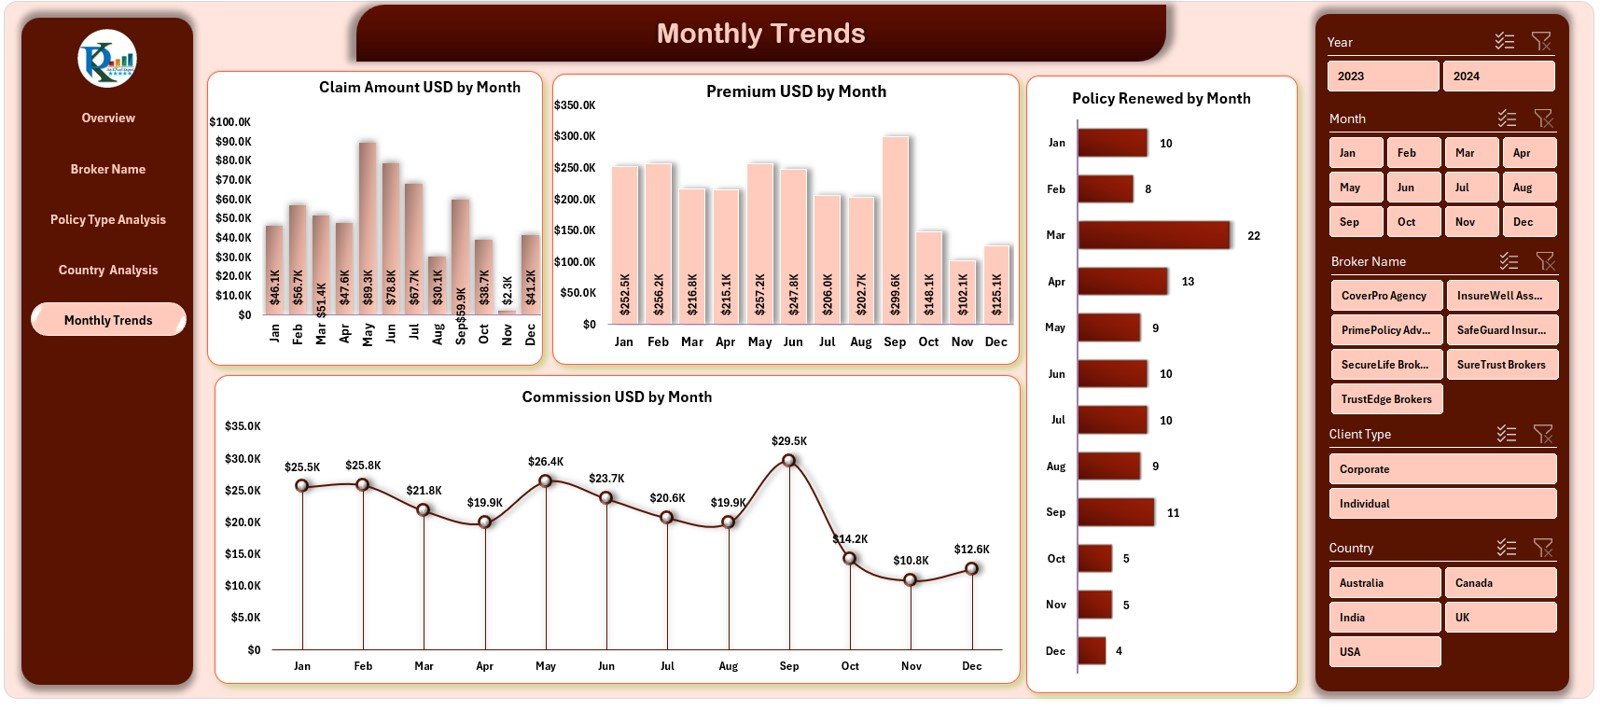
📅 5️⃣ Monthly Trends – Track Over Time
Analyze performance evolution month by month.
Charts Include:
Claim Amount by Month
Premium by Month
Commission by Month
Policy Renewed by Month
📈 Outcome: Spot seasonality, forecast future trends, and measure month-on-month growth.
📘 6️⃣ Support Sheet & Data Sheet – The Backend Engine
Support Sheet: Stores reference data (Regions, Policy Types, Claim Status).
Data Sheet: Holds transactional data (Policy No., Broker, Claim Amount, Premium, Commission, Rating).
⚙️ Purpose: Keeps the dashboard running smoothly and ensures clean data integration.
🌟 Advantages of Using the Insurance Claim Dashboard in Excel
✅ Centralized Reporting – Consolidate claims, policies, and commissions in one file.
✅ Instant Insights – Visualize live data through automated pivot charts.
✅ Enhanced Decision-Making – Identify performance gaps by region, broker, or policy type.
✅ Transparent & Collaborative – Shared access ensures everyone works from the same version.
✅ Affordable Solution – Get Bi-level analytics without expensive tools.
✅ Fully Customizable – Adapt it to your business model and KPIs.
✅ Professional Visuals – Create audit-ready, management-level reports effortlessly.
💡 Best Practices for Maximum Value
📌 Validate and clean raw data before import.
📌 Update data weekly or monthly for up-to-date insights.
📌 Use conditional formatting for alerts and trends.
📌 Protect sensitive data using Excel’s password and sheet-lock features.
📌 Add KPI definition notes for clear understanding.
📌 Keep consistent currency formats across all pages.
🧠 Who Can Use This Dashboard
🏢 Insurance Companies – To track claims, policies, and commissions.
💼 Brokerage Firms – To monitor broker and region-wise performance.
📊 Risk Managers – To identify policy lapses or high claim ratios.
💻 Finance Teams – To analyze revenue from premiums and commissions.
👥 Executives – To visualize trends and support strategic decisions.





























Reviews
There are no reviews yet.