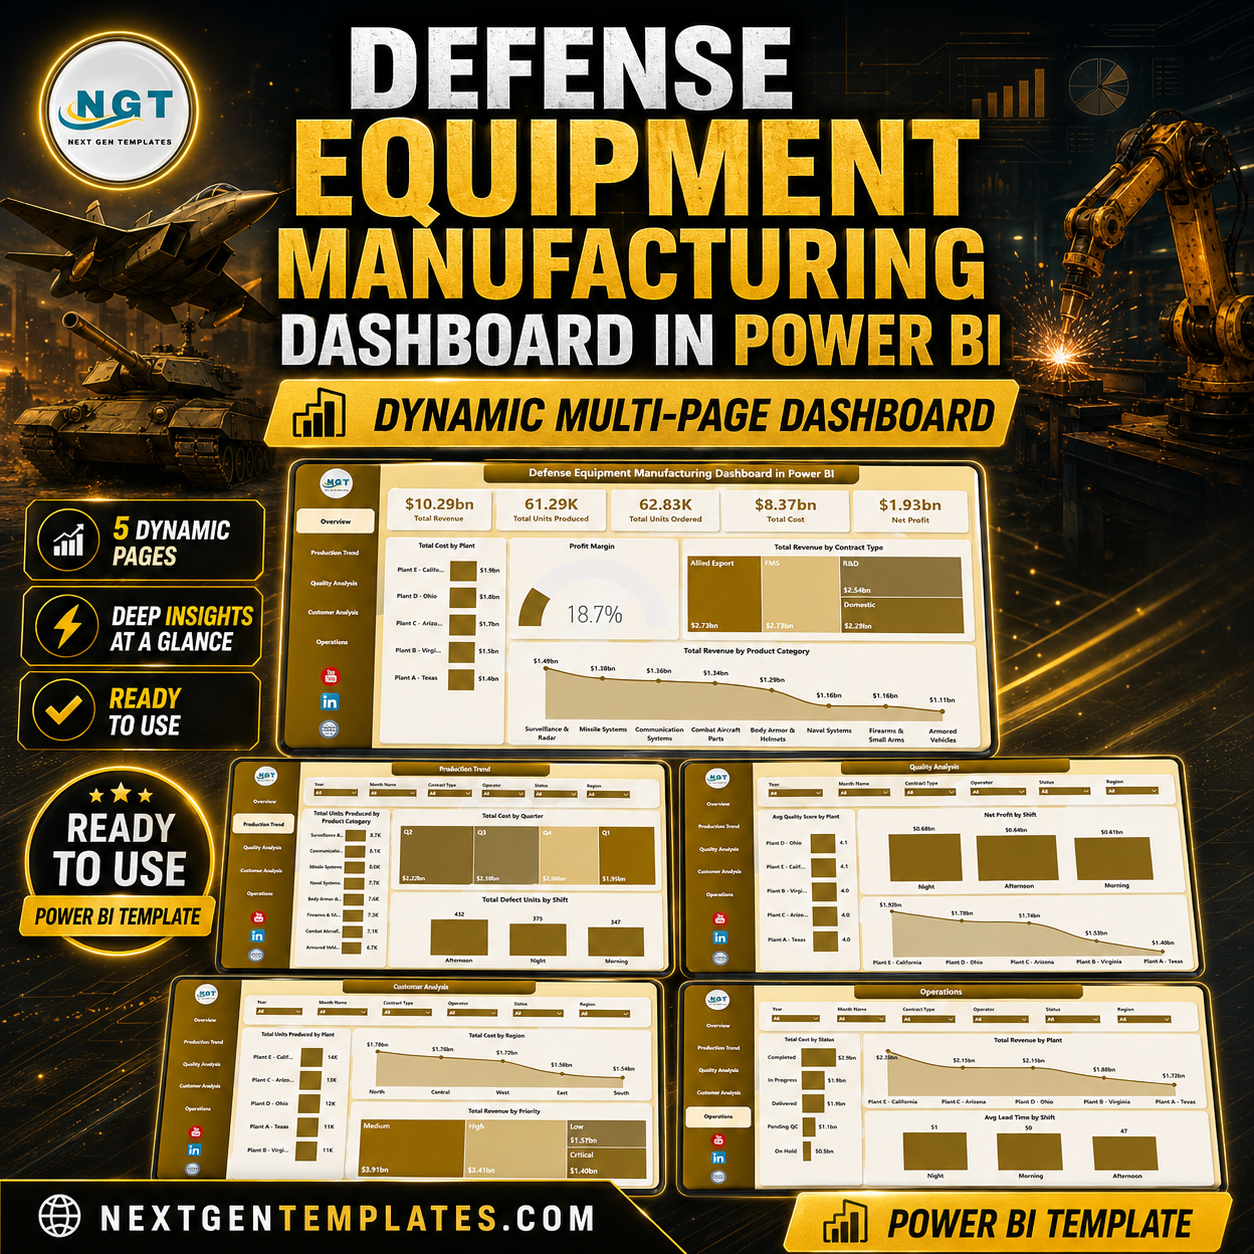


Defense Equipment Manufacturing Dashboard in Power BI helps manufacturing leaders, defense suppliers, plant managers, quality teams, and operations analysts monitor 5 executive KPIs, 5 report pages, production trends, cost movement, revenue by contract type, quality scores, lead time, and plant performance in one editable Power BI report. Instead of building visuals from scratch or paying for a large manufacturing analytics rollout, this template gives you a ready-made .pbix dashboard with slicers, cards, and page-level analysis. Instant download, lifetime access, one-time price, no subscription, and no per-user fees.
Key Features of Defense Equipment Manufacturing Dashboard in Power BI
- 5 Power BI pages: Overview, Production Trend, Quality Analysis, Customer Analysis, and Operations.
- Executive KPI cards: Total Revenue, Total Units Produced, Total Units Ordered, Total Cost, and Net Profit.
- Manufacturing visuals: Track revenue, cost, margin, production volume, defects, lead time, shift performance, region, priority, and plant trends.
- Interactive slicers: Filter the report quickly during production, finance, quality, or contract review meetings.
- Editable Power BI file: Update data sources, adjust measures, change visuals, and customize the layout for your internal reporting needs.
What’s Inside the Defense Equipment Manufacturing Dashboard in Power BI
1. Overview Page
The Overview page gives leadership a quick view of manufacturing performance through high-level cards for Total Revenue, Total Units Produced, Total Units Ordered, Total Cost, and Net Profit. Multiple slicers help users filter the full page quickly and review the dashboard by important operating dimensions.
Total Cost by Plant compares cost across manufacturing locations, making it easier to spot high-cost plants and investigate production, labor, or material drivers. Profit Margin shows how efficiently revenue converts into profit, which is useful for contract and pricing reviews.
Total Revenue by Contract Type helps compare revenue contribution by commercial, government, or other contract groupings. Total Revenue by Product Category shows which equipment categories are driving the highest revenue.
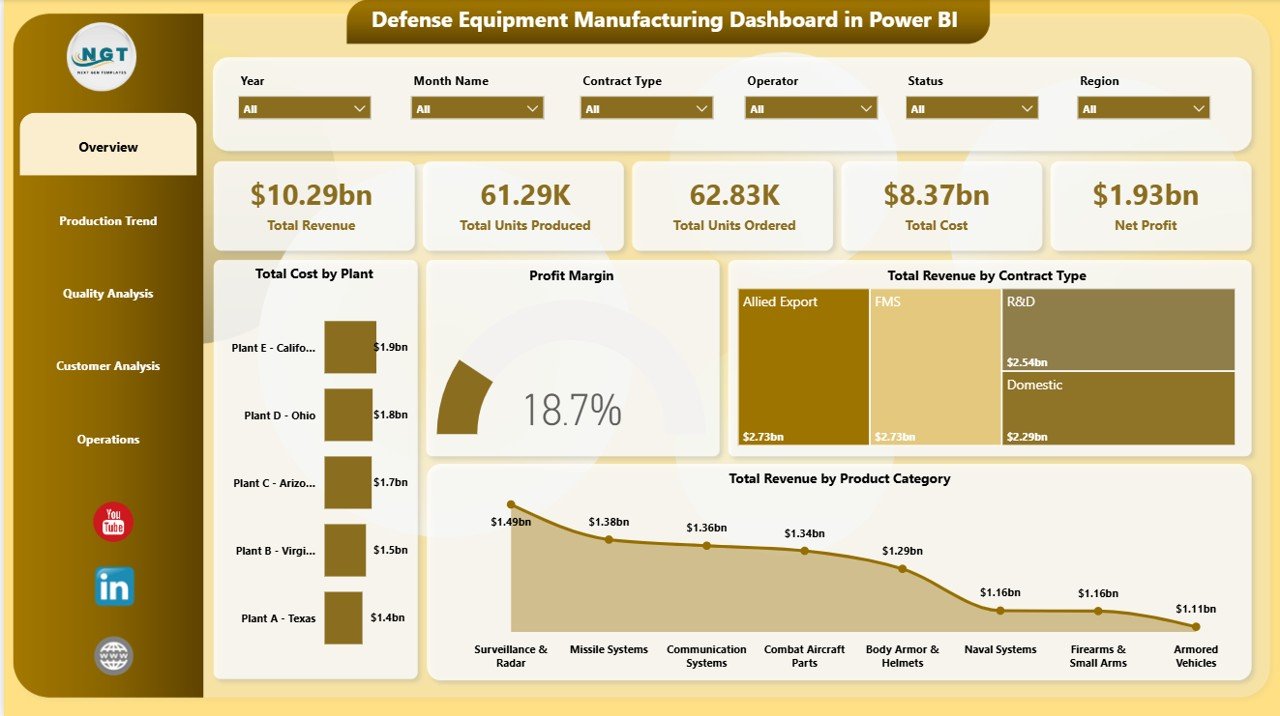
Defense Equipment Manufacturing Dashboard in Power BI
2. Production Trend
The Production Trend page focuses on production output, cost, and defect patterns across key manufacturing dimensions. It is useful for reviewing how output changes by product category, quarter, and shift.
Total Units Produced by Product Category highlights which defense equipment categories account for the highest production volume. Total Cost by Quarter shows cost movement over time and helps users compare quarterly spending patterns.
Total Defect Units by Shift identifies whether defect volume is concentrated in a specific shift. This supports better training, staffing, inspection, and process-control discussions.
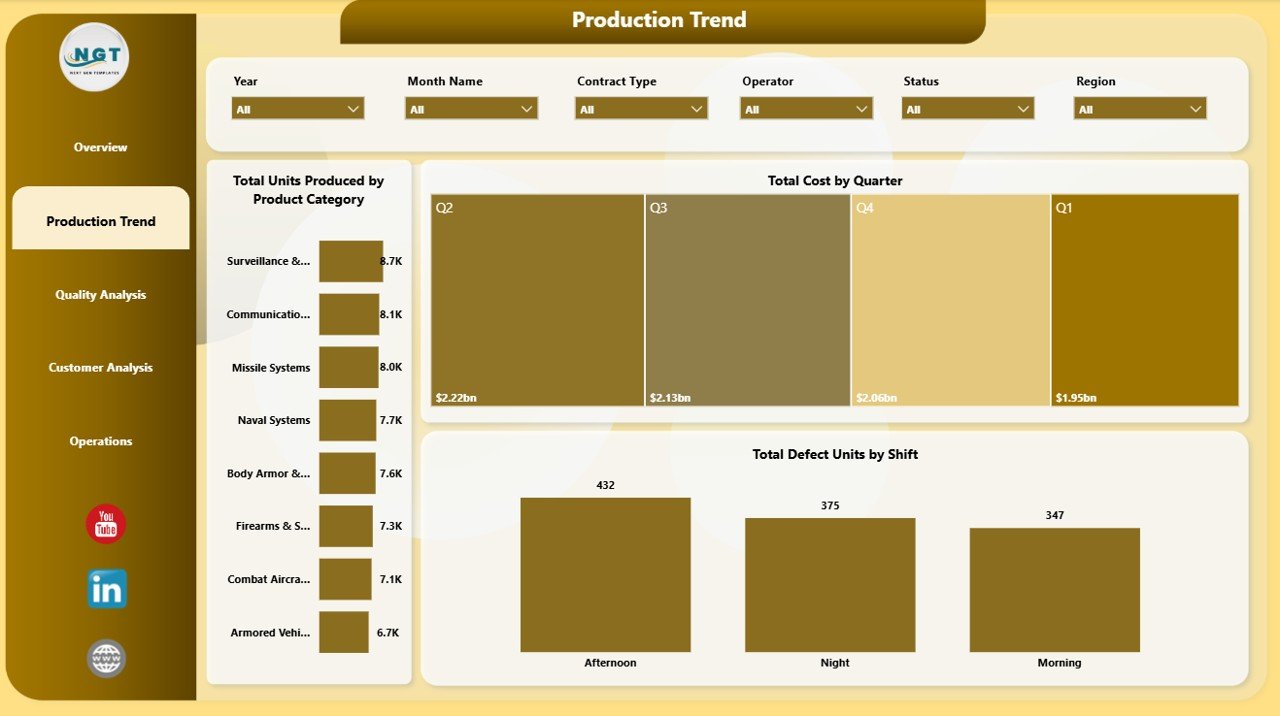
Production Trend
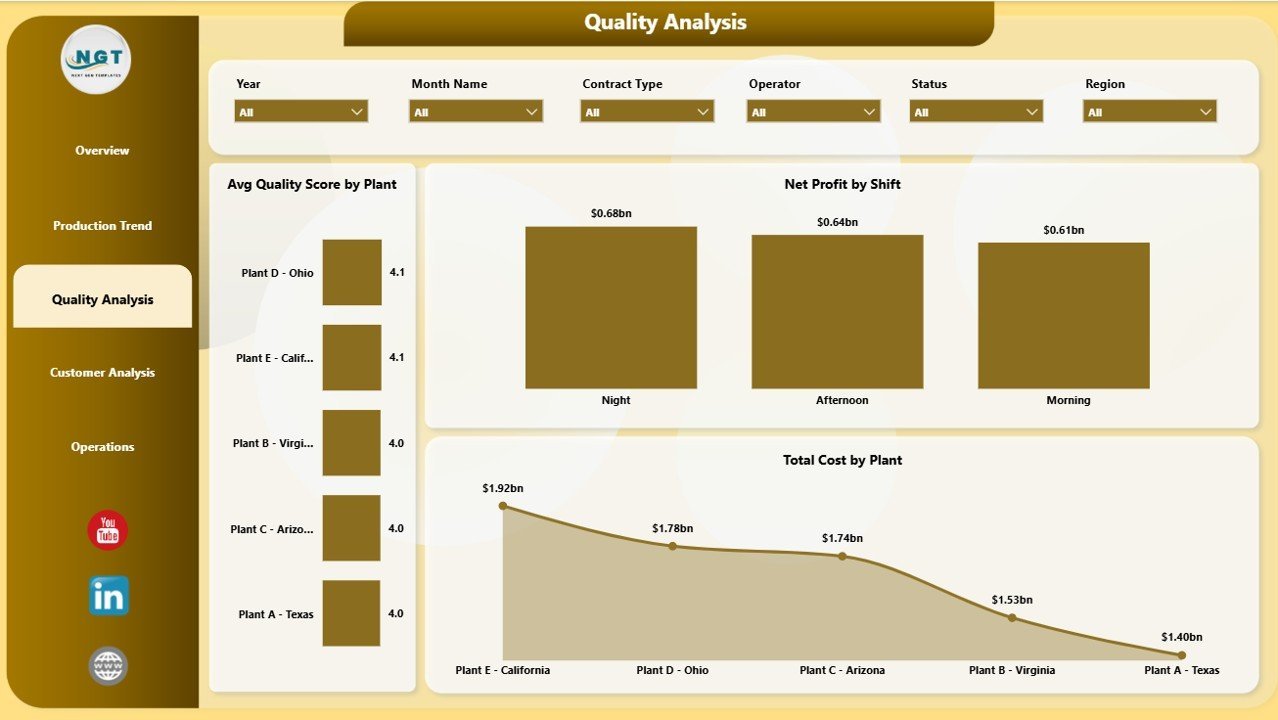
3. Quality Analysis
The Quality Analysis page connects quality score, shift profitability, and cost by plant so teams can review quality performance alongside financial impact. It helps quality leaders prioritize where deeper investigation is needed.
Avg Quality Score by Plant compares plant-level quality outcomes and helps identify sites that may need corrective action. Net Profit by Shift shows which operating shifts contribute more profit after cost.
Total Cost by Plant supports plant-level cost control and operational benchmarking. Together, these visuals help teams connect production quality with cost and profit performance.

Quality Analysis
4. Customer Analysis
The Customer Analysis page gives contract, region, and priority visibility for business review meetings. It helps users understand how manufacturing activity connects to customer demand and regional cost patterns.
Total Units Produced by Plant compares production contribution by facility and supports capacity planning. Total Cost by Region shows where cost is concentrated across regional operations.
Total Revenue by Priority helps teams understand how high-priority work contributes to overall revenue. This can support customer commitment, backlog, and contract-review discussions.
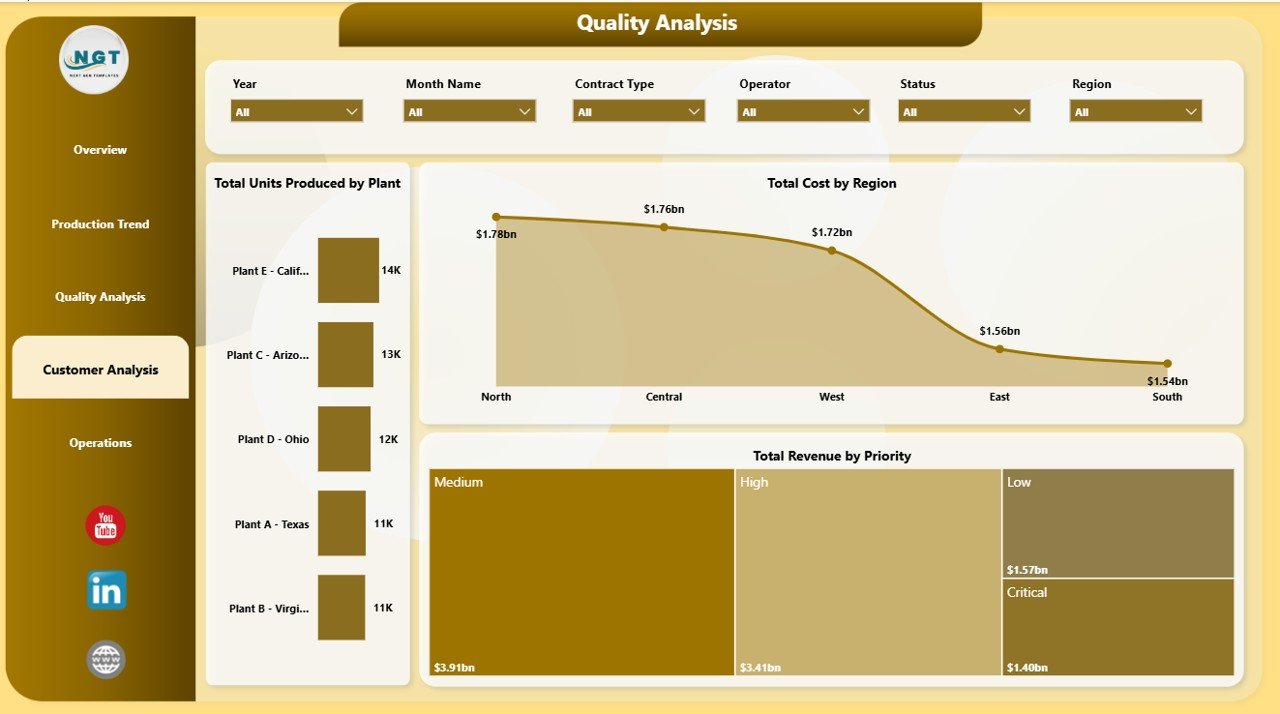
Customer Analysis
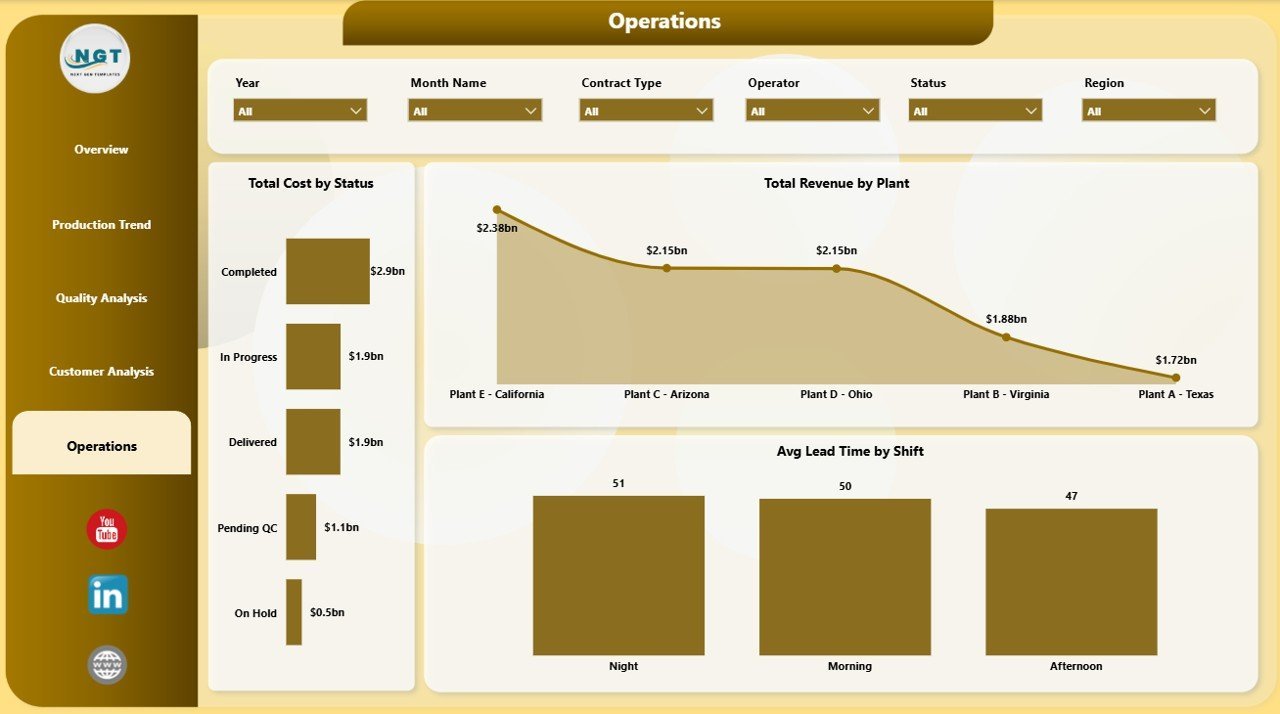
5. Operations
The Operations page focuses on status, plant revenue, and lead time by shift for day-to-day operating reviews. It is designed for production managers who need a fast read on execution and bottlenecks.
Total Cost by Status shows cost distribution by operational status and helps identify where work is tied up. Total Revenue by Plant compares plant revenue contribution across locations.
Avg Lead Time by Shift highlights differences in delivery speed or production cycle time by shift. This can guide staffing, scheduling, and workflow improvement actions.
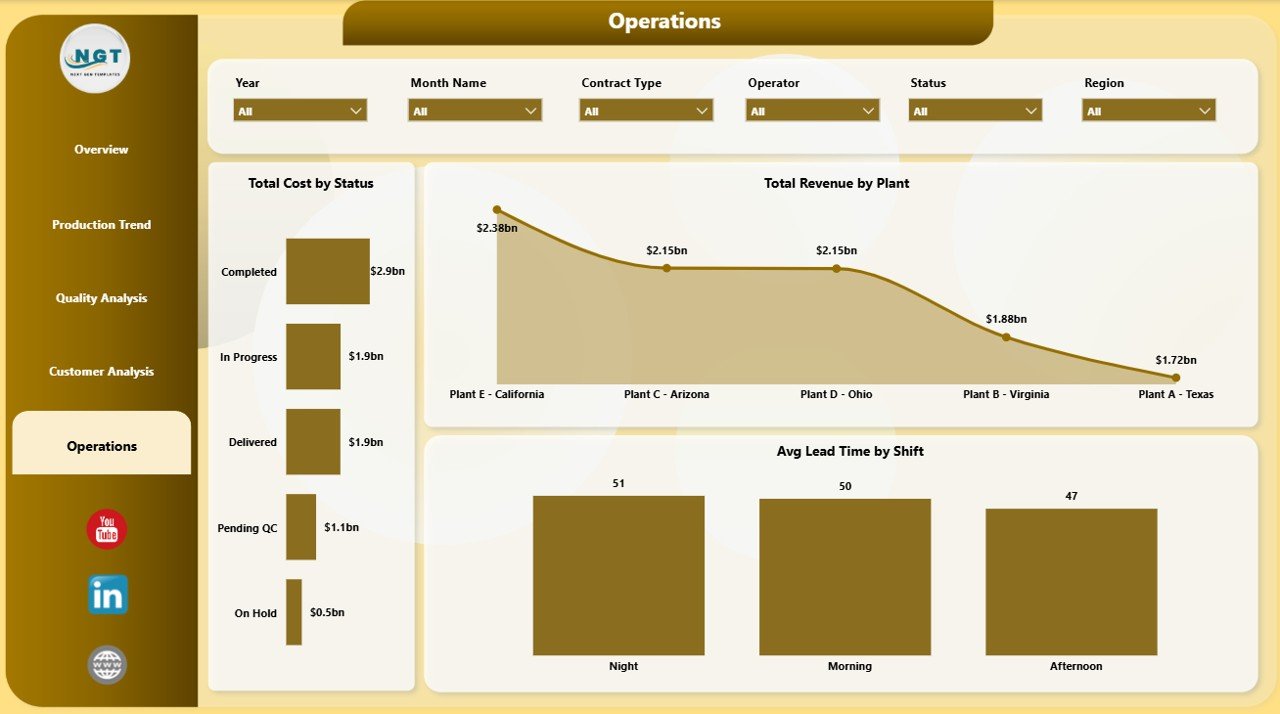
Operations
Defense Equipment Manufacturing Dashboard in Power BI vs. Tableau vs. Paid Manufacturing SaaS – Where This Fits
| Feature | This Power BI Template | Tableau or Qlik Alternative | Paid Manufacturing SaaS |
|---|---|---|---|
| Cost | $17.99 one-time | License or subscription cost | Monthly or annual vendor cost |
| Platform | Power BI Desktop | BI platform setup required | Vendor cloud or enterprise system |
| Setup time | Open .pbix and connect/replace data | Build workbook and data model | Implementation project |
| Customizable visuals | Yes, editable report pages | Yes, with platform skills | Limited by vendor configuration |
| Year-1 cost at 5 users | $17.99 plus existing Power BI access | Usually much higher | Often hundreds or thousands |
| Manufacturing KPIs | Built in | Must be designed | Depends on system scope |
Who This Template Is For – and Who It’s Not For
This template is for defense equipment manufacturers, aerospace and defense suppliers, plant managers, production planners, quality teams, operations analysts, finance teams, and contract managers who need a structured Power BI dashboard for production, cost, revenue, quality, priority, and lead-time analysis.
It is not an ERP, MES, PLM, classified-data system, secure compliance platform, or real-time shop-floor control system. Use it for dashboard reporting from approved, non-sensitive, structured data sources.
How to Use the Defense Equipment Manufacturing Dashboard in Power BI
- Download and unzip the file.
- Open the .pbix file in Power BI Desktop.
- Replace the sample data with your approved manufacturing data source.
- Refresh the report and review the 5 dashboard pages.
- Use slicers to filter by plant, product category, contract type, shift, region, priority, status, and time period.
- Customize visuals, labels, colors, or measures as needed.
Real-World Use Cases
Arjun, Plant Manager: Arjun reviews Total Units Produced by Product Category, Total Revenue by Plant, and Avg Lead Time by Shift before weekly production meetings.
Meera, Quality Lead: Meera uses Avg Quality Score by Plant and Total Defect Units by Shift to focus inspections and improvement actions.
Daniel, Contract Analyst: Daniel reviews Total Revenue by Contract Type, Total Revenue by Priority, Net Profit, and Total Cost by Region before program reviews.
Frequently Asked Questions
What KPIs are included?
The Overview page includes Total Revenue, Total Units Produced, Total Units Ordered, Total Cost, and Net Profit.
Do I need Power BI Desktop?
Yes. Open the .pbix file in Power BI Desktop, which is available from Microsoft.
Can I connect my own data?
Yes. Replace or connect your approved data source, then refresh the report.
Can I edit the charts and pages?
Yes. The Power BI file is editable, so you can adjust pages, visuals, measures, and fields.
Is this for classified defense data?
No. It is a reporting template. Only use data that your organization allows in Power BI.
Does it include multiple slicers?
Yes. The report includes slicers so users can filter the dashboard quickly.
About the Author
Built by PK – Microsoft Certified Professional with 15+ years of Excel, Google Sheets, and Power BI experience. Founder of NextGenTemplates, reaching 300K+ subscribers across YouTube channels. Every template is hand-built and tested before release.
Explore Related Templates
Browse more Power BI Dashboard Templates on NextGenTemplates. Related products include Defense and Military Dashboard in Power BI, Defense Equipment Manufacturing Dashboard in Excel, and Cryogenics Dashboard in Excel.
Ready to review defense manufacturing performance in Power BI? Download the Defense Equipment Manufacturing Dashboard in Power BI, refresh your approved data, and start analyzing production, quality, cost, revenue, and operations today.
Last updated: June 1, 2026.


Reviews
There are no reviews yet.