

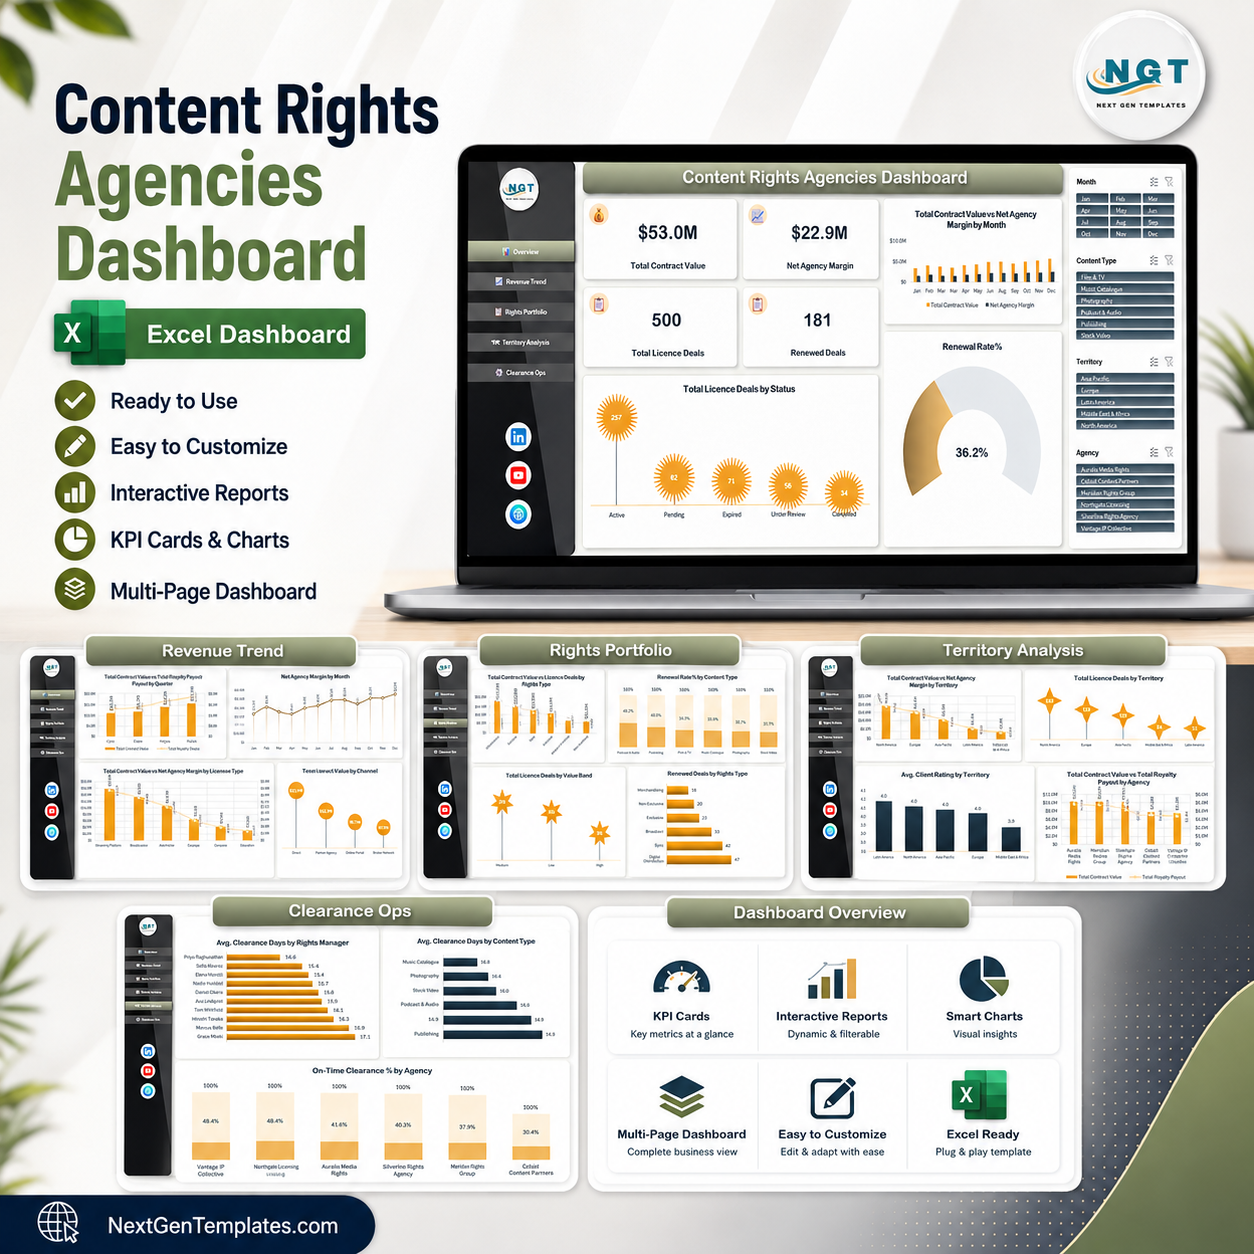
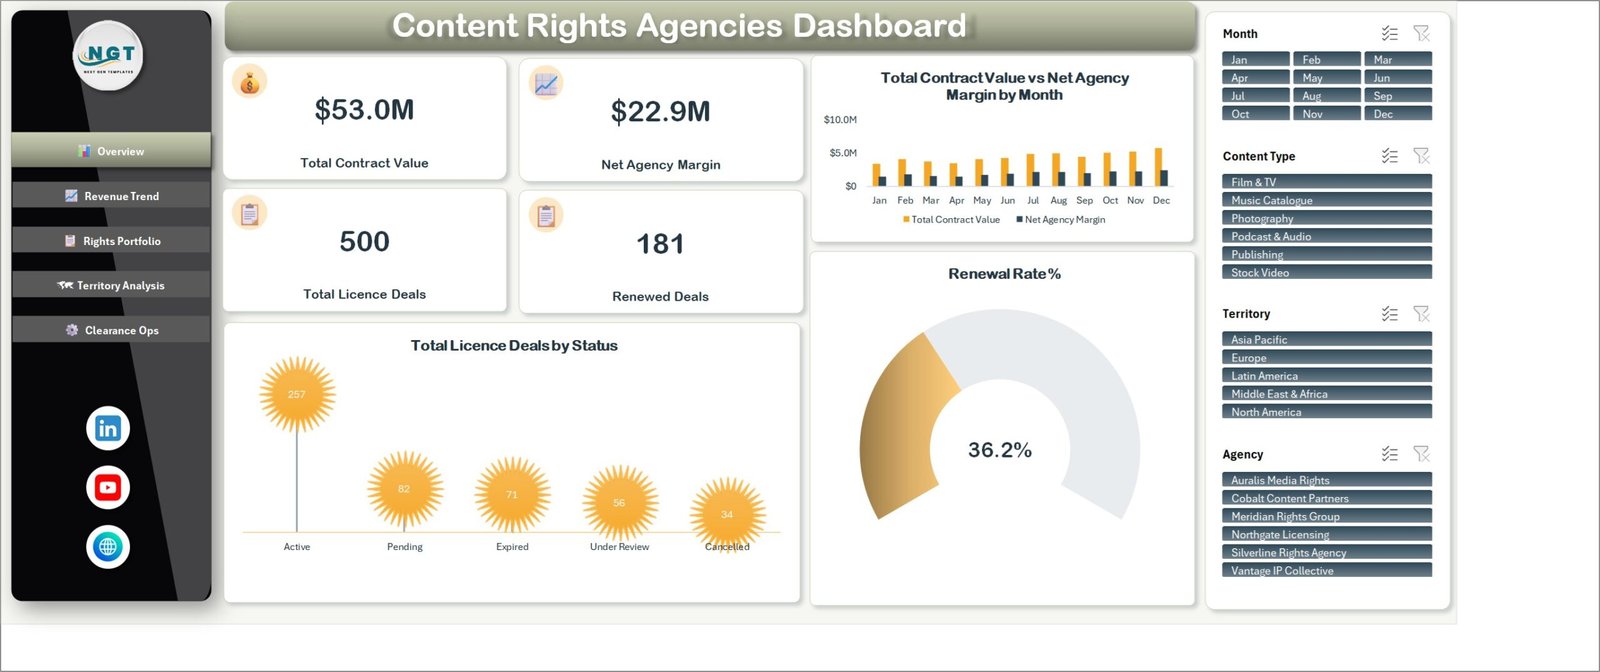
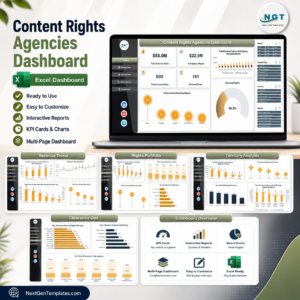
The Content Rights Agencies Dashboard in Excel takes 500 licence deals worth $53.0M in total contract value and puts them on five pages you can read in under a minute. The sample file tracks $22.9M of net agency margin, 181 renewed deals and a 36.2% renewal rate across six agencies, six content types, six rights types and five territories. It is a plain .xlsx – no macros, no add-ins, no monthly subscription – so it opens in Excel 2016, 2019, 2021 and Microsoft 365 and downloads the moment you check out. Replace the sample rows with your own deal register and every chart, card and gauge recalculates.
Key Features of the Content Rights Agencies Dashboard in Excel
- Five linked pages, one nav rail. Overview, Revenue Trend, Rights Portfolio, Territory Analysis and Clearance Ops each carry their own charts and share the same left-hand navigation buttons.
- Four KPI cards. Total Contract Value, Net Agency Margin, Total Licence Deals and Renewed Deals sit across the top of the Overview page.
- A renewal rate gauge. A half-doughnut gauge reads 36.2% in the sample file, which is 181 renewals against 500 deals.
- Four slicers wired to every page. Month, Content Type, Territory and Agency filter all 15 charts at once, so one click narrows the whole report to, say, Sync deals in Europe.
- Fifteen charts built on a single pivot cache – combo columns with a secondary axis, a line trend, lollipop and star markers, 100% stacked comparison bars and horizontal ranking bars.
- A 500-row source table. The Data sheet holds a named Excel table (
TblData) with 29 columns covering Deal ID, Date, Agency, Rights Manager, Content Type, Rights Type, Territory, Licensee Type, Channel, Licence Duration, Contract Value, Royalty Payout, Operating Cost, Clearance Days, Client Satisfaction, Infringement Cases, Status and Renewal Status. - A hidden Support sheet that feeds the chart helper ranges, so the visible pages stay clean.
- Print-ready page layout – each page is sized to one landscape sheet, which is what the screenshots above show.
What’s Inside the Content Rights Agencies Dashboard in Excel
The ZIP contains the workbook and an Excel Dashboard user manual PDF. Inside the workbook there are seven sheets:
- Overview – four KPI cards, Total Contract Value vs Net Agency Margin by Month, Total Licence Deals by Status (Active 257, Pending 82, Expired 71, Under Review 56, Cancelled 34) and the Renewal Rate % gauge.
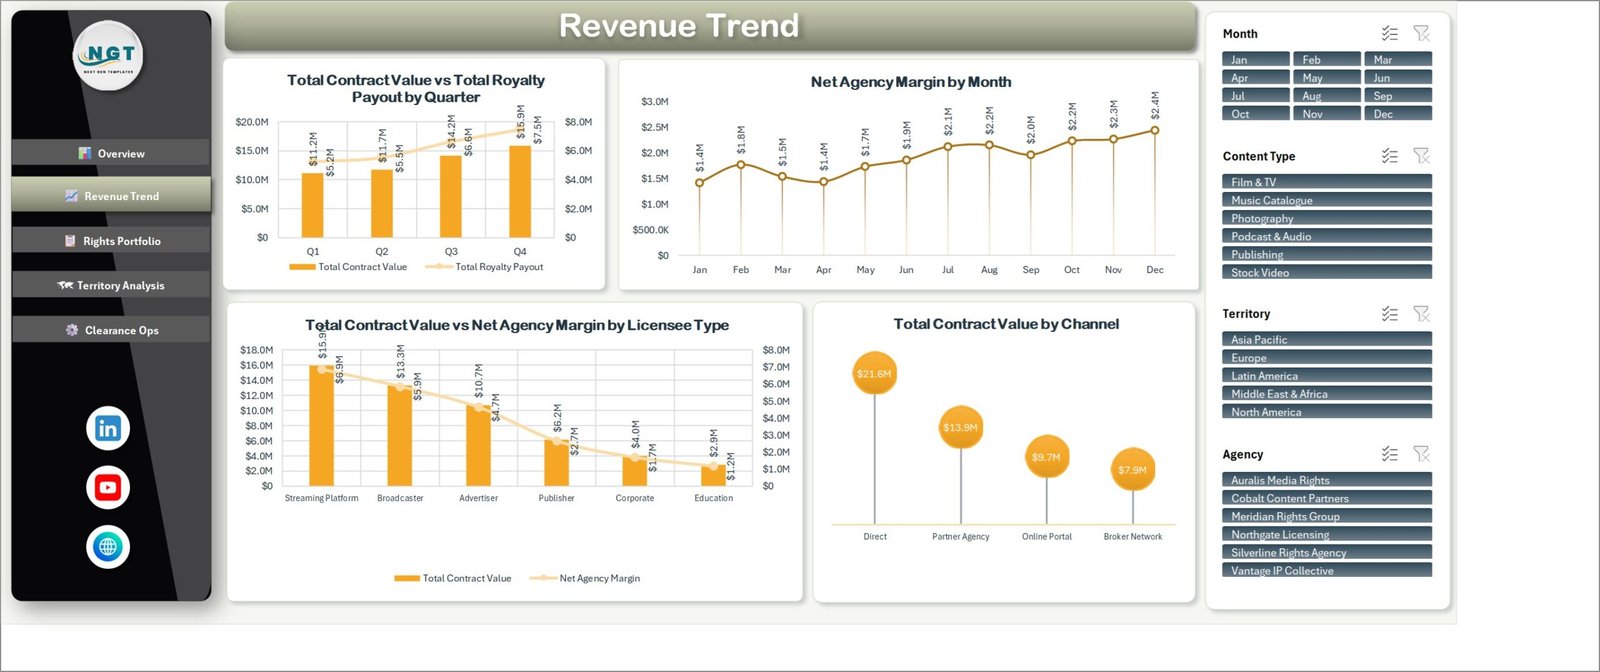
- Revenue Trend – Total Contract Value vs Total Royalty Payout by Quarter, Net Agency Margin by Month, Total Contract Value vs Net Agency Margin by Licensee Type and Total Contract Value by Channel.
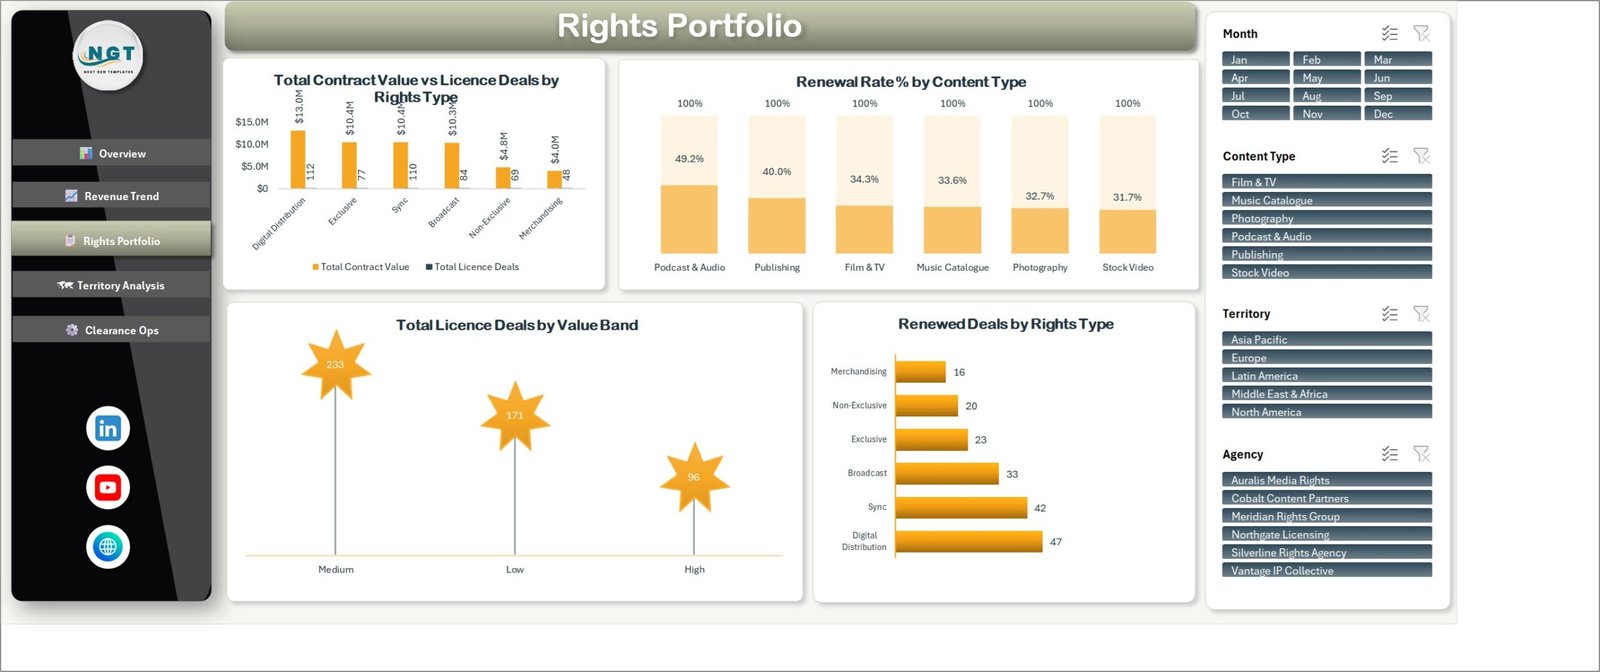
- Rights Portfolio – Total Contract Value vs Licence Deals by Rights Type, Renewal Rate % by Content Type, Total Licence Deals by Value Band and Renewed Deals by Rights Type.
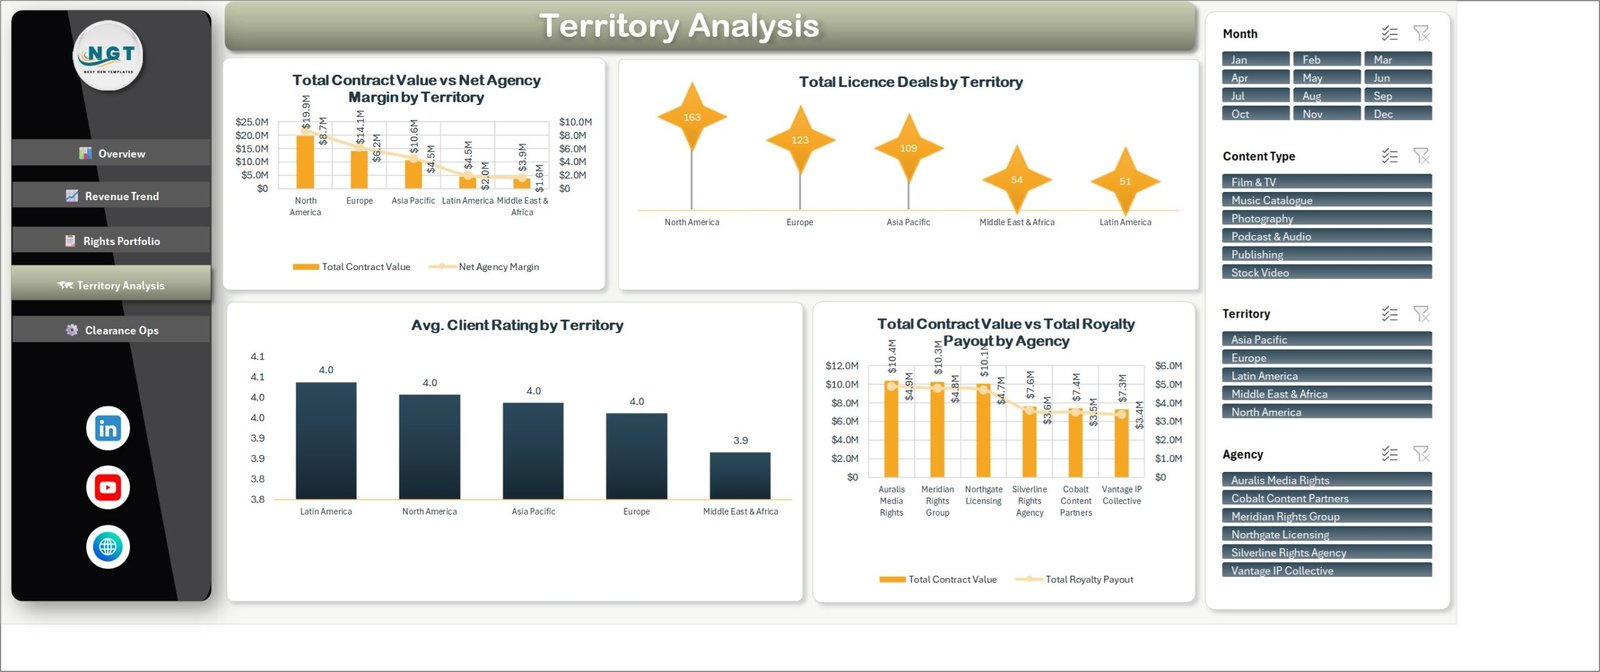
- Territory Analysis – Total Contract Value vs Net Agency Margin by Territory, Total Licence Deals by Territory, Avg. Client Rating by Territory and Total Contract Value vs Total Royalty Payout by Agency.
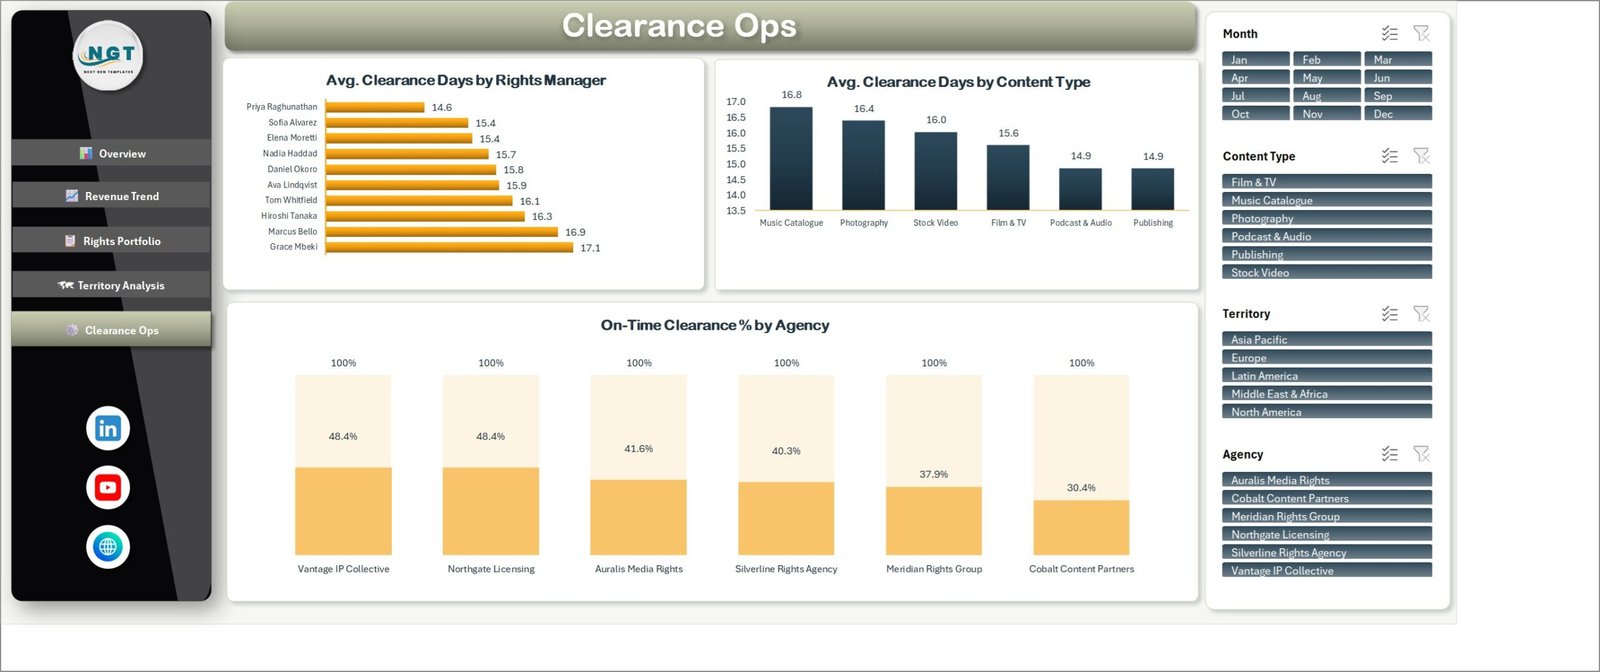
- Clearance Ops – Avg. Clearance Days by Rights Manager, Avg. Clearance Days by Content Type and On-Time Clearance % by Agency.
- Data – the 500-row, 29-column source table you overwrite with your own register.
- Support – the helper ranges behind the charts.
Content Rights Agencies Dashboard in Excel vs. Google Sheets vs. Paid Rights Management SaaS – Where This Fits
| This Excel dashboard | Google Sheets build | Paid rights management SaaS | |
|---|---|---|---|
| Cost | $17.99 once | Free tool, your build time | $150-$600 per user per month |
| Platform | Excel 2016+ / Microsoft 365, offline | Browser, Google account required | Vendor cloud |
| Setup time | Paste your deals, refresh – about 15 minutes | Days of chart and formula work | Weeks of onboarding and data mapping |
| Real-time team collaboration | Via OneDrive or SharePoint co-authoring | Yes, native | Yes, native |
| Mobile access | Excel mobile app, read-friendly | Yes | Yes |
| Customisable fields | All 29 columns are yours to rename | Yes, if you rebuild the charts | Only what the vendor exposes |
| Share with a link | Yes, from OneDrive | Yes | Yes |
| Year-1 cost at 5 users | $17.99 | $0 plus your hours | $9,000-$36,000 |
| Rights-type and territory splits ready on day one | Yes – six rights types, five territories | Build them yourself | Yes, after configuration |
| Clearance turnaround by rights manager | Yes, on the Clearance Ops page | Build it yourself | Usually an add-on module |
Who This Template Is For – and Who It’s Not For
It is for content licensing and rights agencies, music and stock-media catalogue owners, film and TV distribution teams, publishing rights desks, syndication managers and finance leads who already keep a deal register in a spreadsheet and want a reporting layer over it. If you can maintain one row per licence deal, this dashboard reads it.
It is not for anyone who wants a contract repository, e-signature workflow, or automatic royalty statement generation – none of that is here. It does not connect to a CMS, a DAM, a PRO, a collecting society or any rights registry, and it performs no copyright, chain-of-title or infringement checking. The Infringement Cases column is a number you type in, not a detection engine. It is a reporting workbook over data you already own, and it is not legal advice.
How to Use the Content Rights Agencies Dashboard in Excel
- Download the ZIP after checkout and extract the workbook and the user manual PDF.
- Open the workbook in Excel and click Enable Editing if the yellow bar appears. There are no macros to enable.
- Go to the Data sheet and look at the 500 sample rows so you can see the shape each column expects.
- Replace the sample rows with your own deals. Keep the column headers as they are, or rename them and update the pivot fields to match.
- Press Ctrl + Alt + F5 (Refresh All). Every KPI card, chart and slicer picks up the new rows.
- Use the Month, Content Type, Territory and Agency slicers to narrow the view, then print or export the page you need.
Real-World Use Cases
Priya runs a music catalogue desk. She loads last year’s sync and mechanical deals, filters the Agency slicer to her own team and uses Renewal Rate % by Content Type to argue that the podcast catalogue – the strongest renewer in the sample at 49.2% – deserves a bigger acquisition budget than stock video at 31.7%.
Daniel manages territory sales for a distributor. Territory Analysis shows him where contract value concentrates. In the sample file North America carries $19.9M against Latin America’s $4.5M, and pairing that with Total Licence Deals by Territory tells him whether the gap is deal count or deal size.
Elena heads clearance operations. The Clearance Ops page ranks her rights managers by average turnaround and shows on-time clearance percentage per agency, so her weekly stand-up starts with the two agencies furthest behind instead of a spreadsheet nobody has read.
Frequently Asked Questions
Does this dashboard manage contracts or generate royalty statements?
No. It reports on a deal register you maintain. There is no contract storage, no e-signature, no statement generation and no payment processing.
Does it check copyright, ownership or chain of title?
No. Nothing here verifies who owns what. The Rights Type, Status and Infringement Cases columns are values you type in, and the workbook connects to no rights registry, collecting society or PRO.
Is this the KPI scorecard dashboard or the analytical one?
This is the analytical five-page line – charts, slicers and a source table. It is not the month-picker KPI scorecard with traffic lights that we publish separately, so the two are complementary rather than duplicates.
Do I need macros, Power Query or a Power BI licence?
None of them. It is a standard .xlsx built on native pivot tables, pivot charts and slicers.
Can I add my own rights types, territories or agencies?
Yes. Type new values into the Data sheet and refresh – the slicers and charts pick them up automatically. Very long labels may need a chart resize.
How many rows can I load?
The sample is 500 rows. The table and pivot cache handle tens of thousands comfortably; beyond that, expect refreshes to slow on older machines.
Will the currency change to mine?
Yes – the sample is formatted in US dollars. Select the value columns and apply your own currency format; the charts follow the cell format.
About the Author
Built by PK – Microsoft Certified Professional with 15+ years of Excel, Google Sheets, and Power BI experience. Founder of NextGenTemplates, reaching 300K+ subscribers across YouTube channels. Every template is hand-built and tested before release.
Explore Related Templates
- Content Licensing Dashboard in Excel – the closest neighbour, focused on licence revenue rather than agency operations.
- Content Licensing Dashboard in Power BI – the same subject for teams already on Power BI.
- YouTube Channel Analytics Dashboard in Excel – audience-side reporting to sit alongside the rights side.
- NFT Art Marketplaces Dashboard in Excel – digital rights and marketplace sales.
- Film and Television Dashboard in Google Sheets – a Sheets option for production-side reporting.
- Browse the full Excel Dashboard category or the wider MS Excel collection.
Add the Content Rights Agencies Dashboard in Excel to your cart and you will have your own licence deals on screen this afternoon. Instant download, lifetime access, and a user manual PDF in the same ZIP.
Read the full walkthrough: Content Rights Agencies Dashboard in Excel on PK-AnExcelExpert.
Last updated: 20 August 2026.













Reviews
There are no reviews yet.