

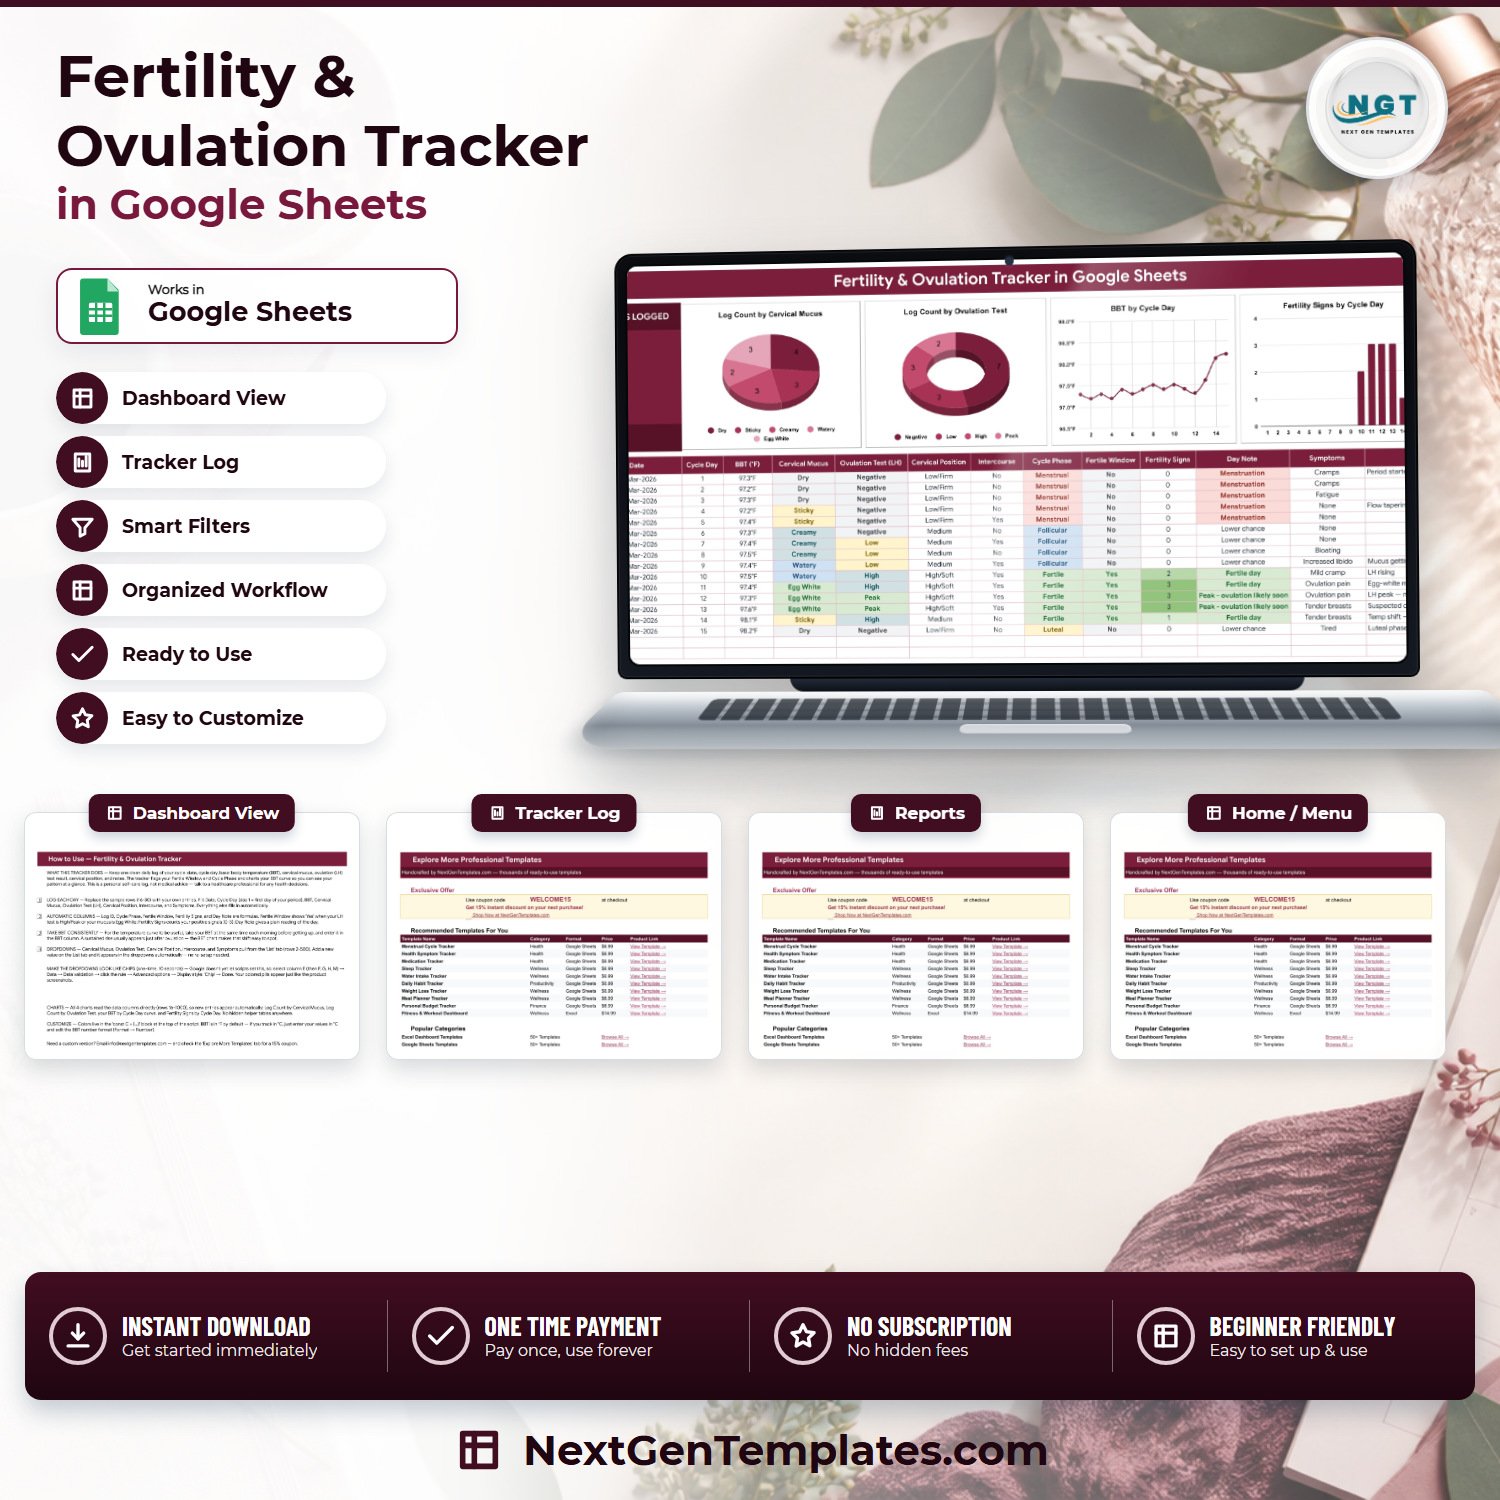

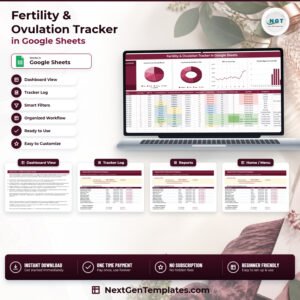
The Fertility & Ovulation Tracker in Google Sheets is a one-page personal record-keeping template: a single daily log with 14 columns, 5 of them formula-driven, one KPI card, and 4 charts that read the log directly. You type the date, cycle day, basal body temperature, cervical mucus, LH test result, cervical position, intercourse and symptoms; the sheet labels the Cycle Phase, flags the Fertile Window, counts Fertility Signs from 0 to 3, and writes a plain Day Note. It ships with 15 sample rows, 25 seeded dropdown values across 5 columns, and room for 985 entries with no re-setup. This is a personal log, not a medical device, not contraception and not medical advice. One payment, no subscription, and it opens in any browser.
Key Features of the Fertility & Ovulation Tracker in Google Sheets
- One page, no tab-hopping – the KPI card, all four charts and the full log sit on a single sheet called Fertility Tracker.
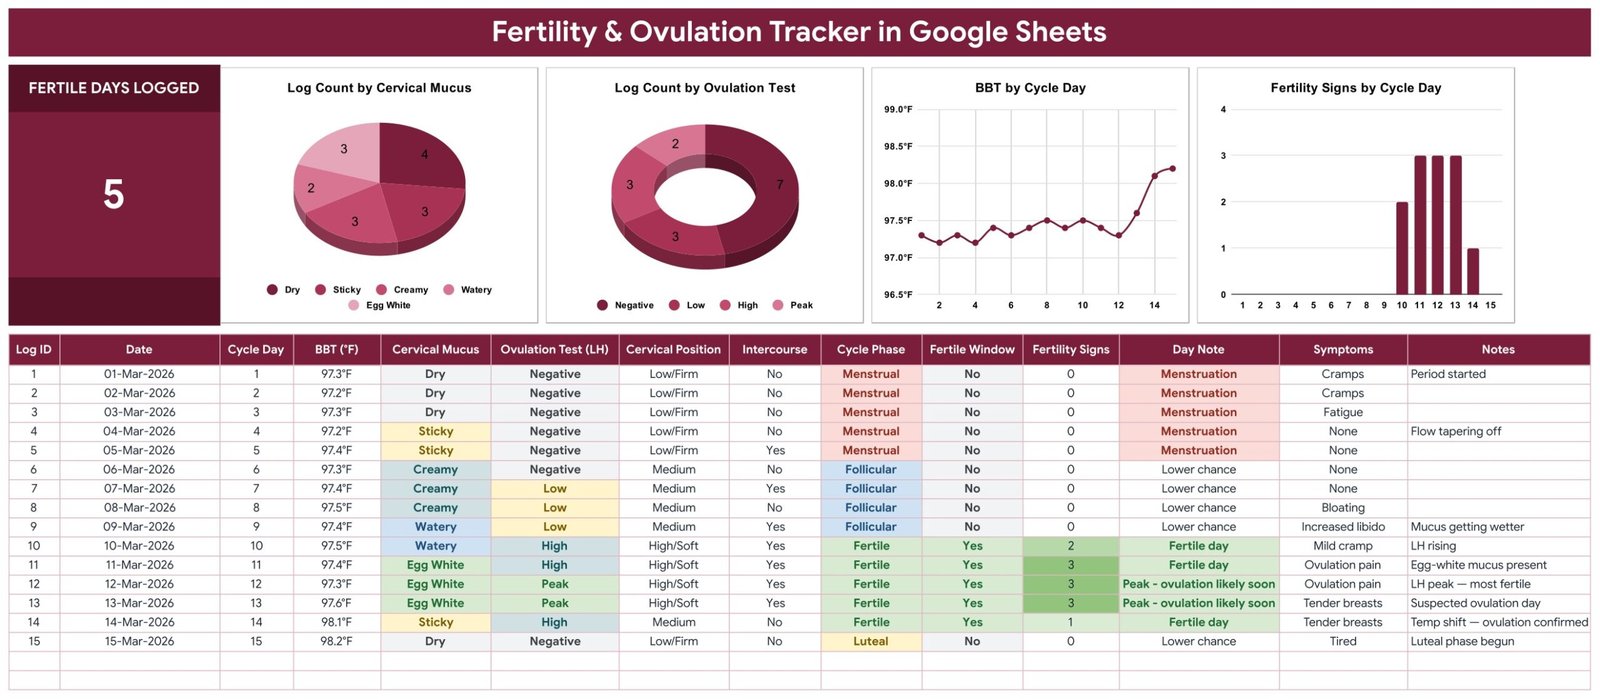
- Fertile Days Logged card – a live count of every row where the Fertile Window column reads Yes, taken straight from rows 16 to 1000.
- Five automatic columns – Log ID, Cycle Phase, Fertile Window, Fertility Signs and Day Note are formulas. You never type them.
- A Fertile Window rule you can read – it returns Yes when your LH test is High or Peak, or your cervical mucus is Egg White. That is the whole rule, and it is visible in the cell.
- Fertility Signs score, 0 to 3 – one point each for Egg White mucus, an LH result of High or Peak, and a High/Soft cervical position.
- Cycle Phase labelling – cycle days 1 to 5 read Menstrual, a fertile day reads Fertile, days 6 to 10 read Follicular, and anything later reads Luteal.
- BBT curve – a line chart of basal body temperature against cycle day, so a sustained temperature shift is easy to see after the fact.
- Auto-expanding dropdowns – Cervical Mucus, Ovulation Test, Cervical Position, Intercourse and Symptoms all read rows 2 to 500 of the List tab. Add a value there and it appears in the dropdown immediately.
- Charts with no helper tables – all four read the data columns directly, so a new row updates them without any hidden aggregation sheet.
- Stores nothing that identifies you – there is no name, date of birth, medical record number, clinician, diagnosis, medication, dose, insurance or claim field anywhere in the file.
What’s Inside the Fertility & Ovulation Tracker in Google Sheets
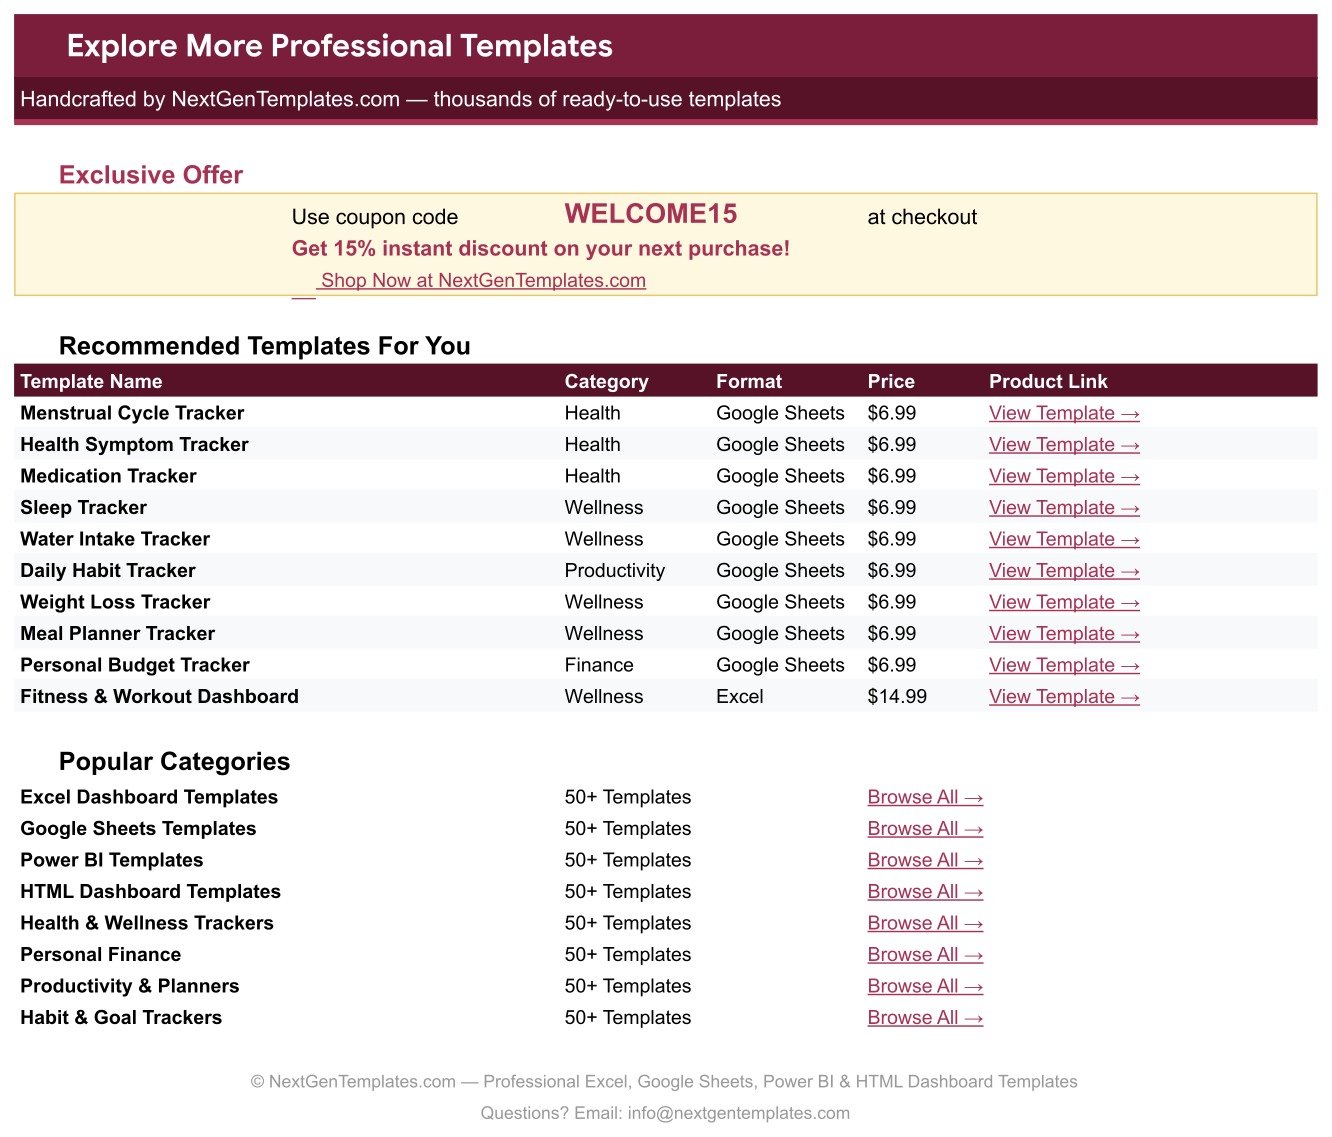
The file has four tabs. Fertility Tracker carries the title banner, the Fertile Days Logged card, four charts and the log table starting at row 16. List holds the five dropdown source columns with 25 seeded values: 5 mucus types (Dry, Sticky, Creamy, Watery, Egg White), 4 LH results (Negative, Low, High, Peak), 3 cervical positions (Low/Firm, Medium, High/Soft), Yes/No for intercourse, and 11 symptoms. Instructions is a plain-English how-to page. Explore More Templates carries a 15 percent coupon and links to other NextGenTemplates products.
The four charts are Log Count by Cervical Mucus, Log Count by Ovulation Test, BBT by Cycle Day and Fertility Signs by Cycle Day. The 15 demonstration rows run 01-Mar-2026 to 15-Mar-2026 and are entirely fictional. In that sample the card reads 5 fertile days logged, which is exactly the five rows flagged Yes – the numbers reconcile, so you can check the logic before you trust it with your own.
Google Sheets vs. Excel vs. a Paid Cycle-Tracking App – Where This Fits
| This template (Google Sheets) | A DIY Excel workbook | Paid cycle-tracking app | |
|---|---|---|---|
| Cost | One payment of $6.99 on sale | Your own build time | Typically a monthly or yearly subscription |
| Platform | Google Sheets, any browser | Microsoft Excel | Vendor’s phone app and cloud |
| Setup time | Minutes – make a copy and start logging | Hours of formula and chart work | Minutes, after creating an account |
| Where your entries live | Your own Google Drive | Your own device | The vendor’s servers |
| Mobile access | Google Sheets mobile app | Excel mobile app | Native app |
| Customisable fields | Yes – add columns and dropdown values freely | Yes | Usually fixed |
| Share with a link | Yes, though a private log is best kept private | File sharing only | Partner sharing, if offered |
| Ovulation prediction algorithm | None, deliberately – it labels what you typed | None unless you write one | Varies by vendor |
| Formulas you can read and change | Yes, all five are plain cell formulas | Yes | No |
| Year-1 cost for one person | $6.99, once | $0 plus your time | Recurring, indefinitely |
Who This Template Is For – and Who It’s Not For
It is for anyone who already records BBT, LH test results and cervical signs and wants them in one tidy, searchable place with a temperature curve. It suits people who prefer their own file in their own Drive to an account on somebody else’s platform, and people who want to arrive at an appointment with a clean printout instead of a phone screenshot.
It is not for anyone looking for a method of contraception or family planning – it is not one, and must never be used as one. It is not for predicting ovulation or a future fertile window: it holds no calendar model, no cycle-length averaging and no forecast of any kind. It will not confirm ovulation, pregnancy or the absence of pregnancy. It is not a clinic system, it has no appointment, prescription, results or patient fields, and it is not a place for clinical records. It also does not connect to a thermometer, a wearable, an LH test reader or any app.
How to Use the Fertility & Ovulation Tracker in Google Sheets
- Make your copy. Open the PDF in your download and click the “Make a copy” link. The copy lands in your own Google Drive.
- Clear the demo rows. Rows 16 to 30 hold the 15 sample entries. Delete their contents and start your own.
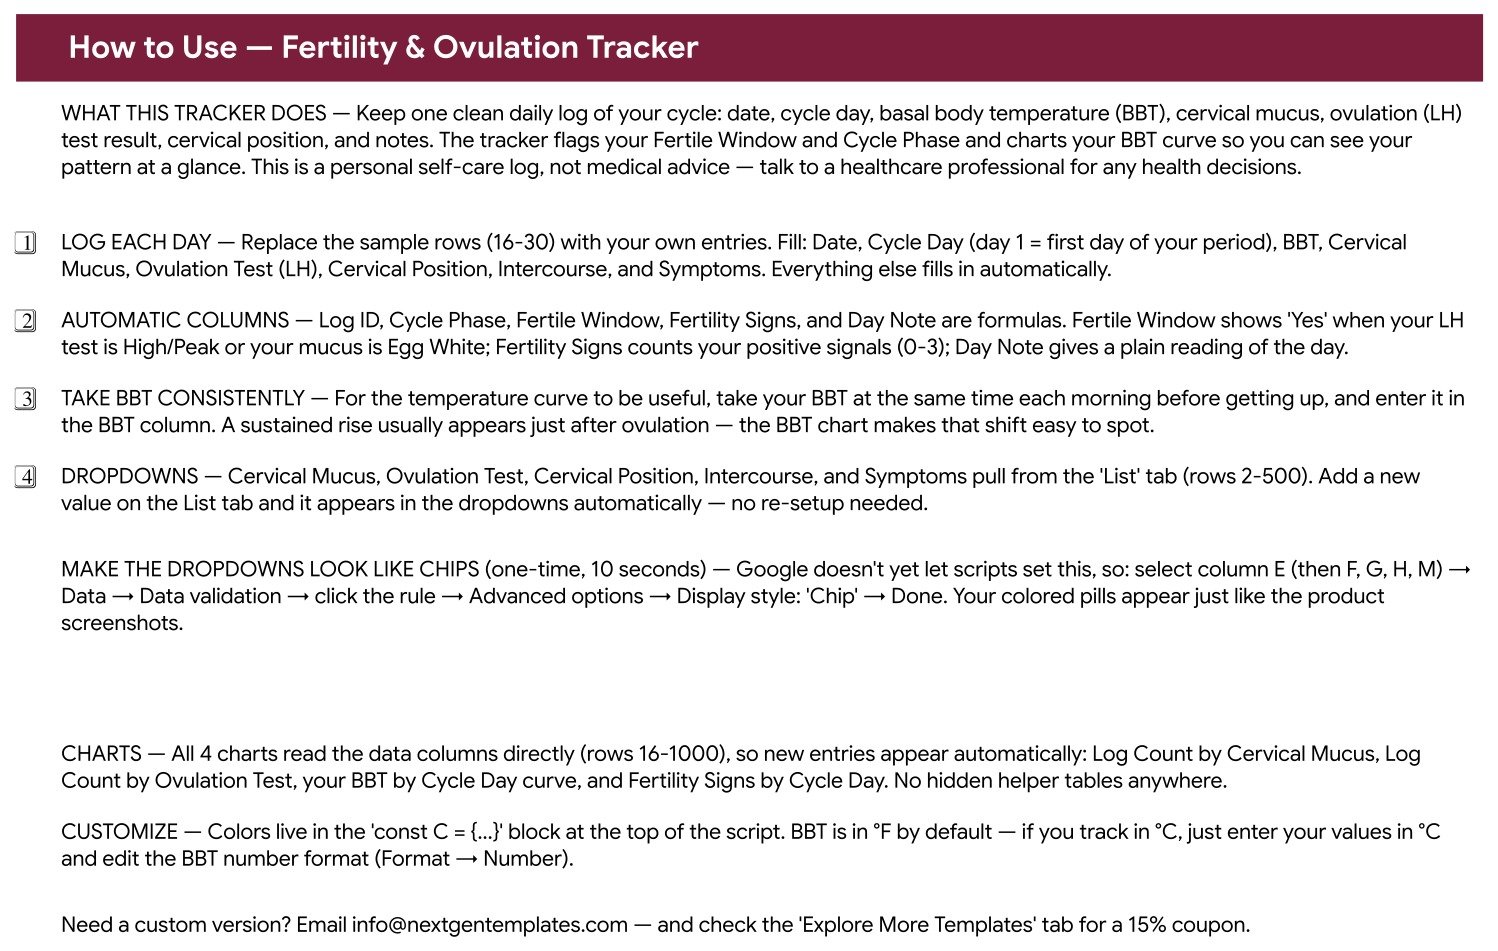
- Log the day. Fill Date, Cycle Day (day 1 is the first day of your period), BBT, and pick Cervical Mucus, Ovulation Test, Cervical Position, Intercourse and Symptoms from the dropdowns. Cycle Phase, Fertile Window, Fertility Signs and Day Note fill themselves.
- Take BBT the same way every day. The curve is only readable if the reading is taken at a consistent time before getting up. Temperatures are in Fahrenheit by default; enter Celsius instead and change the column’s number format if you prefer.
- Extend the dropdowns. Add a symptom or mucus description to the matching column on the List tab and it appears in the dropdown at once – no re-setup.
- Optional, ten seconds: to get the coloured pill styling shown in the screenshots, select column E (then F, G, H and M), go to Data, Data validation, open the rule, Advanced options, and set Display style to Chip. Google does not let a script set that.
Real-World Use Cases
Priya keeps six months in one file. She logs BBT each morning and her LH strip result each afternoon. The Fertile Days Logged card tells her how many flagged days each stretch produced, and the BBT chart shows her where the temperature rise sat relative to her Peak readings – a record of what happened, not a prediction of what will.
Dana prepares for an appointment. Rather than scrolling an app, she prints the log and takes it in. Every column is legible, the notes are hers, and nothing is hidden behind a vendor’s scoring model.
Sam wants the data, not the account. He and his partner keep the file in a private Drive folder, share it with nobody, and add two columns of their own. Because the formulas are ordinary cell formulas, adding a column breaks nothing.
Frequently Asked Questions
Does this predict my ovulation or my fertile window?
No. The Fertile Window column is a label applied to the day you just typed: it reads Yes when that row’s LH test is High or Peak, or its mucus is Egg White. There is no forecast, no cycle-length model and no calendar projection anywhere in the file.
What does “Peak – ovulation likely soon” mean, then?
It is a restatement of an LH result of Peak that you entered on that row. It is wording, not analysis, and it cannot confirm that ovulation occurred.
Can I use this for birth control or family planning?
No. It is not contraception, it is not a fertility-awareness method, and it must not be used to prevent or plan a pregnancy. Speak to a qualified healthcare professional about any method of family planning.
Is this a medical device or medical advice?
Neither. It is a personal record-keeping spreadsheet. It makes no diagnostic, contraceptive or conception-outcome claim, and nothing in it should replace advice from a clinician. If you have concerns about your cycle or your fertility, see a professional.
Does it connect to my thermometer, wearable or LH test reader?
No. Every value is typed or picked from a dropdown. There is no import, no API and no device pairing.
Can I add my own symptoms and mucus descriptions?
Yes. Each dropdown reads rows 2 to 500 of its column on the List tab, so anything you add there appears in the dropdown straight away.
How many entries does it hold?
The formulas and charts cover rows 16 to 1000, which is 985 entries. That is several years of daily logging.
Is the sample data real?
No. The 15 rows dated March 2026 are fictional demonstration data, there so you can see the formulas and charts working before you clear them.
About the Author
Built by PK – Microsoft Certified Professional with 15+ years of Excel, Google Sheets, and Power BI experience. Founder of NextGenTemplates, reaching 300K+ subscribers across YouTube channels. Every template is hand-built and tested before release.
Explore Related Templates
- Symptom & Pain Diary Tracker in Google Sheets – a day-by-day symptom log with the same one-page shape.
- Medication & Pill Tracker in Google Sheets – for keeping what you take alongside what you record.
- Doctor Appointments & Medical History Tracker in Google Sheets – visits, notes and history in one file.
- Lab Results & Health Metrics Tracker in Google Sheets – for the numbers a clinic hands back to you.
- Sleep Tracker in Google Sheets – a companion log if you also track rest.
- Browse every Google Sheets tracker or the full Google Sheets template shelf.
Get the Fertility & Ovulation Tracker in Google Sheets for $6.99 (regular $12.99). Instant download, one payment, no subscription. Your download contains a PDF with the “Make a copy” link – one click and the template is yours, in your own Drive, editable forever.
Health note: this template is a personal record-keeping tool. It is not a medical device, not contraception, not a diagnostic tool and not medical advice. Please consult a qualified healthcare professional about fertility, conception or any other health decision.
Watch the step-by-step video Demo:
Last updated: 1 September 2026.
Compatibility and Requirements
- Works in Google Sheets. You need a free Google account and a web browser, and you make your own copy in Google Drive.
- The five log dropdowns read the List tab. Google explains how dropdowns work in Create an in-cell dropdown list.
- The four charts follow Google’s standard chart tools, described in Add and edit a chart or graph.




Reviews
There are no reviews yet.