

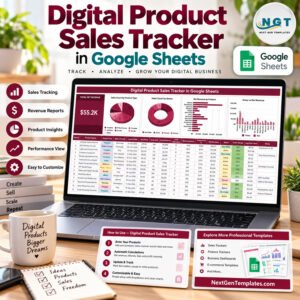
The Digital Product Sales Tracker in Google Sheets is a one-page digital product sales tracker with 16 columns, 1 Total Net Revenue card and 4 charts that read your product list directly. It ships with 15 sample products across 8 product types, 7 sales channels and 4 statuses, and 6 of the columns (Sale ID, Gross Revenue, Refund Amount, Net Revenue, Profit Margin and Avg Sale Value) calculate themselves. Replace the sample rows with your own eBooks, courses, templates, presets or plugins and the card and charts refresh instantly.
🌍 Built by NextGenTemplates, the maker of 2,000+ ready-to-use Excel, Google Sheets, Power BI and HTML templates sold as one-time purchases instead of monthly subscriptions.
✅ Instant download · One-time payment · No subscription · No per-user fees · Lifetime access
🔑 Key Features of the Digital Product Sales Tracker
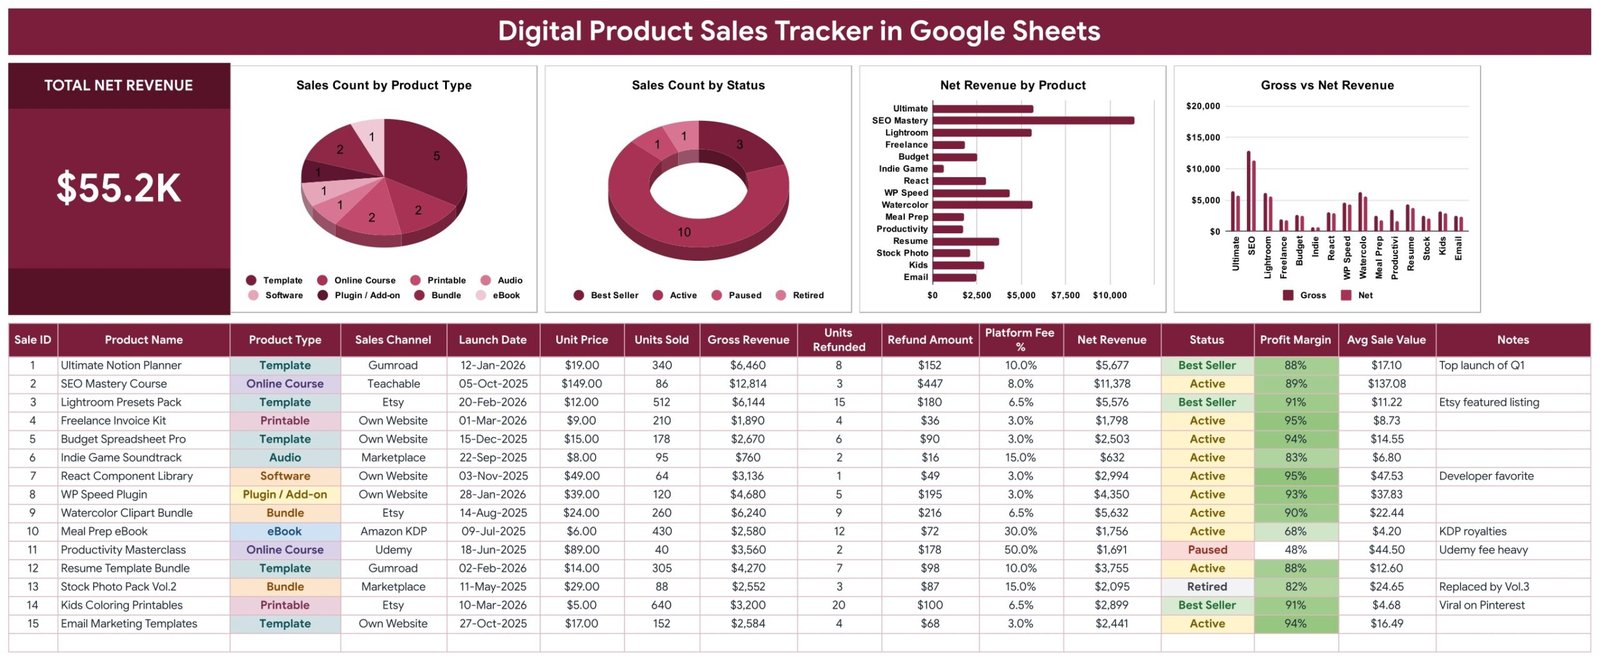
💰 Total Net Revenue card – One large card adds up the Net Revenue of every product in the list. With the 15 sample products it reads $55.2K, and it updates the moment you change units, refunds or fees.
📊 Four charts linked straight to the data – Sales Count by Product Type, Sales Count by Status, Net Revenue by Product and Gross vs Net Revenue. All 4 charts read the data rows with the built-in Aggregate option, so there are no hidden helper tables to maintain.
🧮 Net Revenue after refunds and platform fees – Gross Revenue is Unit Price × Units Sold, Refund Amount is Units Refunded × Unit Price, and Net Revenue takes the refunds off and then applies your Platform Fee %. In the sample, the SEO Mastery Course turns $12,814 gross into $11,378 net.
📐 Profit Margin and Avg Sale Value per product – Profit Margin shows how much of Gross Revenue you keep after refunds and fees, and Avg Sale Value divides Net Revenue by the units that were not refunded. A 50% fee channel stands out at once: the Udemy-sold Productivity Masterclass keeps 48%.
🏷️ Status and channel on every row – Mark products Best Seller, Active, Paused or Retired, and record where each one sells, from Gumroad, Etsy and Teachable to Udemy, Amazon KDP, a marketplace or your own website.
🔽 Dropdowns that grow with your catalogue – Product Type, Sales Channel and Status pull their options from the List tab (rows 2-500). Add a new channel or product type there and it appears in the dropdown automatically.
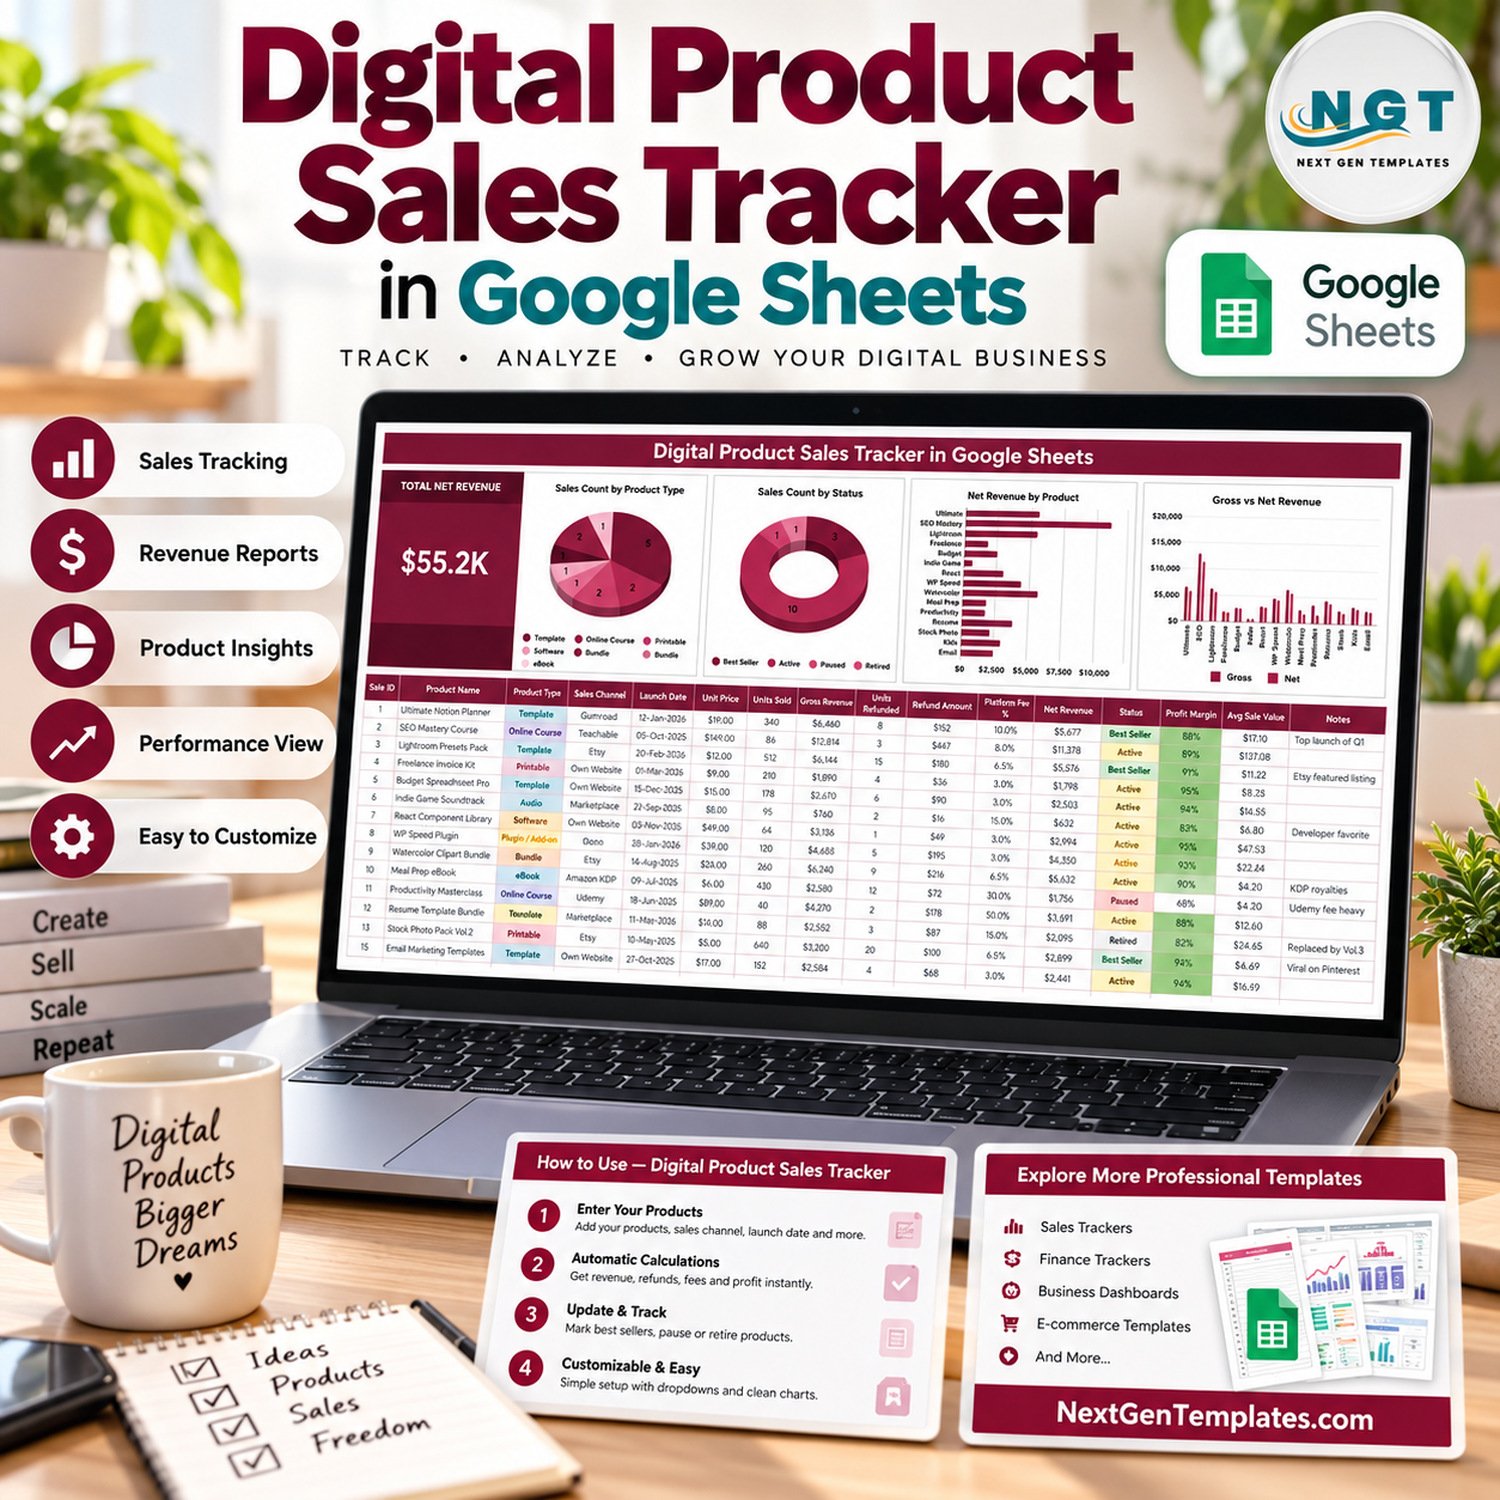
📦 What’s Inside the Digital Product Sales Tracker
The Google Sheets file has the tracker tab, a List tab that feeds the dropdowns, a How to Use tab and an Explore More Templates tab.
Page 1: Digital Product Sales Tracker Sheet
This page shows the Total Net Revenue card and charts including Sales Count by Product Type, Sales Count by Status, Net Revenue by Product and Gross vs Net Revenue. Below them sits the 16-column product table: Sale ID, Product Name, Product Type, Sales Channel, Launch Date, Unit Price, Units Sold, Gross Revenue, Units Refunded, Refund Amount, Platform Fee %, Net Revenue, Status, Profit Margin, Avg Sale Value and Notes.
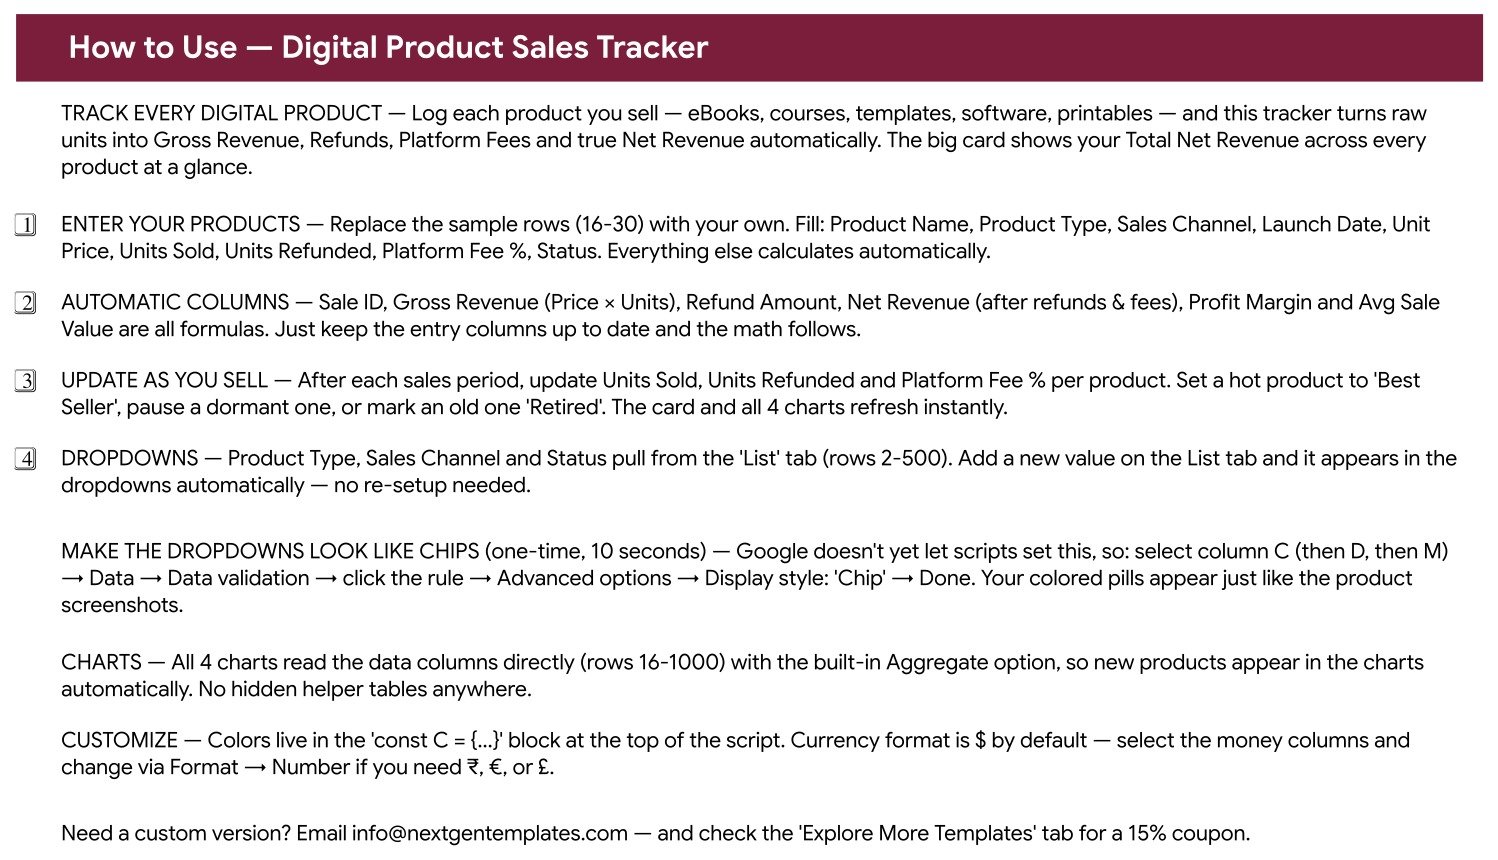
Page 2: How to Use
This page walks through entering your products, the automatic columns, updating after each sales period, the List tab dropdowns, the one-time chip display setting, how the charts read the data and where to change colours and currency.
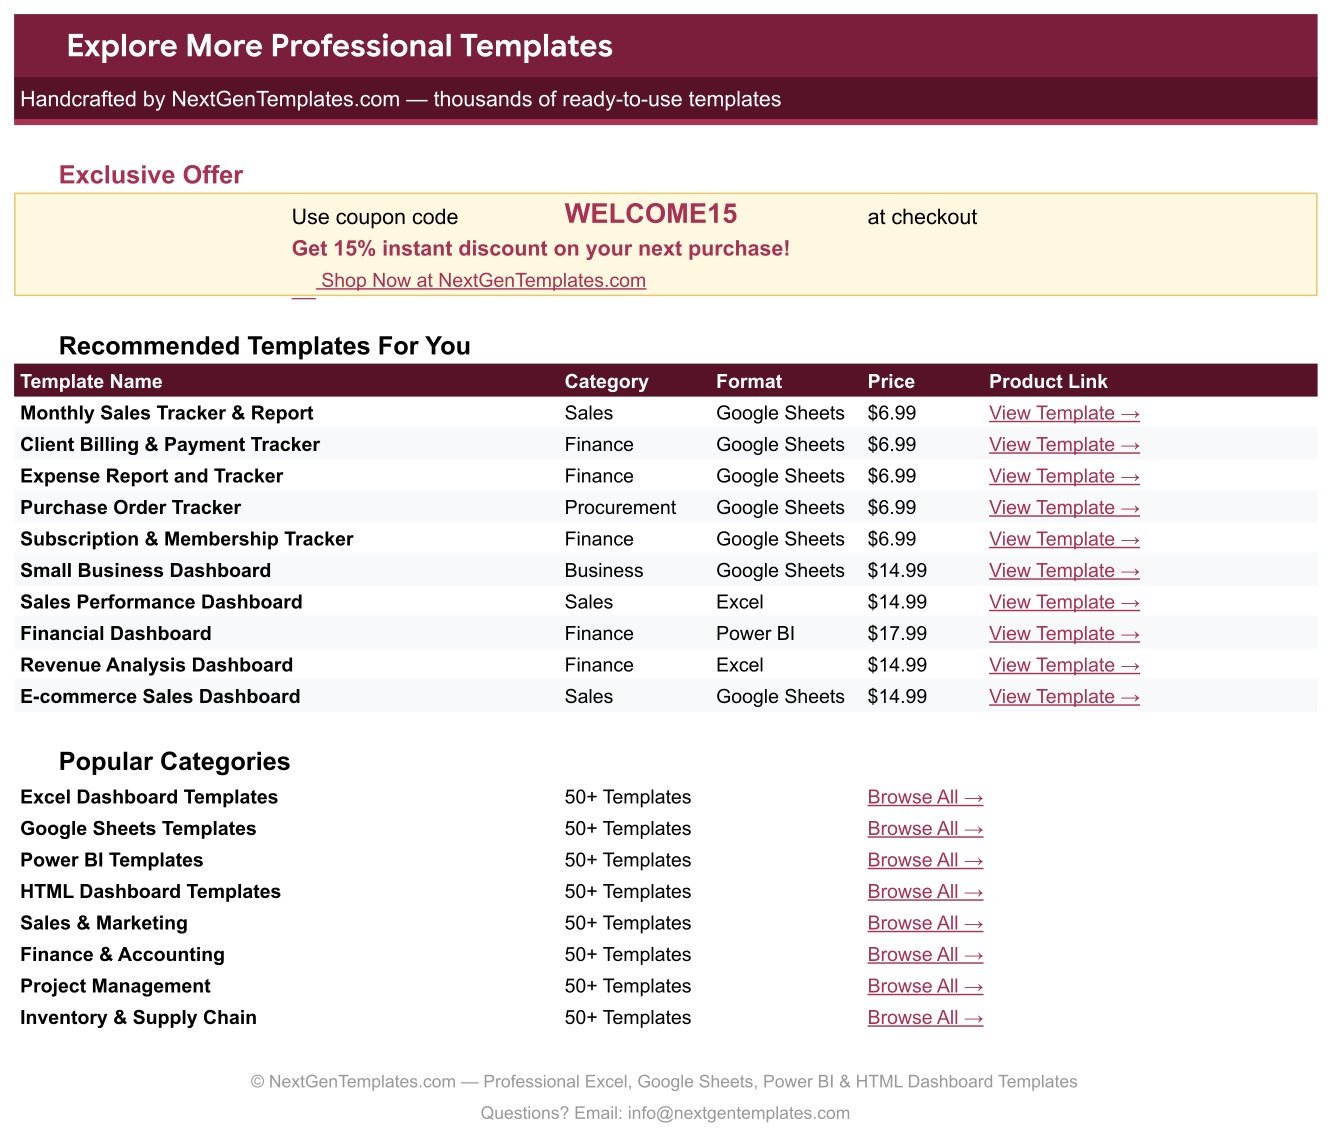
Page 3: Explore More Templates
This page carries the WELCOME15 coupon for 15% off your next purchase and links to more templates and categories on NextGenTemplates.com.
📊 Digital Product Sales Tracker vs. Microsoft Excel Sales Log vs. Platform Dashboards
| Feature | Digital Product Sales Tracker in Google Sheets | Microsoft Excel Sales Log | Built-in Platform Dashboards (Gumroad, Etsy, Udemy) |
|---|---|---|---|
| Cost | ✅ $6.99 one-time | Varies; Microsoft 365 licence usually needed | Included, but fees per sale |
| All channels in one view | ✅ Every store and marketplace on one page | Only if you build it | ❌ One platform at a time |
| Setup time | ✅ Minutes: make a copy, replace 15 sample rows | Build formulas and charts yourself | ✅ None |
| Net revenue after refunds and fees | ✅ Calculated per product | Manual formulas | Varies by platform |
| Real-time team collaboration | ✅ Built into Google Sheets | Through OneDrive or SharePoint | Limited account sharing |
| Mobile access | ✅ Google Sheets app | ✅ Excel app | ✅ Vendor app or browser |
| Customizable fields | ✅ Every column, dropdown and colour | ✅ Fully editable | ❌ Vendor’s fields only |
| Automatic sales import | ❌ You enter units, refunds and fees | ❌ Manual entry | ✅ Recorded by the platform |
For creators who sell on more than one platform and want one honest net revenue figure without paying for another subscription, this tracker sits in the sweet spot.
👥 Who This Template Is For — and Who It’s Not For
✅ This template is built for:
- Creators selling eBooks, courses, templates, presets, printables, audio or software on several platforms
- Solo founders and small digital shops who want one catalogue view of units, refunds, fees and net revenue
- Course and template sellers deciding which products to promote, pause or retire
❌ This template is NOT for:
- Sellers who need orders imported automatically – every figure here is entered by you, per product
- Bookkeeping, sales tax or payout reconciliation – the tracker summarises product performance, it is not accounting software
⚙️ How to Use the Digital Product Sales Tracker
- Open the PDF in your download and click the Google Sheets link to make your own editable copy.
- Add your product types, sales channels and statuses on the List tab so they appear in the dropdowns.
- Replace the sample rows with your products: Product Name, Product Type, Sales Channel, Launch Date, Unit Price, Units Sold, Units Refunded, Platform Fee % and Status.
- After each sales period, update Units Sold, Units Refunded and Platform Fee % for each product.
- Set hot products to Best Seller, pause dormant ones and mark old versions Retired.
- Optional: switch the dropdowns to chip style via Data > Data validation > Advanced options, as described in Google’s data validation help.
💼 Real-World Use Cases
Priya sells Notion and spreadsheet templates on Gumroad and her own website. She logs each template with its unit price and platform fee, then sorts by Net Revenue to see which bundles earn the most after fees before planning her next launch.
Marcus teaches on Teachable and Udemy. The Profit Margin column shows at a glance how much more he keeps per course on his own school than on the 50%-fee marketplace, so he points his email list at the better channel.
Lena runs a small printables shop on Etsy. She tracks refunds per product, spots a clipart pack with more returns than the rest, and marks an outdated stock photo pack Retired once its replacement is live.
❓ Frequently Asked Questions
What does the Digital Product Sales Tracker in Google Sheets track?
It tracks each product’s name, type, sales channel, launch date, unit price, units sold, units refunded, platform fee %, status and notes. From those it calculates Sale ID, Gross Revenue, Refund Amount, Net Revenue, Profit Margin and Avg Sale Value, plus one Total Net Revenue card and 4 charts.
Does it connect to Gumroad, Etsy, Udemy or Shopify?
No. The tracker has no live connection to any store. You enter units, refunds and fee percentages after each sales period, and the card, formula columns and charts update instantly from what you type.
Is Profit Margin my true profit?
Profit Margin here is Net Revenue divided by Gross Revenue, so it reflects refunds and platform fees only. It does not subtract your own costs such as software, advertising or taxes, so treat it as a revenue-kept figure rather than an accounting profit.
How long does setup take?
Most users are ready in under 15 minutes. Make a copy from the PDF link, add your channels and product types on the List tab, then replace the 15 sample products with your own. The formula columns and all 4 charts need no setup.
Can I change the currency?
Yes. Money columns use $ by default. Select them and change the format through Format > Number to use ₹, € or £.
Can I add more product types, channels or statuses?
Yes. Product Type, Sales Channel and Status read from the List tab rows 2-500. Type a new value on the List tab and it appears in the dropdown immediately, and the charts pick up new products automatically.
👤 About the Author
Built by PK — Microsoft Certified Professional with 15+ years of Excel, Google Sheets and Power BI experience. Founder of NextGenTemplates, reaching 300K+ subscribers across YouTube channels (@PKAnExcelExpert, @NextGenTemplates, @NeoTechNavigators). Every template is hand-built and tested before release.
🔗 Explore Related Templates
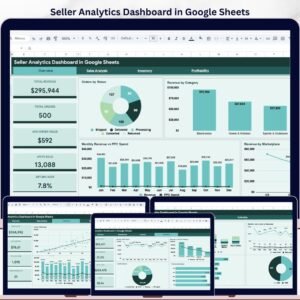
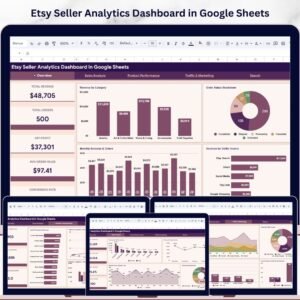
🛍️ Etsy sellers can go deeper with the Etsy Seller Analytics Dashboard in Google Sheets, and multi-store sellers can analyse orders in the Seller Analytics Dashboard in Google Sheets.
💵 Combine product sales with your other earnings in the Multiple Income Streams Tracker in Google Sheets or the Side Hustle Income Tracker in Google Sheets.
✍️ Creators who market with content can also use the Blog Content & SEO Tracker in Google Sheets and the YouTube Channel Performance Tracker in Google Sheets. Browse every Google Sheets tracker template.
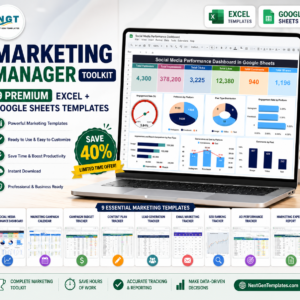
💎 Need the whole marketing stack? Get 9 templates in the Marketing Manager Toolkit.
📖 Click here to read the Detailed Blog Post
🎥 Visit our YouTube channel for step-by-step video tutorials
👉 YouTube.com/@NextGenTemplates
Watch the step-by-step video Demo:
📅 Last updated: September 2026

















Reviews
There are no reviews yet.