

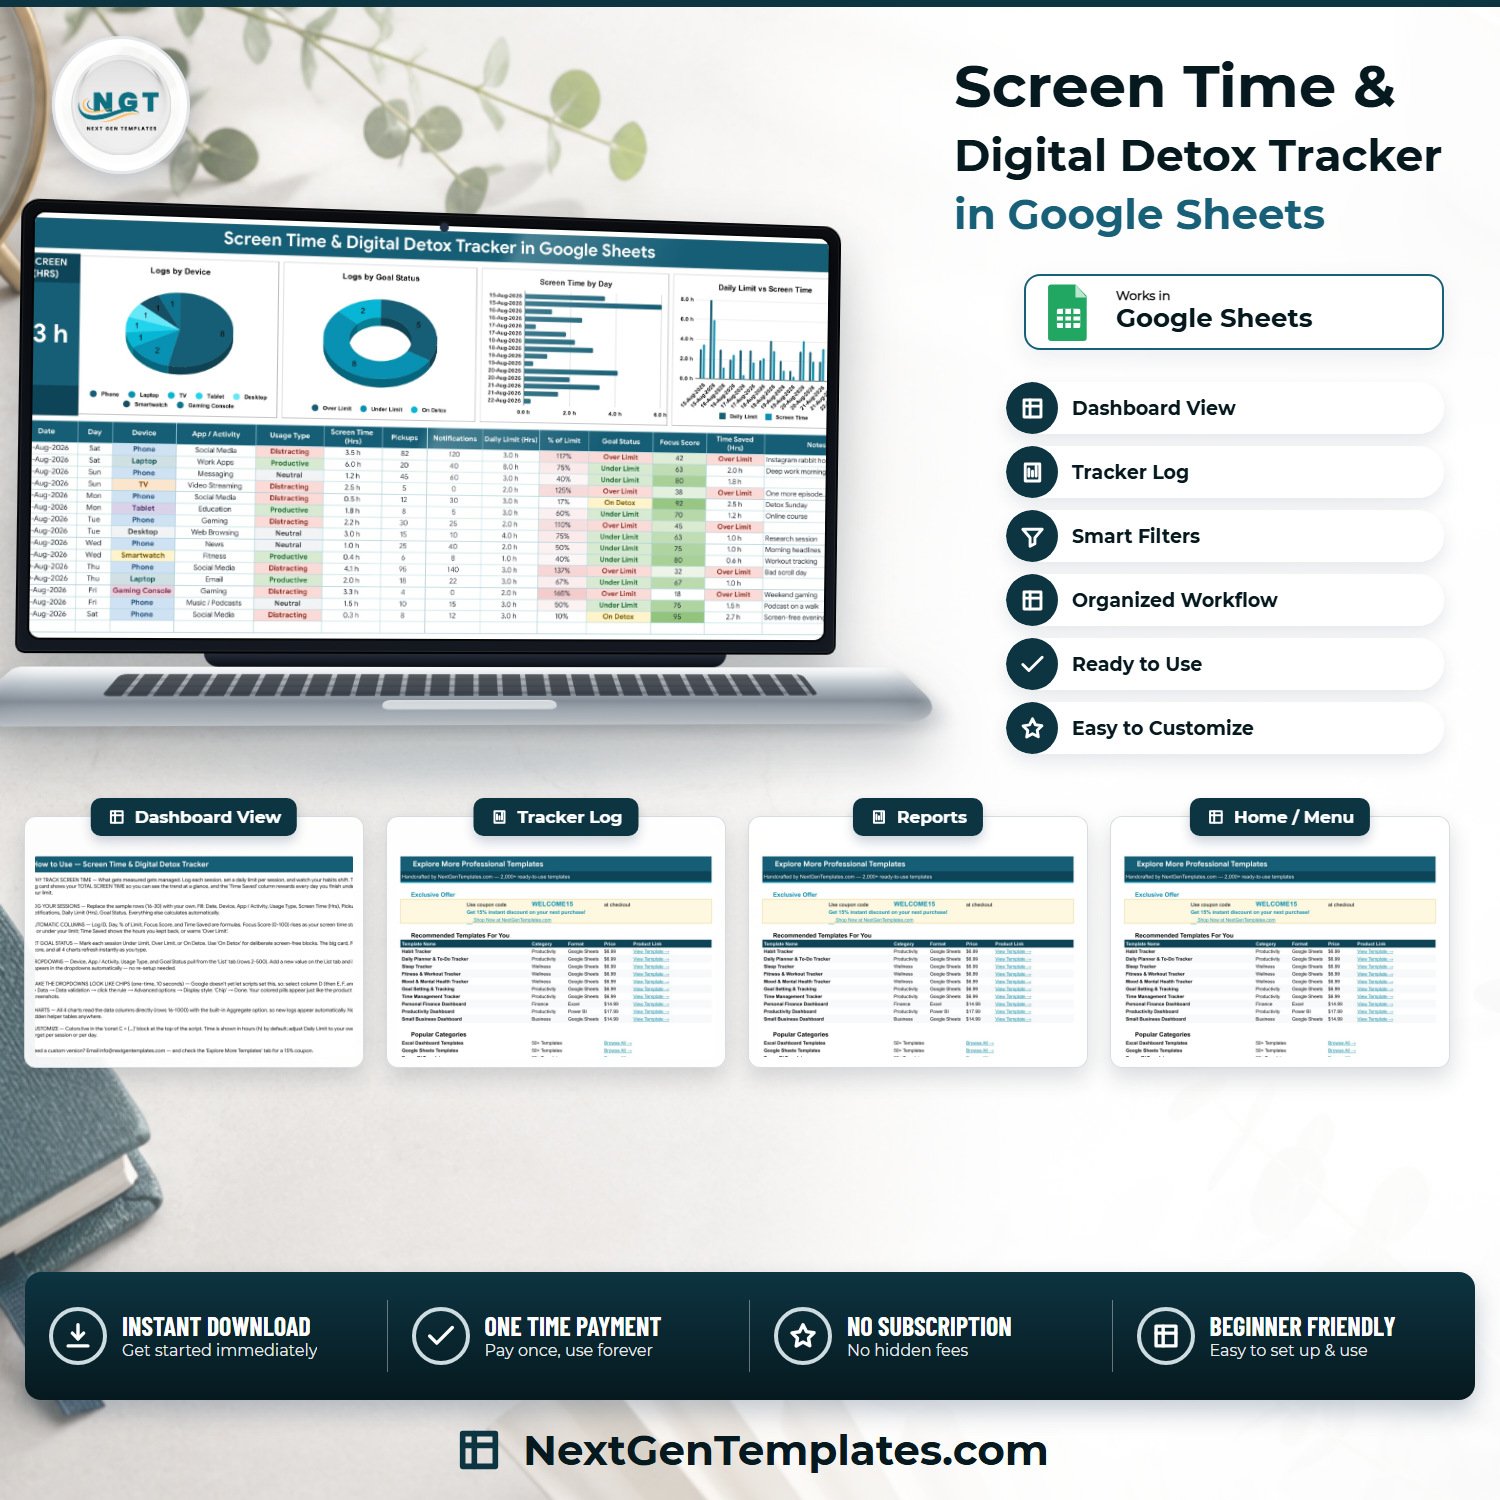

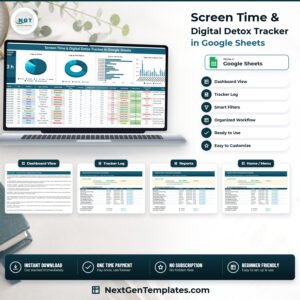
A screen time tracker in Google Sheets that you fill in yourself — 15 columns, 5 of them formulas, 4 charts and one headline card, across 4 tabs. The sample file logs 15 sessions from 15-Aug-2026 to 22-Aug-2026 and the TOTAL SCREEN TIME (HRS) card reads 33.3 h. Formulas and charts already run to row 1000, so there is room for 985 logs before you touch a thing. One payment of $6.99, no subscription, no add-on, no account. Delivered as a PDF containing a “Make a copy” link — one click puts your own private copy in your own Google Drive, and it is yours forever.
Read this first, because it decides whether the template is for you. This is a manual log. It does not measure your screen time, does not monitor your phone, does not block apps or websites, and does not sync with iOS Screen Time, Android Digital Wellbeing, or any browser extension. There is no device integration of any kind. You read the number off your phone or laptop and you type it into the sheet. Everything the template does — the card, the percentages, the focus score, the four charts — is arithmetic on numbers you entered.
Key Features of the Screen Time & Digital Detox Tracker
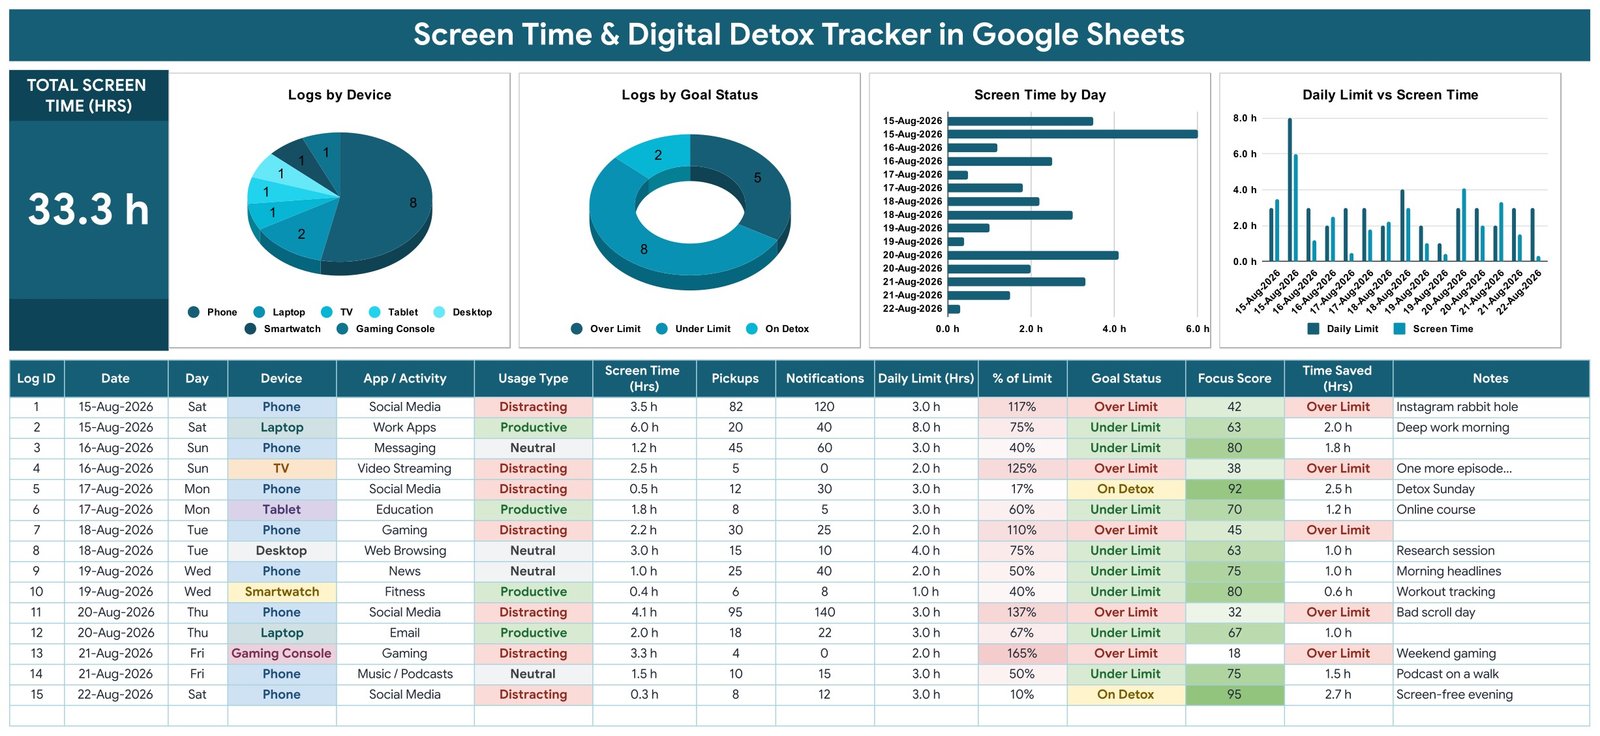
- One headline card — TOTAL SCREEN TIME (HRS). A plain
SUMof the Screen Time (Hrs) column across rows 16 to 1000. On the shipped sample it reads 33.3 h. - 15 columns, and you only type 9 of them. Date, Device, App / Activity, Usage Type, Screen Time (Hrs), Pickups, Notifications, Daily Limit (Hrs) and Goal Status are yours. Notes is optional.
- 5 formula columns. Log ID, Day, % of Limit, Focus Score and Time Saved (Hrs) fill themselves in the moment you enter a date.
- Focus Score, 0 to 100.
100 x (2 x Daily Limit - Screen Time) / (2 x Daily Limit), clamped to the 0-100 range. A 3.5 h session against a 3 h limit scores 42; a 0.3 h session against the same limit scores 95. - Time Saved (Hrs). Daily Limit minus Screen Time when you finish under, and the words “Over Limit” when you do not.
- 4 charts — Logs by Device, Logs by Goal Status, Screen Time by Day, and Daily Limit vs Screen Time — all reading rows 16 to 1000 directly, with no hidden helper tables anywhere in the file.
- 28 dropdown values on a List tab you control. 8 devices, 14 apps and activities, 3 usage types and 3 goal statuses, read from rows 2 to 500. Type a new one in and it appears in the dropdown.
- Works on the free tier of Google Sheets. No Apps Script, no macros, no add-on, no permissions prompt.
What Is Inside the Screen Time & Digital Detox Tracker
Four tabs, and that is the whole file.
1. Screen Time Tracker. The single working page. The TOTAL SCREEN TIME (HRS) card sits top-left, the four charts run along the top, and the log table starts at row 15 with headers and row 16 with data. The 15 columns are Log ID, Date, Day, Device, App / Activity, Usage Type, Screen Time (Hrs), Pickups, Notifications, Daily Limit (Hrs), % of Limit, Goal Status, Focus Score, Time Saved (Hrs) and Notes. Conditional formatting colours Usage Type, Goal Status, % of Limit and Focus Score, so an over-limit row reads red at a glance.
2. List. The four dropdown sources, one per column: Device (Phone, Tablet, Laptop, Desktop, TV, Gaming Console, Smartwatch, E-Reader), Goal Status (Under Limit, Over Limit, On Detox), App / Activity (14 entries from Social Media through to Productivity) and Usage Type (Productive, Neutral, Distracting).
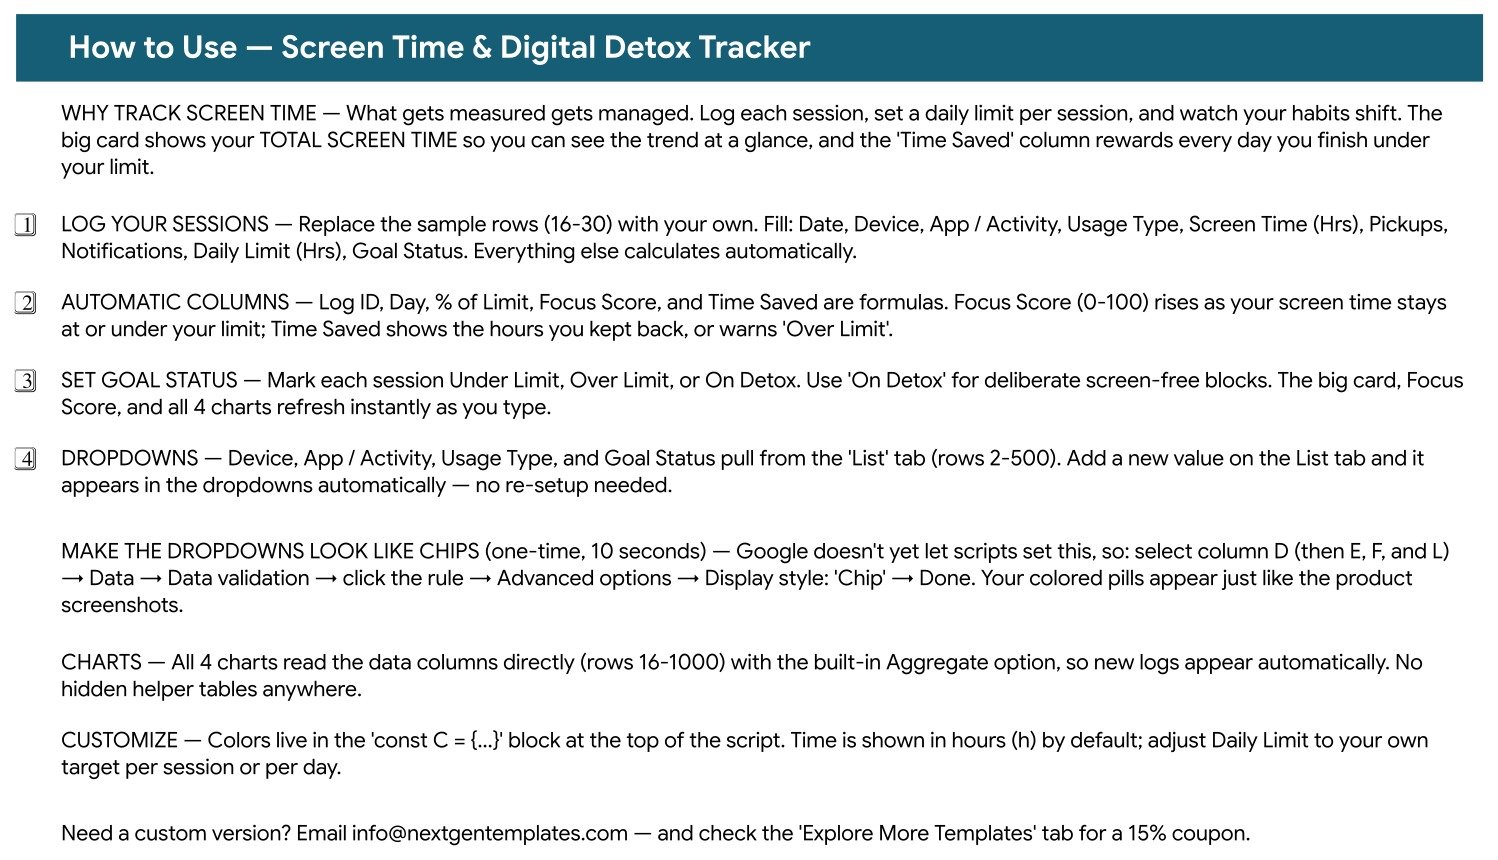
3. Instructions. Eight blocks covering what to type, what calculates itself, how the dropdowns work, and the one-time 10-second step for turning the dropdowns into coloured chips.
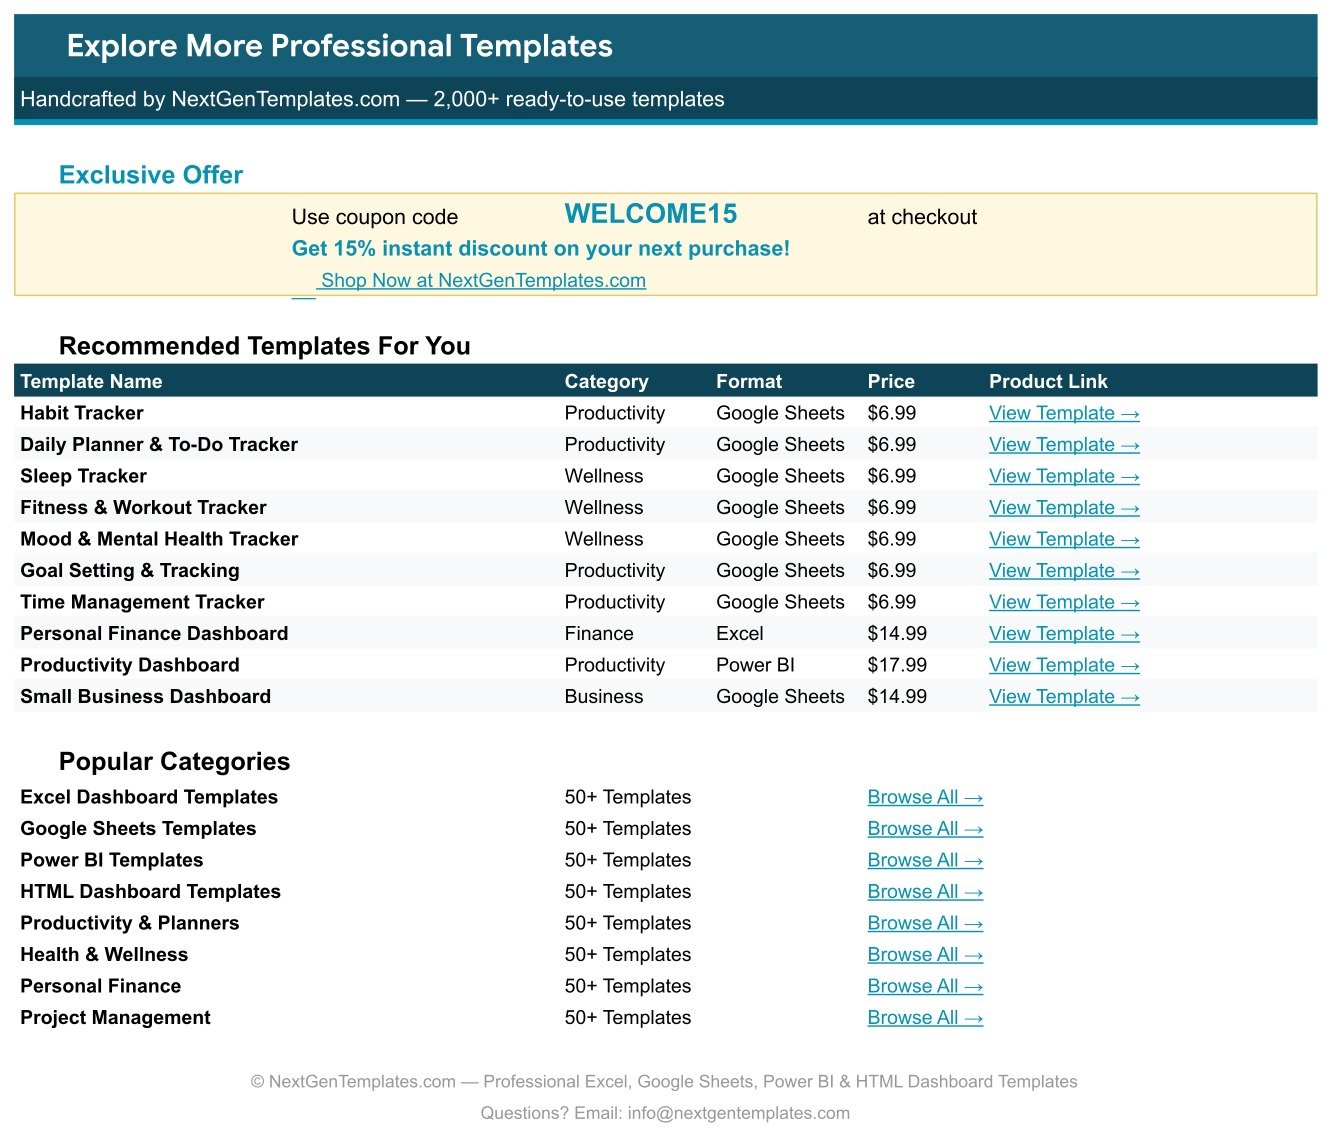
4. Explore More Templates. A WELCOME15 coupon and links to ten related NextGenTemplates files.
Screen Time Tracker in Google Sheets vs. a Spreadsheet You Build vs. a Paid Habit App
| This template | Blank Excel / Sheets file | Paid habit or focus app | |
|---|---|---|---|
| Cost | $6.99 once | Free, plus your evening | $4-$12 per month |
| Platform | Google Sheets, free tier | Excel or Sheets | Phone app plus account |
| Setup time | About 1 minute — copy and start typing | 2-4 hours to build the formulas and charts | 10 minutes, then permissions |
| Measures your screen time for you | No — you type the numbers in | No | Usually yes |
| Real-time collaboration | Yes, standard Sheets sharing | Sheets yes, Excel desktop no | Rarely |
| Mobile access | Google Sheets mobile app | Varies | Yes |
| You own the data file | Yes, in your own Drive | Yes | No, it lives on their servers |
| Customisable columns | Yes, it is an ordinary sheet | Yes | Almost never |
| Year-1 cost, 5 people | $6.99 | $0 plus 5 evenings | $240-$720 |
| Row capacity out of the box | 985 logs (rows 16-1000) | Whatever you build | Unlimited |
Who This Template Is For — and Who It Is Not For
It fits if you already glance at your phone’s weekly report and want somewhere to keep those numbers so you can see a month or a year of them side by side; if you run a deliberate detox and want the screen-free evenings on the record next to the ordinary ones; if you are a parent or a household agreeing limits and want one shared sheet everyone can see; or if you are a student or freelancer separating Productive hours from Distracting ones.
It does not fit if you want the numbers captured automatically — nothing here talks to your device. It does not fit if you want app blocking, website filtering, focus timers or notifications. It does not fit if you want per-minute accuracy; the Screen Time column is decimal hours, so 20 minutes is 0.3. And it is not a clinical or diagnostic tool. It cannot tell you whether your use is a problem, and nothing in it is health advice. If screen use is affecting your sleep, work or relationships, talk to a qualified professional — a spreadsheet is not one.
How to Use the Screen Time & Digital Detox Tracker
- Open the PDF you receive and click the “Make a copy” link. Google puts a private copy in your Drive. Nothing is shared back to us.
- Delete the 15 sample rows in rows 16-30 once you have looked at how they are filled in.
- Log a session. Date, Device, App / Activity, Usage Type, Screen Time in decimal hours, Pickups, Notifications, your Daily Limit, and a Goal Status. Log ID, Day, % of Limit, Focus Score and Time Saved appear on their own.
- Use “On Detox” as the Goal Status for a deliberate screen-free block, so those sessions read differently from the ones where you simply came in under.
- Add your own dropdown values on the List tab — a device, an app, a category. The dropdowns read to row 500.
- Turn the dropdowns into chips (optional, 10 seconds). Select column D, then E, F and L: Data > Data validation > click the rule > Advanced options > Display style: Chip. That gives you the coloured pills you see in the screenshots. Google does not let a script set this, which is why it is a manual step.
Real-World Use Cases
Priya, freelance designer. She logs two rows a day — one laptop row for Work Apps with an 8 h limit, one phone row for Social Media with a 1 h limit. After four weeks the Daily Limit vs Screen Time chart shows her the work rows almost always land under and the phone rows almost never do, which is not what she assumed before she started writing it down.
The Okafor family. One shared sheet, one row per child per evening, with Goal Status agreed in advance. Sunday is logged “On Detox”. The Logs by Goal Status donut is the only thing anyone has to look at on a Sunday night.
Daniel, final-year student. He uses the Usage Type column only — Productive, Neutral, Distracting — and ignores Pickups and Notifications entirely. Deleting the two columns he does not want takes ten seconds, because it is an ordinary Google Sheet and not an app.
Frequently Asked Questions
Does this measure my screen time automatically?
No. There is no tracking, no monitoring, no app, no extension and no device permission. You read the figure off your phone’s or laptop’s own screen-time report and type it into the sheet. Every number the template shows is calculated from what you typed.
Does it sync with iPhone Screen Time or Android Digital Wellbeing?
No. There is no integration, import or API connection to either. It is a plain Google Sheet with formulas in it.
Can it block apps or send me a reminder?
No. It cannot block, filter, limit, alert, notify or nudge. It records what already happened, after you type it in.
How many rows can I log?
The formulas and all four charts run from row 16 to row 1000, which is 985 logs. If you want more, drag the formulas down and widen the chart ranges — nothing is locked.
What is the Focus Score, exactly?
A single formula: 100 x (2 x Daily Limit - Screen Time) / (2 x Daily Limit), rounded and clamped between 0 and 100. It is a convenience number for comparing your own sessions against your own limits. It is not a benchmark, a norm, or a health measure of any kind.
Why does Time Saved say “Over Limit” instead of a number?
By design — the column shows the hours you kept back when you finish under your limit, and the words “Over Limit” when you do not. That does mean the column mixes text and numbers, so a plain SUM across it will not work. If you want a total of hours saved, use SUMIF on the numeric entries.
Do I need a paid Google account?
No. It runs on the free tier of Google Sheets. There is no Apps Script, no macro and no add-on, so you will never see a permissions prompt.
Can I use it in Excel?
You can export it to .xlsx, but it was built for Google Sheets, and the chip-style dropdowns and Sheets-specific formatting will not survive the trip intact.
About the Author
Built by PK – Microsoft Certified Professional with 15+ years of Excel, Google Sheets, and Power BI experience. Founder of NextGenTemplates, reaching 300K+ subscribers across YouTube channels. Every template is hand-built and tested before release.
Explore Related Templates
- Digital Detox Checklist in Google Sheets — the checklist companion to this log
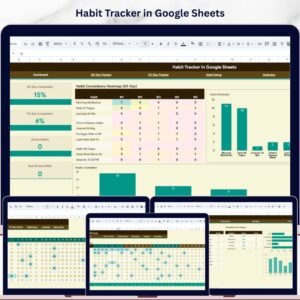
- Habit Tracker in Google Sheets — for the habits you are replacing the screen time with
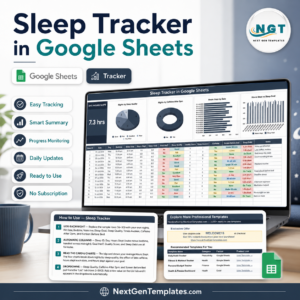
- Sleep Tracker in Google Sheets — the obvious pairing for late-night phone use
- Mood & Mental Health Tracker in Google Sheets
- Weekly Planner with Goals Tracker in Google Sheets
- Browse the whole Productivity and Google Sheets collections.
Get the Screen Time & Digital Detox Tracker in Google Sheets for $6.99 — one payment, instant download, yours to keep and edit. Click “Make a copy” in the PDF and you are logging in under a minute.
Watch the step-by-step video Demo:
Last updated: 4 September 2026.
Compatibility and Requirements
- Works in Google Sheets. You need a free Google account and a web browser.
- You pick the device, app, usage type and goal status from dropdowns. Google explains dropdowns in Create an in-cell dropdown list.
Related Digital Wellness Templates
- Digital Detox Checklist in Google Sheets: a checklist to go with this log
- Digital Detox Checklist in Excel: the same checklist for Excel
- Sleep Tracker in Google Sheets: track sleep next to late-night screen use
- Habit Tracker in Google Sheets: track the habits you replace screen time with
Browse all Google Sheets trackers.









Reviews
There are no reviews yet.