

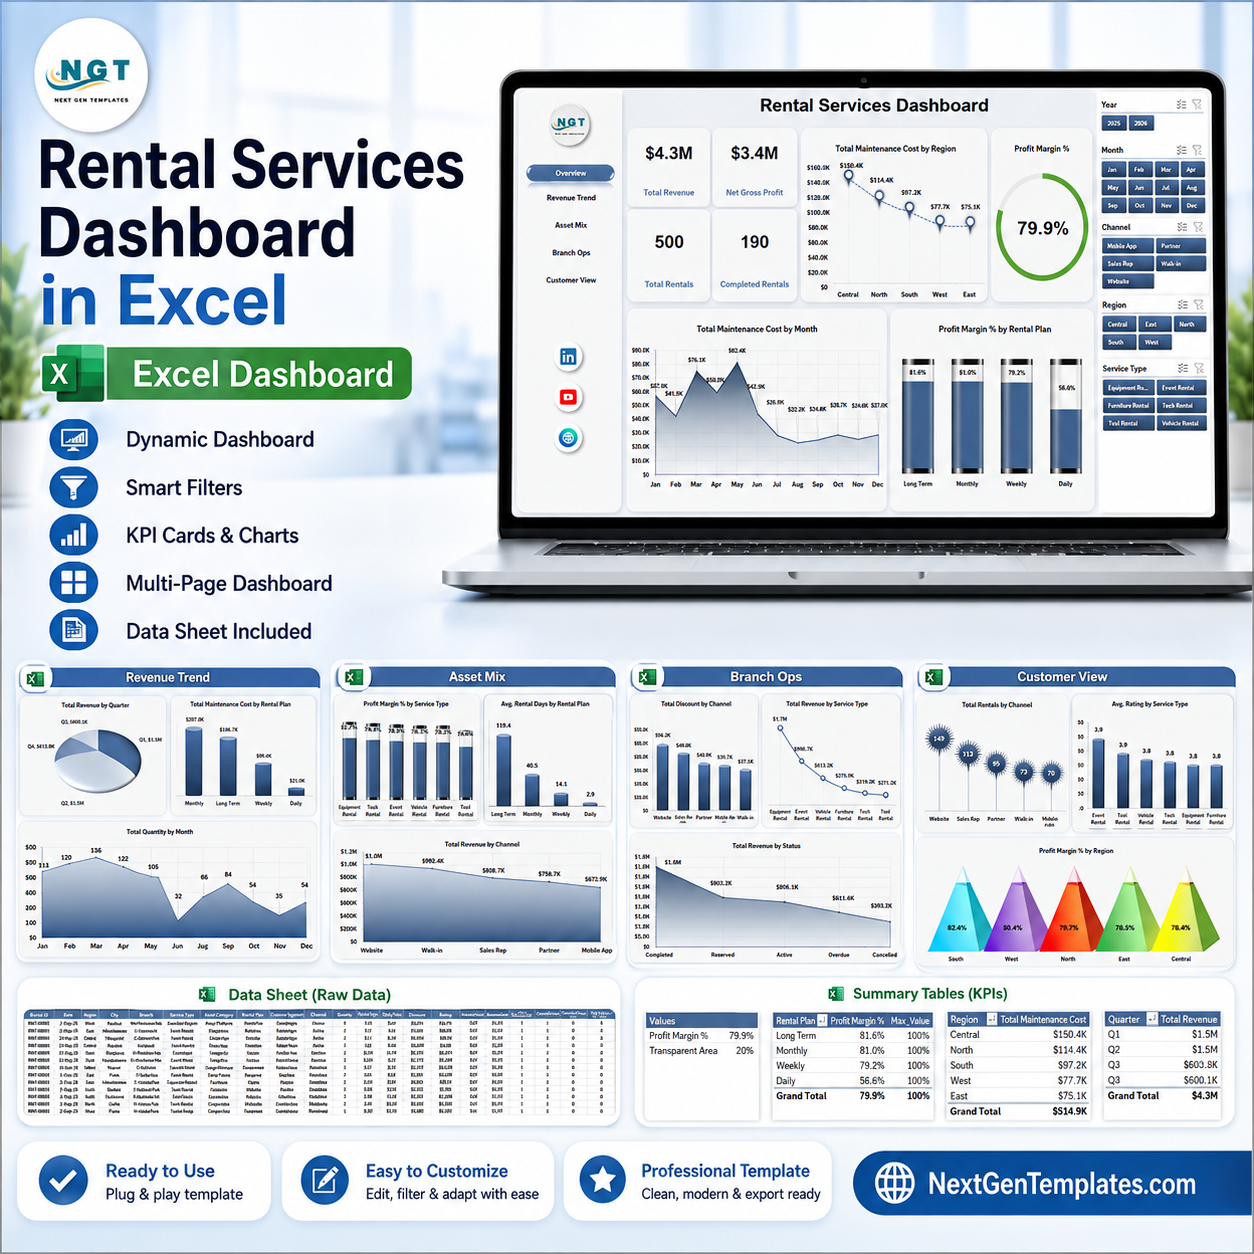



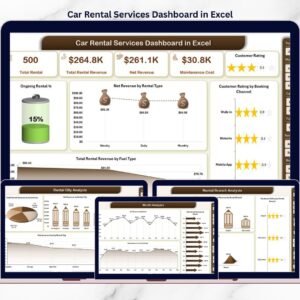
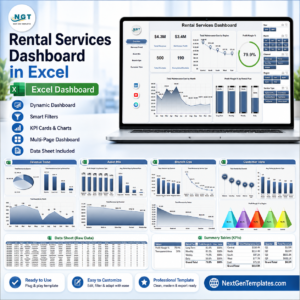
Rental Services Dashboard in Excel helps rental business owners, operations managers, branch leaders, and finance teams track revenue, gross profit, rentals, completion volume, maintenance cost, delivery cost, discounts, ratings, channels, regions, service types, and rental plans in one ready-to-use workbook. The template includes 7 worksheet tabs, 4 executive KPI cards, 20 chart views, multiple slicers, a structured Data Sheet, and a Support Sheet built with pivot tables. Built by PK with 15+ years of Excel dashboard experience and backed by a 300K+ subscriber learning audience, this template gives teams a practical reporting file they can update, refresh, review, and adapt before using it for internal decisions.
Rental Services Dashboard in Excel
Key Features of Rental Services Dashboard in Excel
- 7 worksheet tabs for Overview, Revenue Trend, Asset Mix, Branch Ops, Customer View, Data Sheet, and Support Sheet.
- 4 high-level KPI cards for Total Revenue, Net Gross Profit, Total Rentals, and Completed Rentals.
- 20 chart views covering revenue, profit margin, maintenance cost, rental plan, service type, channel, region, month, customer segment, rating, status, and quantity.
- Multiple slicers to filter the dashboard quickly during monthly rental reviews, branch meetings, and operations analysis.
- Refreshable pivot-table structure: update the Data Sheet, then use Refresh All from the Excel Data ribbon.
- Editable Excel workbook so users can adjust labels, chart styles, slicers, pivot fields, and source data to match their rental model.
What’s Inside the Rental Services Dashboard in Excel
1. Overview Page
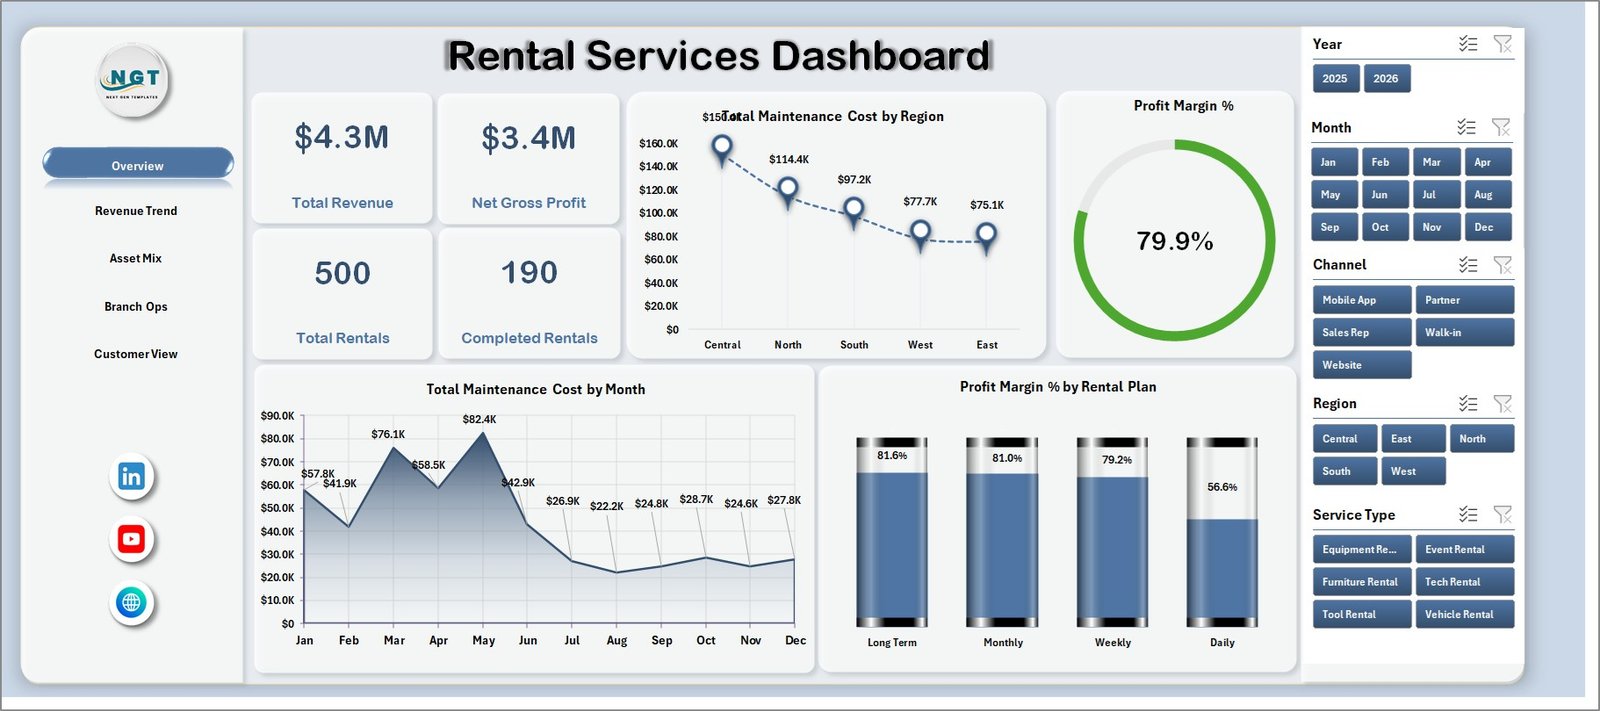
The Overview Page gives leadership a fast read on business health. The top cards show Total Revenue, Net Gross Profit, Total Rentals, and Completed Rentals so users can review income, profitability, rental volume, and completion status before moving into the detailed tabs.
Total Maintenance Cost by Region: This chart compares maintenance cost across regions. It helps managers identify locations where asset servicing, repair frequency, or vendor costs may need review.
Profit Margin % by Overall Rentals: This chart connects profit margin with rental activity. It helps users see whether higher rental volume is producing better margin or only adding operational load.
Total Maintenance Cost by Month: This monthly chart shows when maintenance spending rises or falls. It is useful for spotting seasonal cost spikes and planning preventive maintenance budgets.
Profit Margin % by Rental Plan: This chart compares margin across rental plans. It helps teams understand which pricing or plan structures are more profitable.
Overview Page
2. Revenue Trend
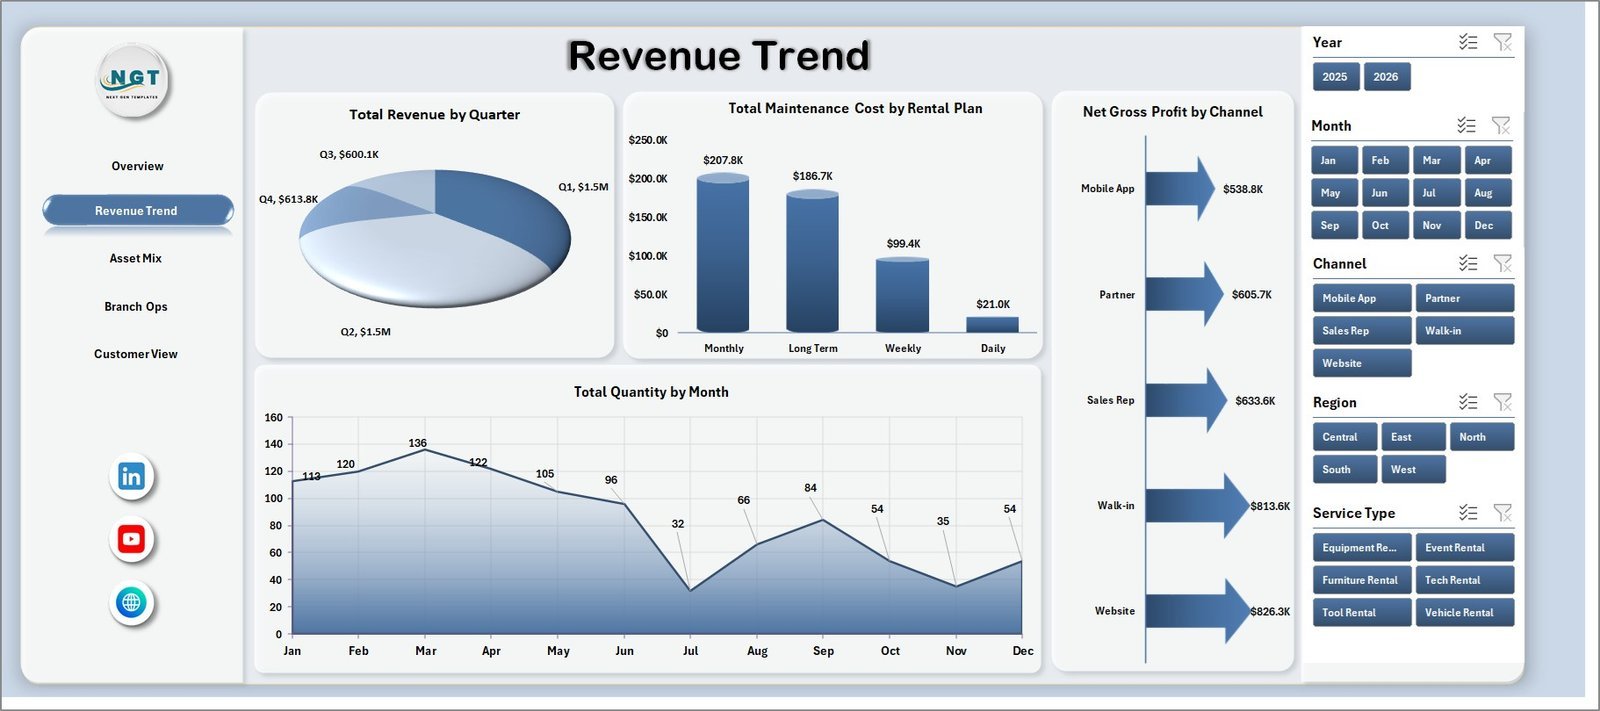
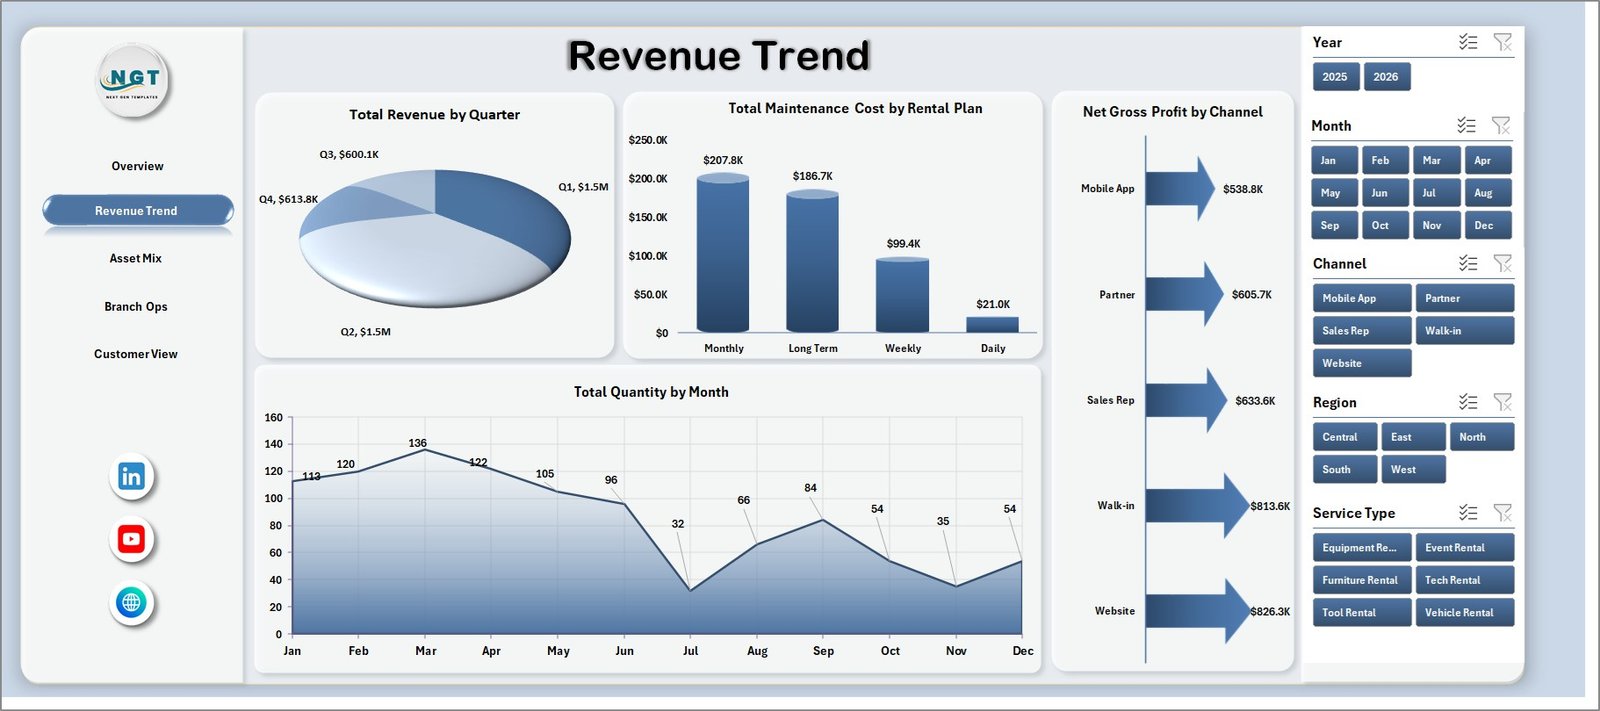
The Revenue Trend sheet focuses on how revenue, maintenance cost, gross profit, and quantity move over time and across plans or channels. It is useful for finance teams and branch managers reviewing monthly or quarterly performance.
Total Revenue by Quarter: This chart shows quarter-wise revenue movement. It helps identify growth, slowdown, seasonality, and the timing of strong rental demand.
Total Maintenance Cost by Rental Plan: This chart compares maintenance cost by plan. It helps managers see whether specific rental plans create higher service or repair pressure.
Net Gross Profit by Channel: This chart compares profit by booking or sales channel. It helps teams decide which channels deserve more marketing effort or tighter cost control.
Total Quantity by Month: This chart tracks monthly rental quantity. It helps operations teams compare volume trends with revenue and cost changes.
Revenue Trend
3. Asset Mix
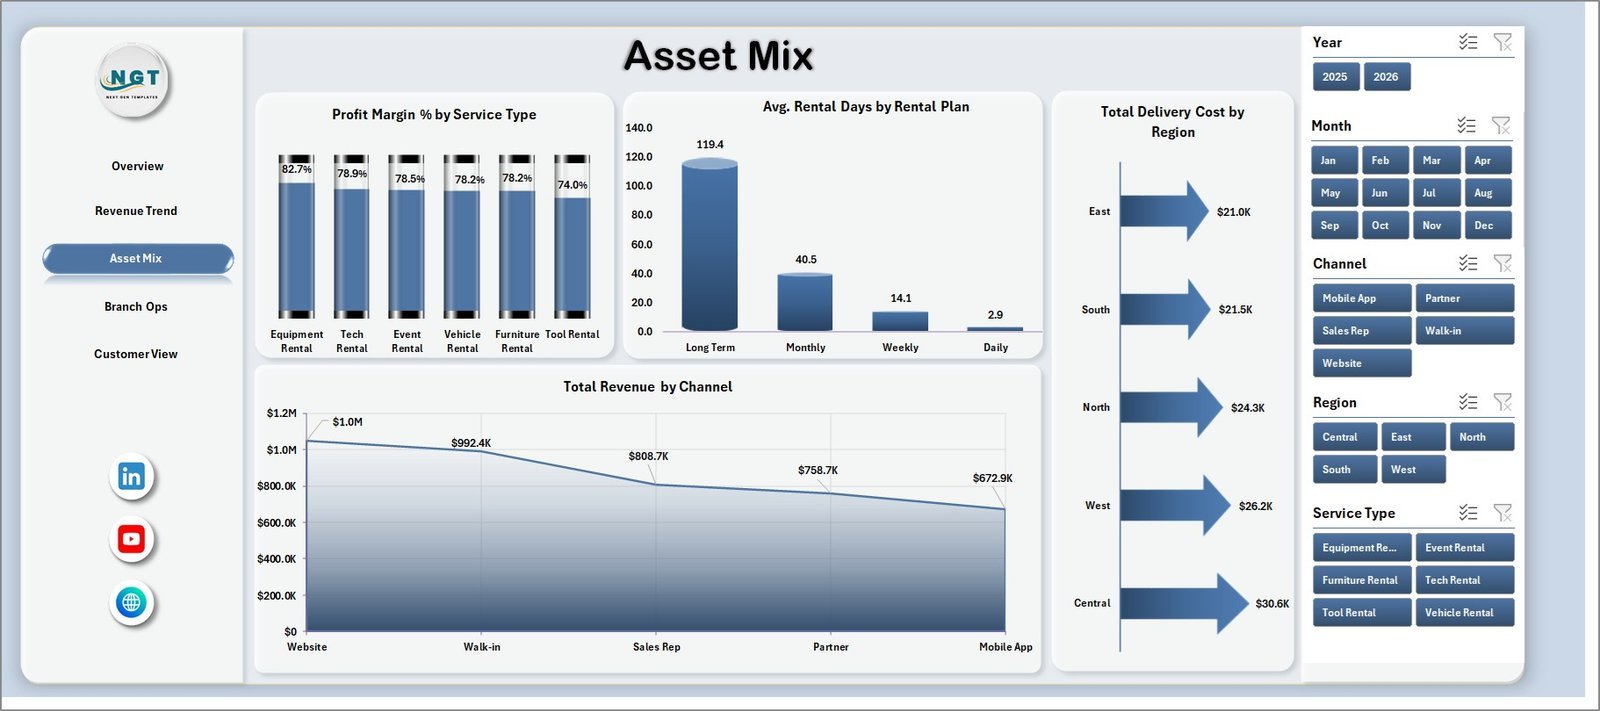
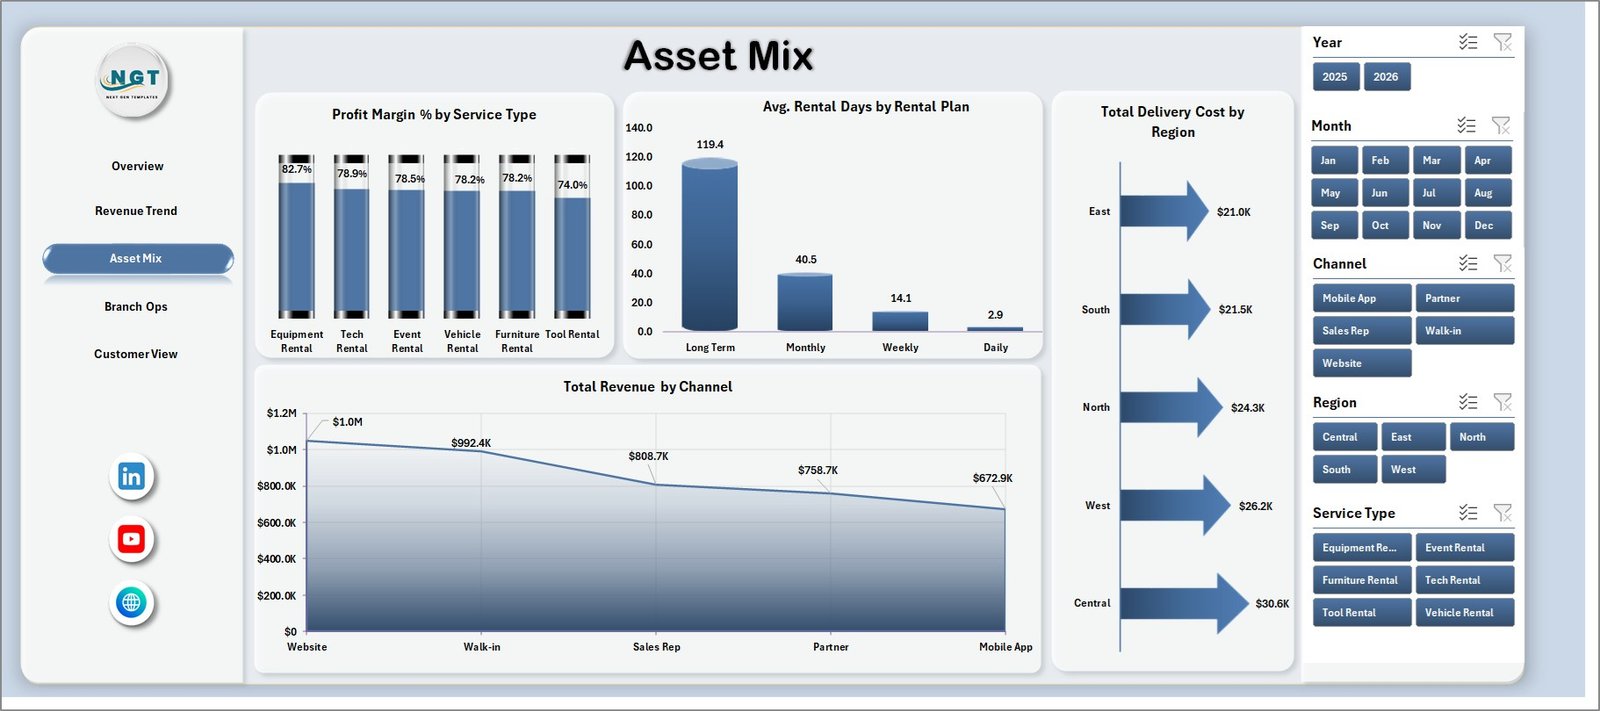
The Asset Mix sheet helps users review profitability, rental duration, delivery cost, and channel revenue across the rental asset and service portfolio. It supports decisions about which services, plans, and channels are worth expanding.
Profit Margin % by Service Type: This chart compares margin by service type. It helps teams identify service lines that create stronger returns or require pricing review.
Avg. Rental Days by Rental Plan: This chart shows average rental duration by plan. It helps managers understand which plans keep assets occupied longer.
Total Delivery Cost by Region: This chart compares delivery cost across regions. It is useful for controlling logistics spend and reviewing regional delivery efficiency.
Total Revenue by Channel: This chart shows revenue contribution by channel. It helps users understand whether online, direct, partner, or branch channels are driving sales.
Asset Mix
4. Branch Ops
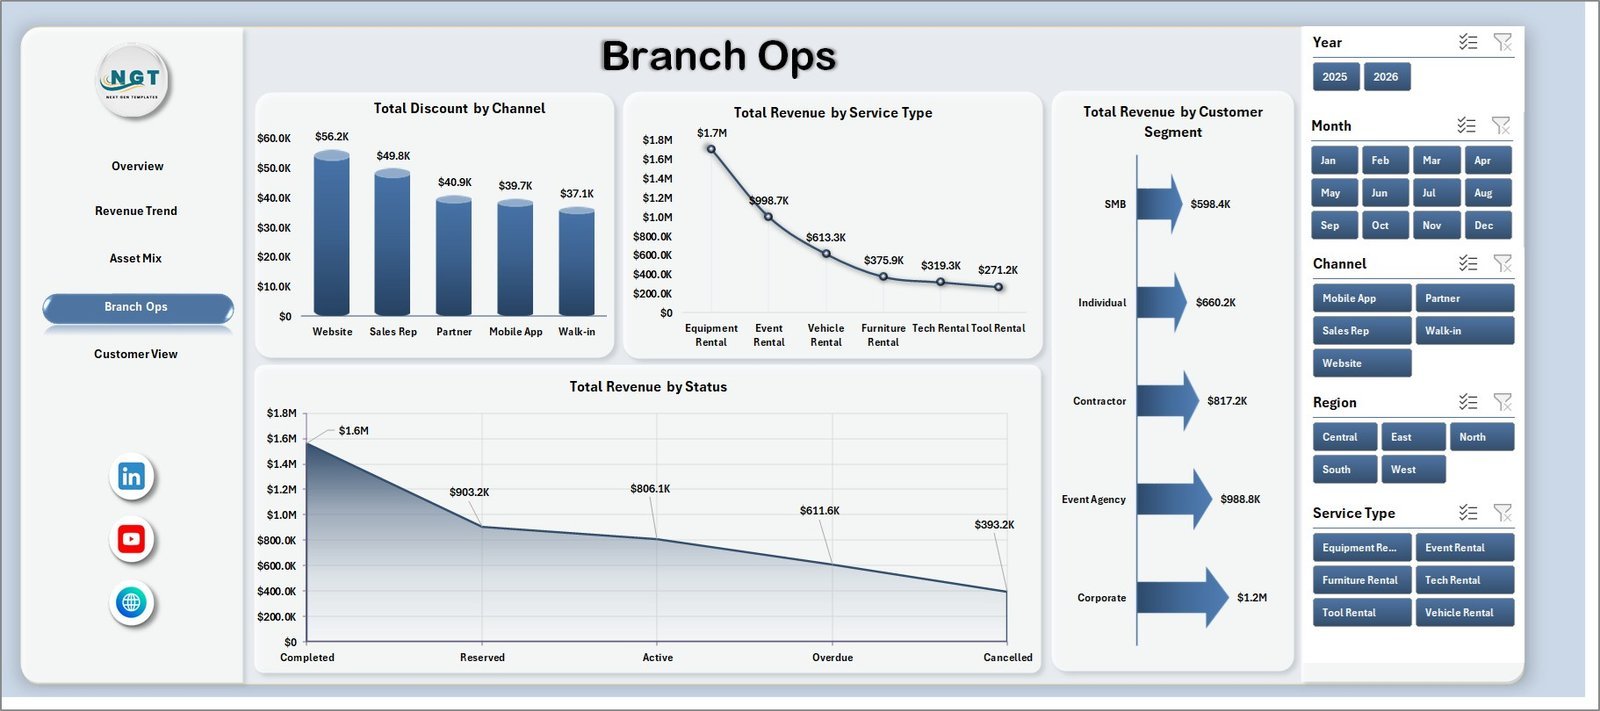
The Branch Ops sheet is built for operational comparison. It reviews discounting, service-type revenue, customer segment revenue, and status-based revenue so managers can understand how branches and customer groups are performing.
Total Discount by Channel: This chart shows discount value by channel. It helps teams find where discounting is highest and whether promotions are being used effectively.
Total Revenue by Service Type: This chart compares revenue by service type. It helps branch managers focus on services that contribute the most to income.
Total Revenue by Customer Segment: This chart breaks revenue by customer segment. It helps teams understand whether retail, corporate, repeat, or other segment types are driving demand.
Total Revenue by Status: This chart groups revenue by rental status. It helps users see how much revenue sits in completed, pending, cancelled, or other status categories.
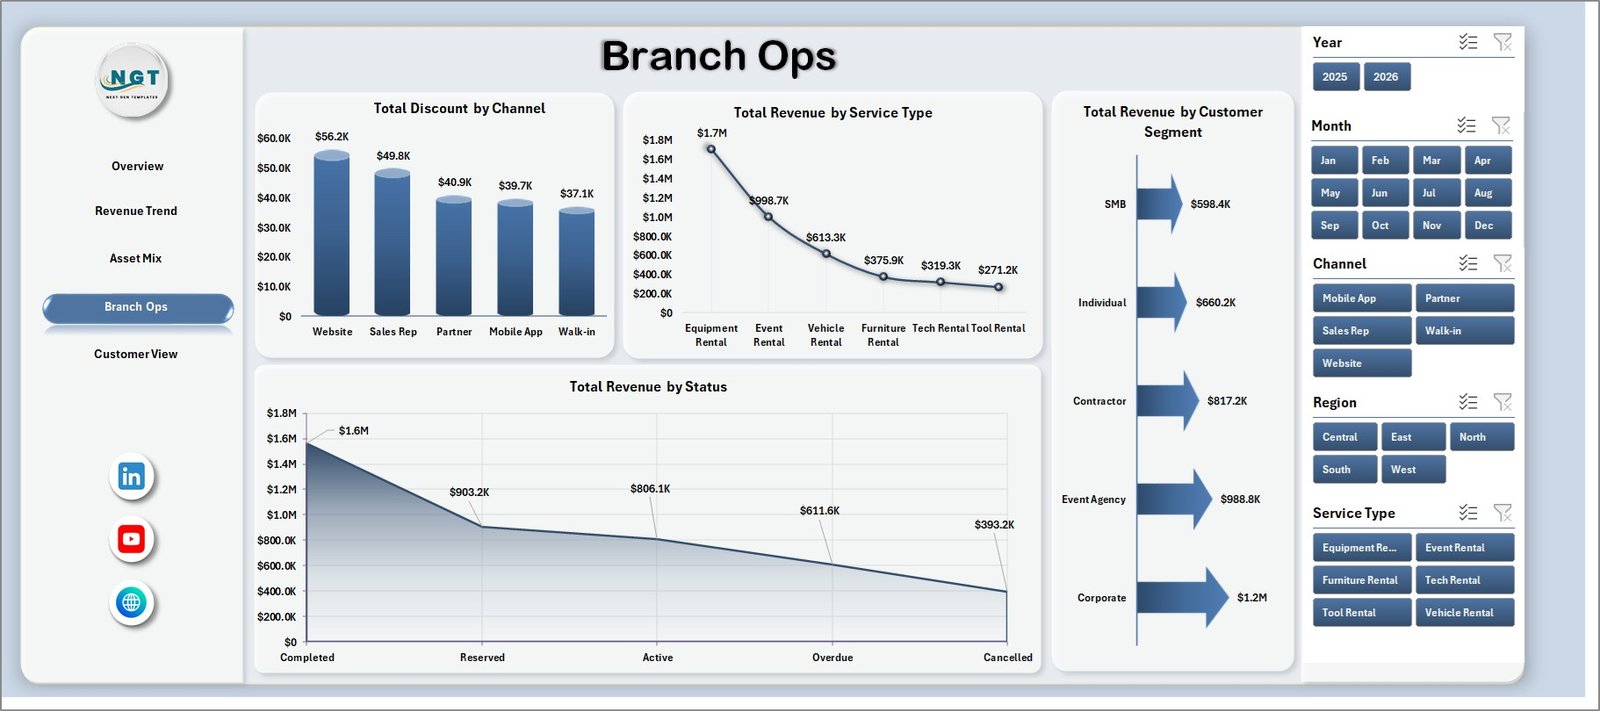
Branch Ops
5. Customer View
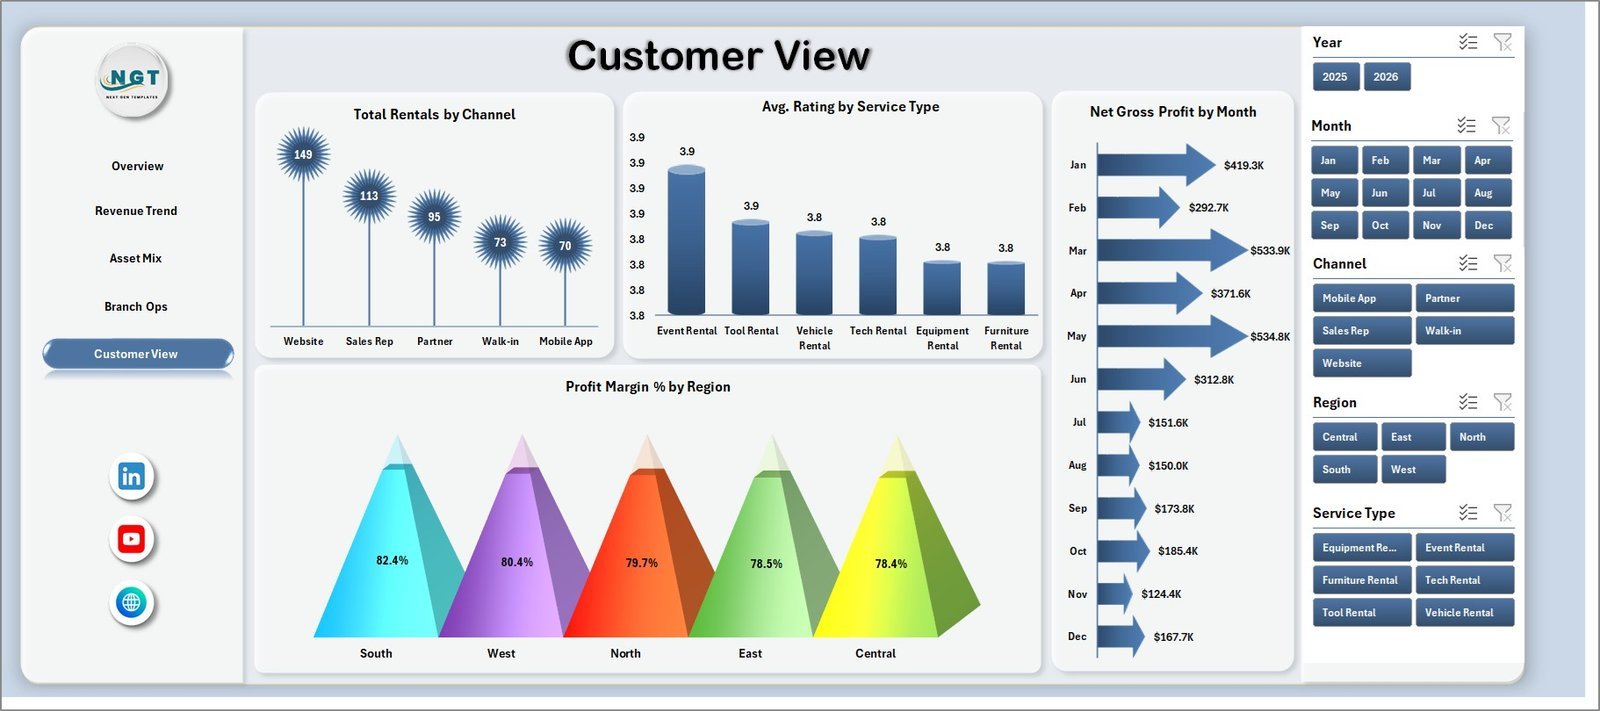
The Customer View sheet connects rental volume, service rating, net gross profit, and regional margin. It is useful for customer service teams, regional managers, and owners who want to connect customer experience with profitability.
Total Rentals by Channel: This chart compares rental count by channel. It helps users understand where customers are booking most often.
Avg. Rating by Service Type: This chart shows average customer rating by service type. It helps managers identify service lines with stronger or weaker customer experience.
Net Gross Profit by Month: This chart tracks monthly profit. It helps finance and operations teams see whether margin is improving over time.
Profit Margin % by Region: This chart compares regional margin. It helps identify high-performing regions and areas where cost, discounting, or plan mix may need attention.
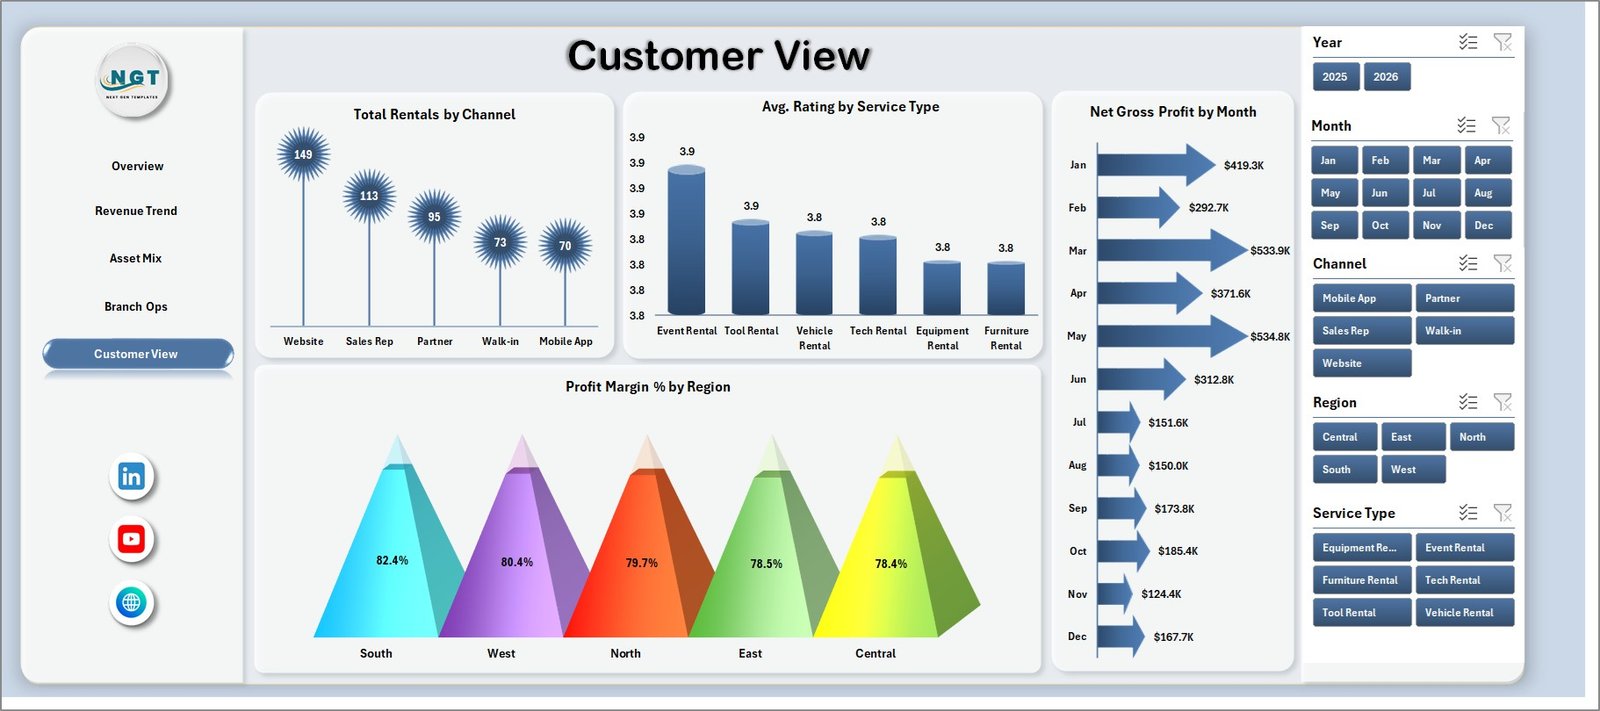
Customer View
6. Data Sheet Tab
The Data Sheet is where users add or replace rental service records in the same format. Keep the column structure consistent so the dashboard cards, charts, slicers, and pivot tables refresh correctly.

Data Sheet tab
7. Support Sheet
The Support Sheet contains multiple pivot tables used to create the entire dashboard dynamically. After updating the Data Sheet, go to the Data tab in the Excel ribbon and click Refresh All. All pivots and charts refresh together, and you can keep this sheet hidden during regular use.

Support sheet tab
Rental Services Dashboard in Excel vs. Google Sheets vs. Paid CRM/SaaS – Where This Fits
| Feature | This Excel dashboard | Google Sheets alternative | Paid rental SaaS |
|---|---|---|---|
| Cost | $17.99 one-time sale price | Low software cost but manual build required | Recurring subscription |
| Platform | Microsoft Excel | Google Sheets | Vendor cloud platform |
| Setup time | Download, update data, refresh | Build tables, formulas, charts, and filters | Configuration, onboarding, and training |
| Customizable fields | Editable workbook, pivots, slicers, and charts | Editable spreadsheet model | Limited by vendor permissions |
| Year-1 cost at 5 users | $17.99 template plus Excel access | Workspace access plus setup time | Often hundreds or thousands per year |
| Rental reporting fit | Best for refreshable performance reporting | Best for lightweight shared tracking | Best for live booking and workflow management |
Who This Template Is For – and Who It’s Not For
This template is useful for rental service owners, branch managers, operations heads, finance analysts, customer service teams, fleet coordinators, equipment rental teams, car rental teams, event rental companies, and consultants who need a clean Excel reporting dashboard.
It is not a full booking system, payment gateway, live inventory tracker, dispatch tool, customer portal, or maintenance ticketing system. Use it as a reporting layer when your rental records can be exported or entered into Excel.
How to Use the Rental Services Dashboard in Excel
- Download and unzip the product package.
- Open the workbook in Microsoft Excel.
- Review the sample records in the Data Sheet.
- Replace the sample data with your own rental service data in the same format.
- Go to the Excel Data ribbon and click Refresh All.
- Use slicers on each dashboard page to filter by region, channel, rental plan, service type, month, status, or customer segment.
- Hide the Support Sheet before sharing the workbook with viewers who only need the dashboard pages.
Real-World Use Cases
Amit, rental business owner: Amit reviews Total Revenue, Net Gross Profit, and Completed Rentals each week before deciding where to increase marketing spend.
Neha, branch operations manager: Neha uses Branch Ops to compare revenue by service type, discount by channel, and status-based revenue before branch review meetings.
Marcus, finance analyst: Marcus uses Revenue Trend and Customer View to compare maintenance cost, net gross profit, and margin by month and region.
Frequently Asked Questions
What is included in the Rental Services Dashboard in Excel?
The workbook includes Overview, Revenue Trend, Asset Mix, Branch Ops, Customer View, Data Sheet, and Support Sheet tabs with KPI cards, slicers, charts, source data, and pivot tables.
Can I use my own rental service data?
Yes. Replace the sample records in the Data Sheet with your own data in the same column format, then refresh the workbook.
Does this dashboard require macros?
No. The dashboard is designed around Excel tables, pivot tables, slicers, and charts.
Can I customize the dashboard?
Yes. You can edit sheet names, chart styles, slicers, pivot fields, labels, and source fields if you are comfortable with Excel.
Is this a rental management software replacement?
No. It is a reporting dashboard. It does not handle live booking, payments, contracts, dispatch, or customer communication.
Which Excel version should I use?
Use a modern desktop version of Microsoft Excel for the best pivot refresh and slicer experience.
About the Author
Built by PK – Microsoft Certified Professional with 15+ years of Excel, Google Sheets, and Power BI experience. Founder of NextGenTemplates, reaching 300K+ subscribers across YouTube channels. Every template is hand-built and tested before release.
Explore Related Templates
- Read the detailed blog post
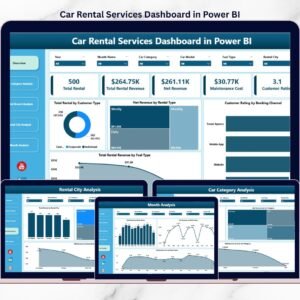
- Car Rental Services Dashboard in Power BI
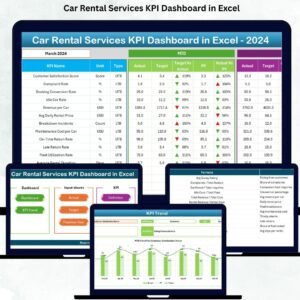
- Car Rental Services KPI Dashboard in Excel
- Rental Equipment Management System Web App
- MS Excel templates
- Excel dashboard templates
Ready to review rental revenue, profit, maintenance cost, delivery cost, customer ratings, channels, regions, and rental plans in one place? Download the Rental Services Dashboard in Excel and turn your rental data into a refreshable reporting workbook.
Last updated: August 2, 2026
Watch the demo video:
Compatibility and Requirements
- Works in Microsoft Excel desktop (Excel 2016 or later, or Microsoft 365). No macros are used.
- The dashboard is built with pivot tables and slicers. Microsoft explains slicers in Use slicers to filter data.


















Reviews
There are no reviews yet.