

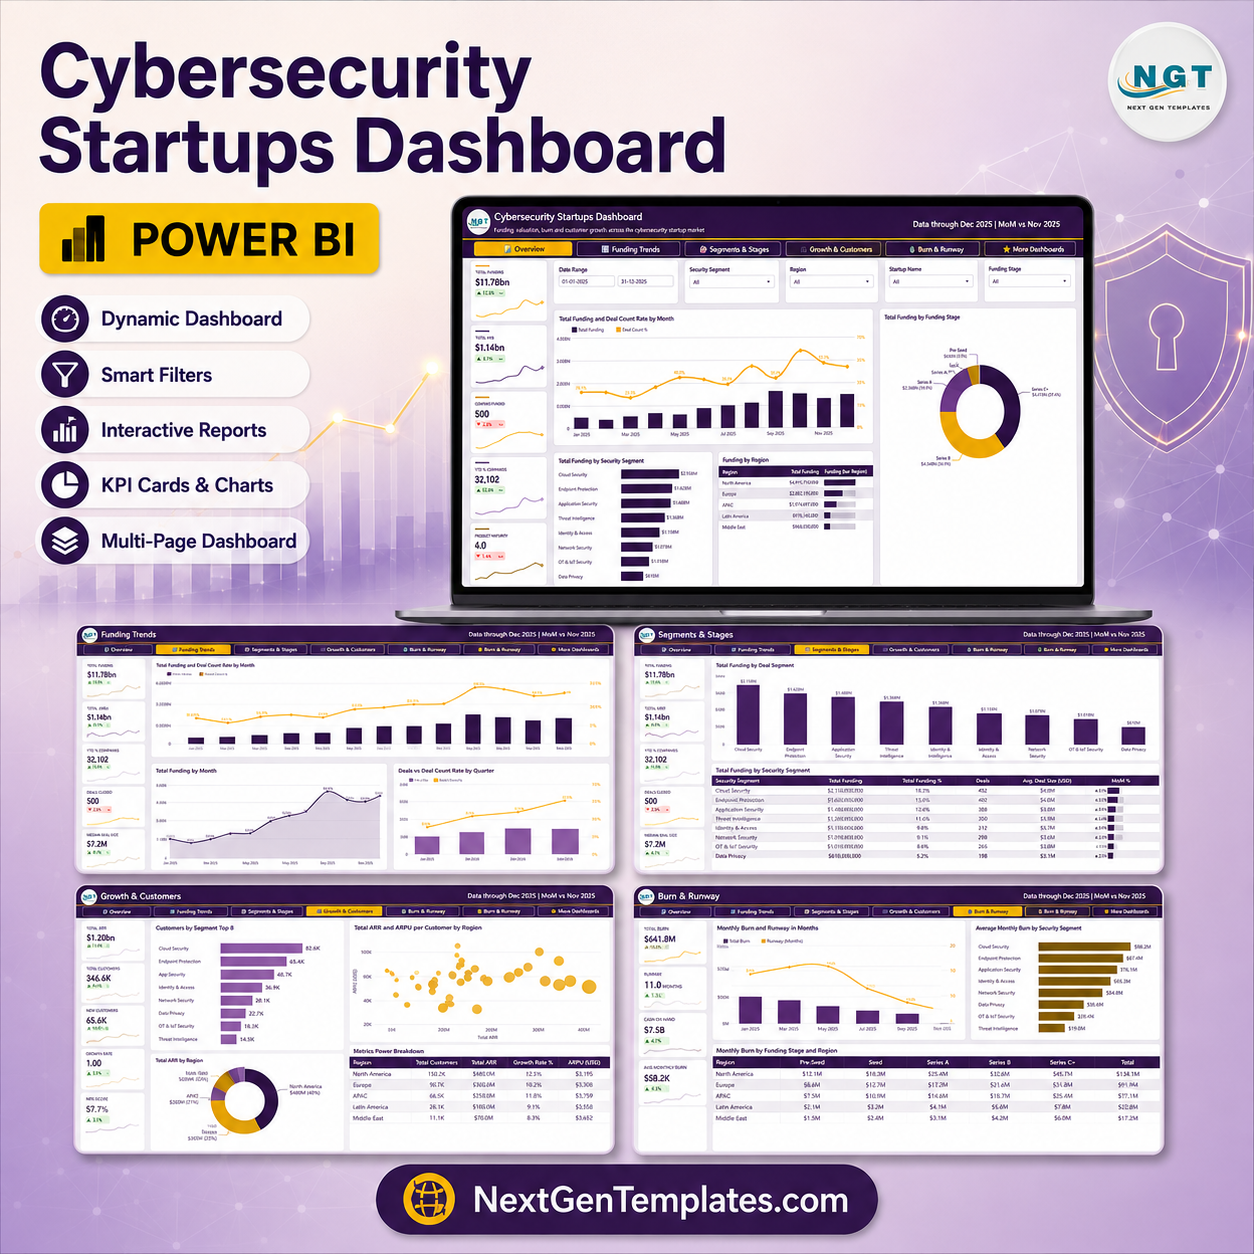

The Cybersecurity Startups Dashboard in Power BI is a ready-to-open .pbix report that turns a flat deal list into a five-page investor view of the cybersecurity startup market: $11.78bn of tracked funding, $77.61bn of aggregate valuation, $1.14bn of ARR and 500 sample deals across 8 security segments, 5 funding stages, 5 regions, 5 investor types and 5 deal statuses. Nineteen distinct KPI cards, seventeen charts and tables, six synced slicers and a hidden drillthrough page are already wired up. It opens populated on day one – no modelling, no blank canvas – and every visual, measure and colour stays editable. One-time $17.99, instant download, lifetime access, and a commercial licence that lets you rebrand it for client work.
Key Features of the Cybersecurity Startups Dashboard in Power BI
- Five analysis pages plus an upsell page – Overview, Funding Trends, Segments & Stages, Growth & Customers and Burn & Runway, with a Get More Dashboards page at the end of the navigation strip.
- 19 distinct KPI cards across 25 card slots – Total Funding, Total ARR, Deals Tracked, Total Customers, Product Rating, Avg Deal Size, Total Valuation, Deal Close Rate, ARR per Customer, Valuation Multiple, Avg Valuation, Funding per Startup, Customer Churn, Total Headcount, Monthly Burn, Runway (Months), Burn Multiple, Capital Efficiency and ARR per Employee.
- Month-on-month deltas with sparklines – every card carries a MoM arrow against the prior month and a 12-point trend line, so a number is never shown without its direction.
- Six slicers per page, four of them synced – Date Range, Security Segment, Region and Startup Name follow you across all five pages; the fifth slot changes per page to Funding Stage, Deal Status or Investor Type.
- A hidden Details drillthrough page – right-click any visual and drill through on Startup Name, Security Segment, Funding Stage, Region, Investor Type or Deal Status to see the underlying rows.
- Two hidden tooltip pages – Metric Detail and Trend Detail (280×360) pop up on hover instead of the default one-line tooltip.
- 37 DAX measures referenced by the visuals – written out in the model, named in plain English, and reusable in your own reports.
- 500 sample deal records in 16 columns – Deal ID, Date, Startup Name, Security Segment, Funding Stage, Region, Investor Type, Deal Status, Funding Raised, Valuation, ARR, Customer Count, Customers Churned, Headcount, Monthly Burn and Product Rating.
- Point it at your own workbook – one file path to change in Power Query, then Refresh; the model, the measures and all five pages follow.
What’s Inside the Cybersecurity Startups Dashboard in Power BI
The download is a single ZIP holding three files: the .pbix report, the Data.xlsx sample workbook that feeds it, and a Power BI Dashboard – User Manual PDF. Nothing else is needed – Power BI Desktop is free from Microsoft.
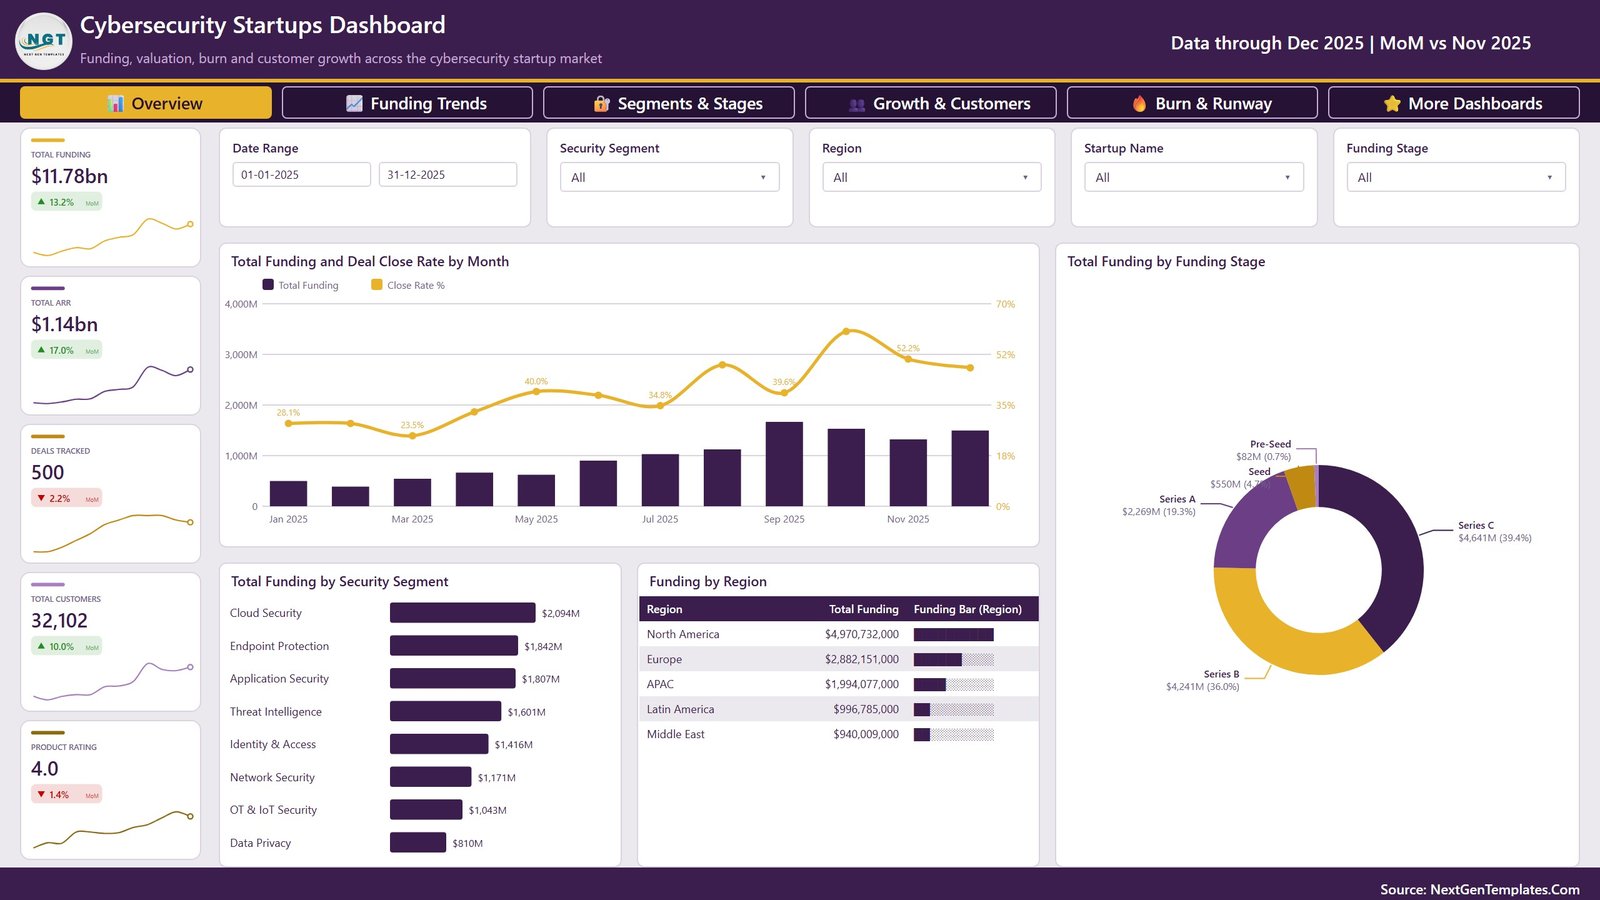
Page 1 – Overview. Total Funding $11.78bn, Total ARR $1.14bn, Deals Tracked 500, Total Customers 32,102 and Product Rating 4.0 sit down the left. The main combo chart is Total Funding and Deal Close Rate by Month; beside it a donut breaks Total Funding by Funding Stage (Series C $4,641M / 39.4%, Series B $4,241M / 36.0%, Series A $2,269M / 19.3%, Seed $550M / 4.7%, Pre-Seed $82M / 0.7%). Below, Total Funding by Security Segment ranks Cloud Security $2,094M ahead of Endpoint Protection $1,842M and Application Security $1,807M, and a Funding by Region table puts North America at $4.97bn against Europe’s $2.88bn.
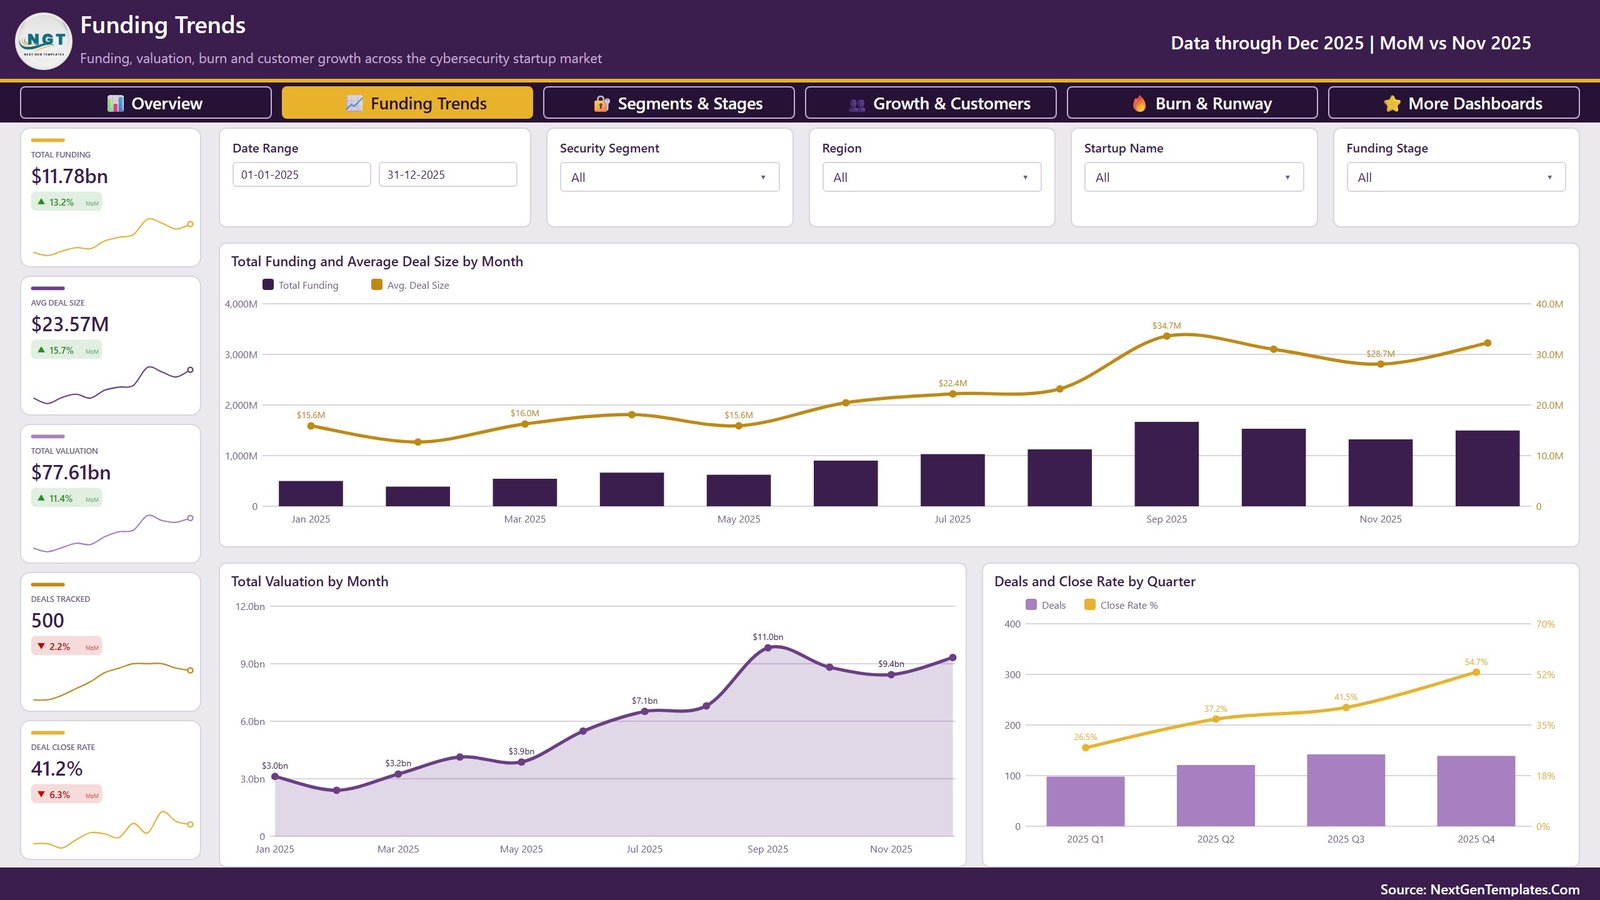
Page 2 – Funding Trends. Avg Deal Size $23.57M, Total Valuation $77.61bn and Deal Close Rate 41.2% join the header cards. Total Funding and Average Deal Size by Month shows deal size climbing from $15.6M in January to $34.7M in September; Total Valuation by Month is an area chart running $3.0bn to $9.4bn; Deals and Close Rate by Quarter lifts the close rate from 26.5% in Q1 to 54.7% in Q4.
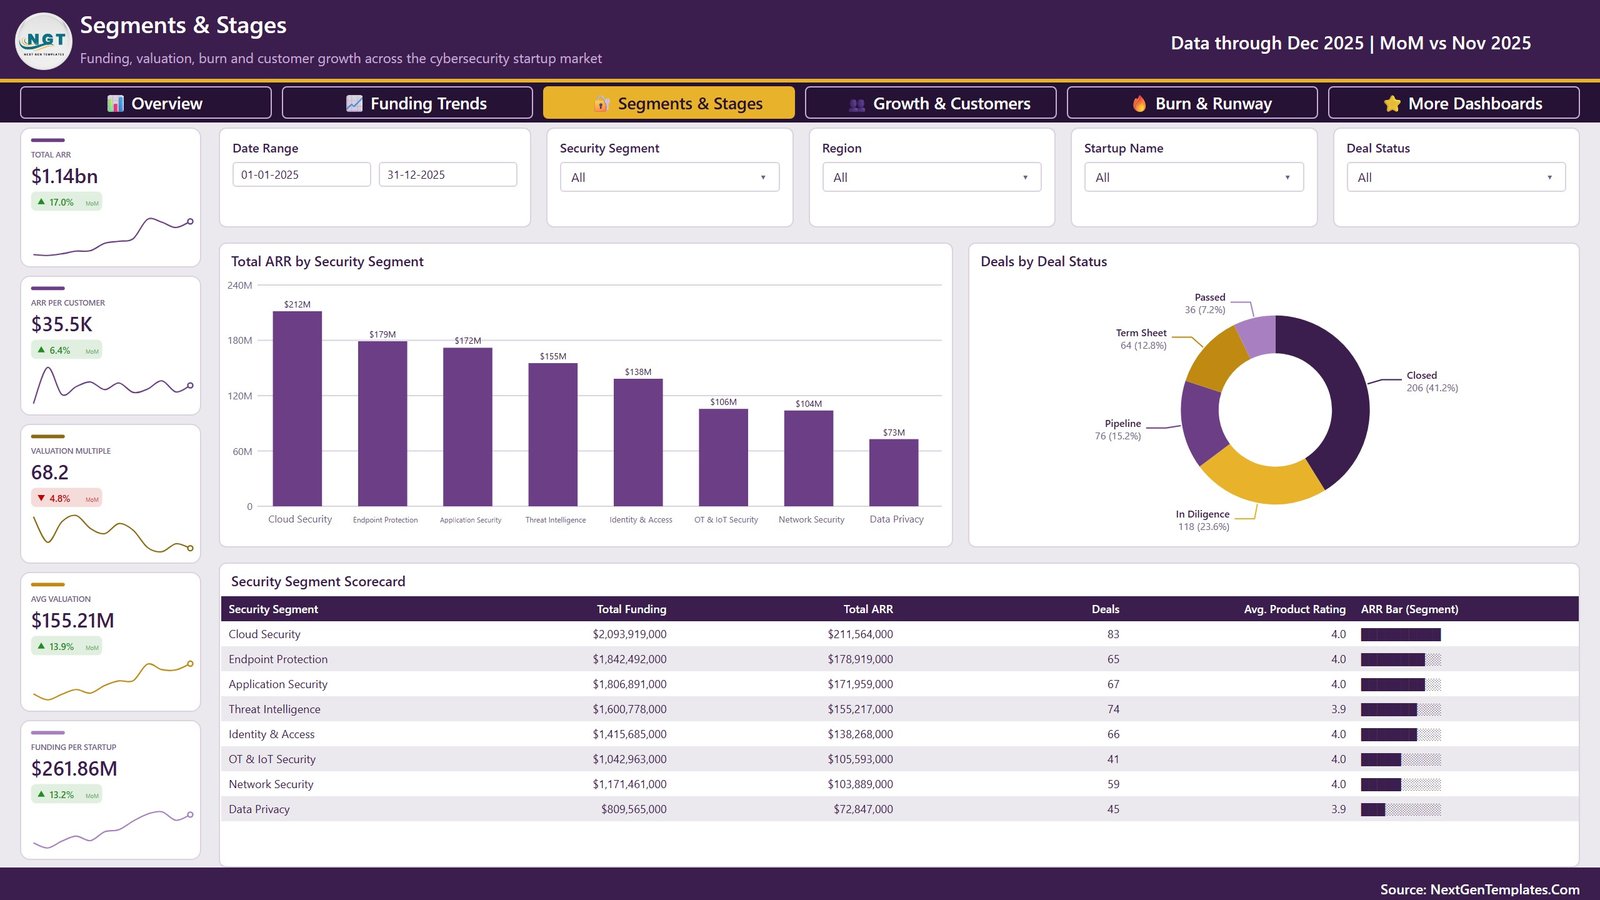
Page 3 – Segments & Stages. ARR per Customer $35.5K, Valuation Multiple 68.2, Avg Valuation $155.21M and Funding per Startup $261.86M. Total ARR by Security Segment tops out at Cloud Security $212M; Deals by Deal Status splits the 500 deals into Closed 206 (41.2%), In Diligence 118 (23.6%), Pipeline 76 (15.2%), Term Sheet 64 (12.8%) and Passed 36 (7.2%). The Security Segment Scorecard table carries funding, ARR, deal count, average product rating and a data bar for all eight segments.
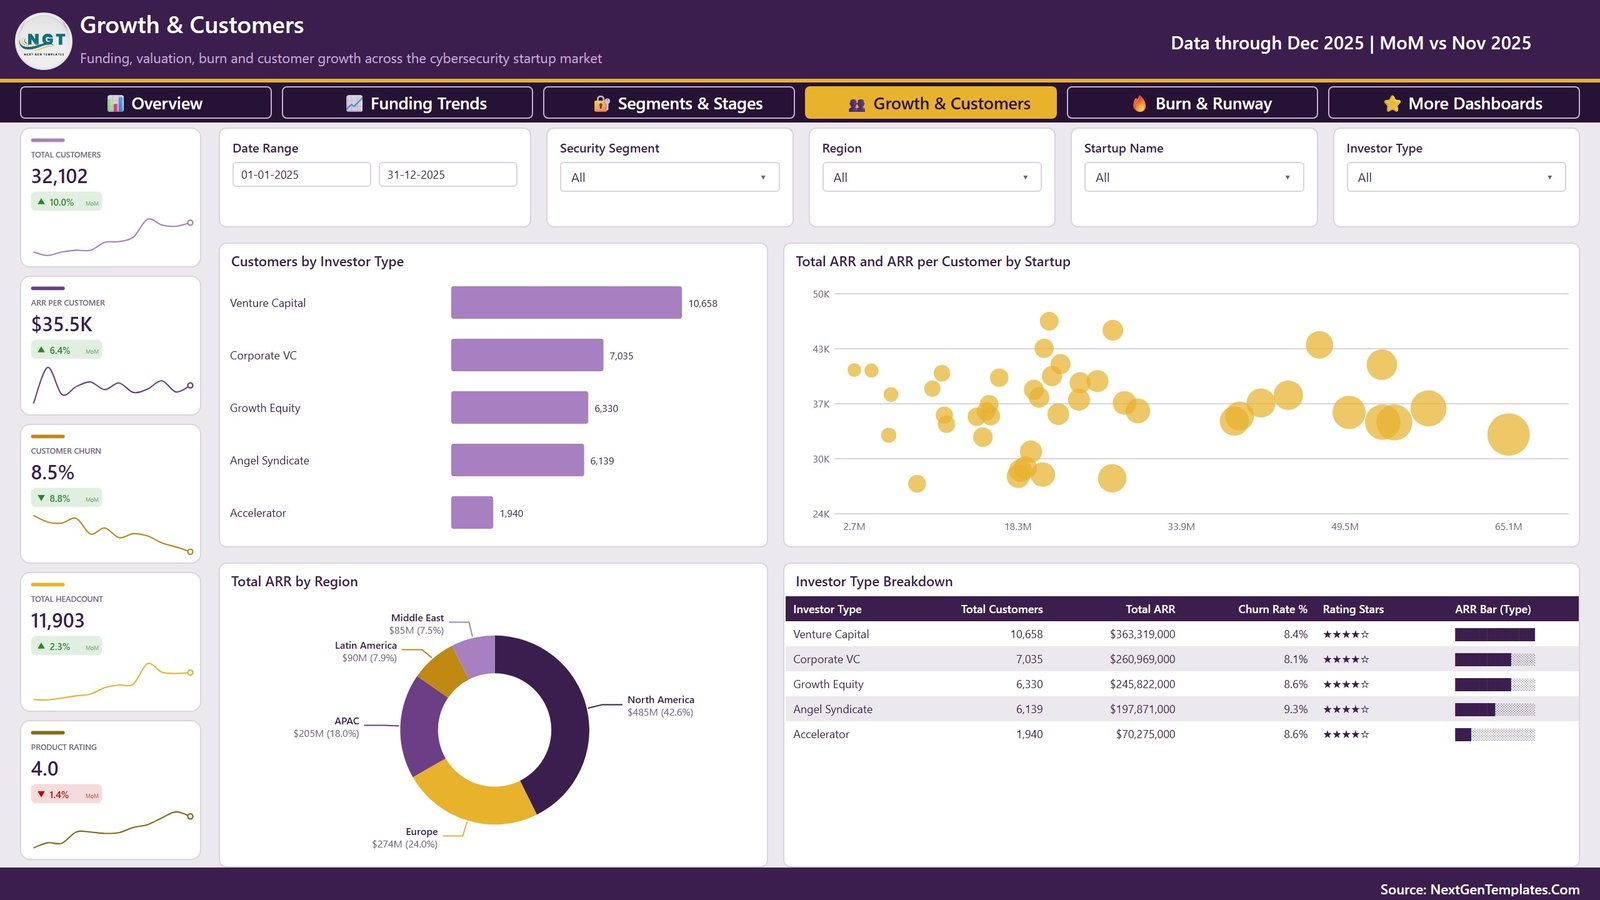
Page 4 – Growth & Customers. Customer Churn 8.5%, Total Headcount 11,903. Customers by Investor Type runs Venture Capital 10,658 down to Accelerator 1,940; a scatter plots Total ARR and ARR per Customer by Startup; Total ARR by Region gives North America $485M (42.6%); the Investor Type Breakdown table adds churn rate and a star rating per investor type.
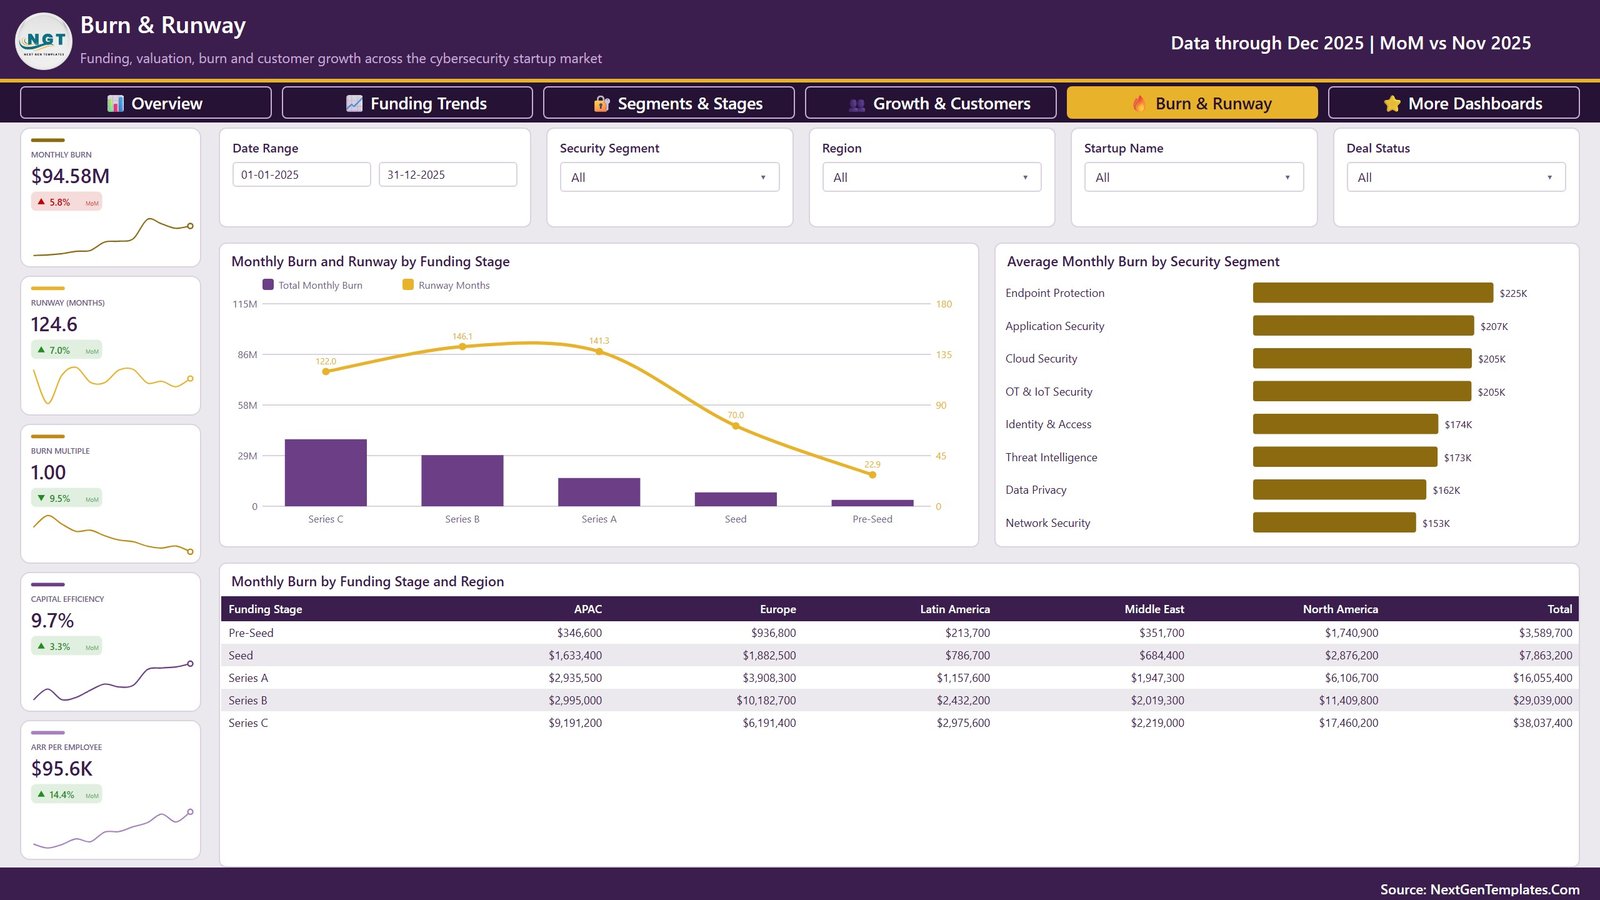
Page 5 – Burn & Runway. Monthly Burn $94.58M, Runway 124.6 months, Burn Multiple 1.00, Capital Efficiency 9.7% and ARR per Employee $95.6K. Monthly Burn and Runway by Funding Stage shows runway falling from 146.1 months at Series B to 22.9 at Pre-Seed; Average Monthly Burn by Security Segment leads with Endpoint Protection $225K; and a matrix breaks Monthly Burn by Funding Stage and Region down to the cell.
Cybersecurity Startups Dashboard in Power BI vs. Tableau vs. Paid Market-Data SaaS – Where This Fits
| This template (Power BI) | Tableau / Qlik build | PitchBook or CB Insights | |
|---|---|---|---|
| Cost | $17.99 one time | $75+/user/month for Tableau Creator | $15,000-$30,000+ per seat, per year |
| Platform | Power BI Desktop (free) or Power BI Service | Tableau Desktop / Qlik Sense | Vendor web platform |
| Setup time | Minutes – open the .pbix, it is already populated | Days to model and lay out from scratch | Instant, but you get their data, not yours |
| Real-time team collaboration | Via Power BI Service workspaces | Via Tableau Server / Cloud | Yes |
| Mobile access | Power BI mobile app | Tableau mobile | Yes |
| Customisable fields | Every column, measure, visual and colour | Yes, if you build it | No – fixed vendor schema |
| Share with a link | Yes, once published to the Service | Yes | Yes, per licensed seat |
| Year-1 cost at 5 users | $17.99 (plus $0 if you stay in Desktop) | $4,500+ | $75,000+ |
| Market data included | No – 500 sample rows you replace with your own | No | Yes, that is what you are buying |
| Burn, runway and capital-efficiency measures | Built in and editable | Write them yourself | Portfolio modules, extra cost |
Who This Template Is For – and Who It’s Not For
It is for venture capital and corporate VC analysts covering the security sector, accelerator and syndicate managers reporting on a cohort, corporate development teams screening acquisition targets, and security founders assembling an investor update from their own pipeline. It also suits BI consultants who want a finished Power BI report to rebrand for a client, and anyone learning DAX who would rather read 37 working measures than start from an empty model.
It is not for you if you expected live market data – there is none, and no connection to Crunchbase, PitchBook or CB Insights; you replace the 500 sample rows with your own. It is also not a security operations dashboard: despite the topic, it does not track threats, vulnerabilities, CVEs, patch status, SIEM alerts, incidents or compliance controls, and it will not tell you anything about your own security posture. It is a market and portfolio analytics report about companies that sell security software. There is no cap table, no waterfall exit model and no IRR calculation. If you need SOC metrics, look at the Cyber Risk Management Dashboard in Excel instead.
How to Use the Cybersecurity Startups Dashboard in Power BI
- Unzip and open. Extract the ZIP and open the .pbix in Power BI Desktop – the free download from Microsoft. The report opens on the Overview page, already populated.
- Walk the five pages. Use the top navigation strip to move between Overview, Funding Trends, Segments & Stages, Growth & Customers and Burn & Runway. Your Date Range, Security Segment, Region and Startup Name selections follow you.
- Drill into a name. Right-click a bar or a table row and choose Drillthrough to reach the hidden Details page, filtered by Startup Name, Security Segment, Funding Stage, Region, Investor Type or Deal Status.
- Swap in your data. Open the included Data.xlsx, keep the 16 column headers exactly as they are, paste your own deal rows underneath, then in Power BI go to Transform data and point the source at your file. Close & Apply, then Refresh.
- Rebrand it. Replace the logo, edit the theme colours and rename any measure. Nothing is locked and no visual depends on an external image.
- Publish or export. Push it to a Power BI Service workspace to share by link, or export the pages to PDF or PowerPoint for an investment committee pack.
Real-World Use Cases
Priya, associate at a seed-stage security fund. Every Monday she filters Security Segment to Cloud Security and Identity & Access, sets the date range to the trailing quarter, and reads Avg Deal Size and Deal Close Rate off page 2 before her pipeline call. The Q1-to-Q4 close-rate curve is the slide that goes into the partner deck.
Marcus, corp dev at an established security vendor. He uses page 3 to shortlist targets: sort the Security Segment Scorecard by ARR, then drill through on a startup name to read its raw rows on the Details page. Valuation Multiple on the card strip tells him instantly when a segment is running hot.
Dana, founder of an OT & IoT security startup preparing a Series B. She swaps in her own monthly figures and screenshots page 5 – Monthly Burn, Runway, Burn Multiple, Capital Efficiency and ARR per Employee – straight into the investor update, with the funding-stage burn comparison as context.
Frequently Asked Questions
Does this dashboard monitor threats, vulnerabilities or security incidents?
No. This is a market and portfolio analytics report about cybersecurity companies – their funding, valuation, ARR, customers, headcount and burn. It contains no threat feed, no CVE list, no patch or incident tracking and no compliance control register.
Is real market data included?
No. The 500 rows are realistic sample records built to demonstrate every visual. They are not sourced from Crunchbase, PitchBook or CB Insights, and there is no live connection to any market-data provider. Replace them with your own pipeline or portfolio.
Do I need a Power BI Pro licence?
Not to use it. Power BI Desktop is free, and the report is fully interactive there. A Pro or Premium licence is only needed if you want to publish it to the Power BI Service and share it with colleagues by link.
How do I connect my own file?
Keep the 16 column headers from the included Data.xlsx, paste your rows underneath, then change the single file path in Power Query and refresh. Every measure, card and chart recalculates – you do not rebuild anything.
Can I edit the visuals, colours and measures?
Yes. Nothing is locked. The theme, the KPI card layout, the DAX and the page structure are all editable, and the commercial licence lets you rebrand the report and use it in client work.
Is there an Excel version?
Yes – the Cybersecurity Startups Dashboard in Excel covers the same subject with pivot tables and slicers instead of a semantic model. The two are built independently, so their page structures and KPI lists differ; pick the one that matches the tool your audience already has.
What exactly is in the download?
One ZIP containing the .pbix report, the Data.xlsx sample workbook and the Power BI Dashboard – User Manual PDF. It is an instant download after checkout.
About the Author
Built by PK – Microsoft Certified Professional with 15+ years of Excel, Google Sheets, and Power BI experience. Founder of NextGenTemplates, reaching 300K+ subscribers across YouTube channels. Every template is hand-built and tested before release.
Explore Related Templates
- Cybersecurity Startups Dashboard in Excel – the same topic for teams that live in Excel.
- Climate Tech Startups Dashboard in Power BI – the same startup-analytics shape for a different sector.
- Crowdsourced Investment Platforms Dashboard in Power BI – deal flow and investor behaviour on the platform side.
- Risk Assessment Firms Dashboard in Power BI – services-side view of the risk and assurance market.
- IT Manager & CISO Toolkit – 10 Excel, Google Sheets and Power BI templates in one bundle.
- Browse the full Power BI catalogue or every Power BI Dashboard.
Get the Cybersecurity Startups Dashboard in Power BI for $17.99 (regular $29.99) – instant ZIP download, lifetime access, commercial licence, no subscription. Read the full walkthrough on the Cybersecurity Startups Dashboard in Power BI blog post.
Last updated: 30 August 2026.
Watch the demo video:
Compatibility and Requirements
- Works in Power BI Desktop, which is free. Get it from Microsoft’s Power BI Desktop download page.
- The report reads its data from the included Data.xlsx file, so you need Excel or any tool that can edit an .xlsx file to replace the 500 sample rows.
- Publishing to the Power BI Service to share by link needs a Pro or Premium licence. Using the report in Desktop does not.













Reviews
There are no reviews yet.