

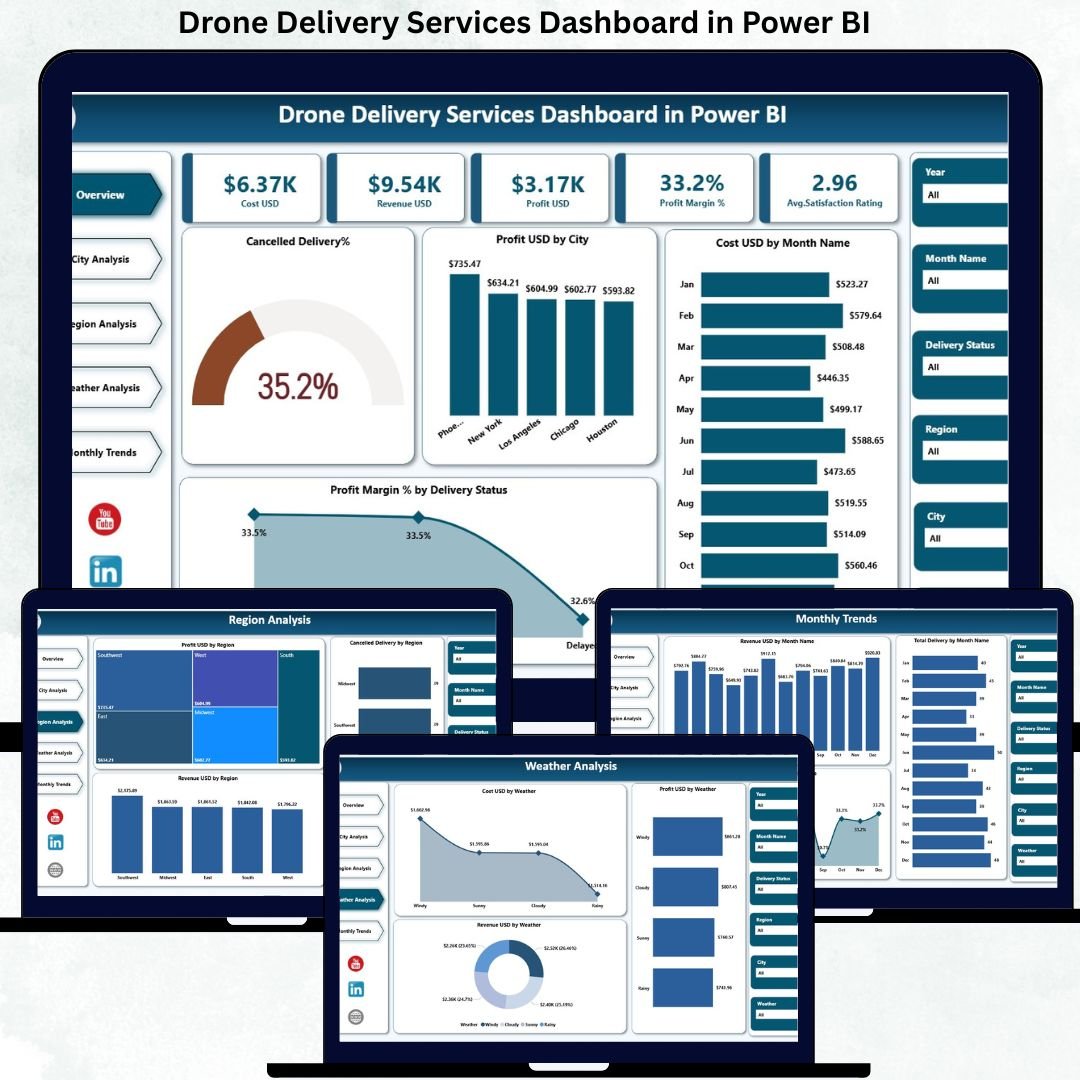

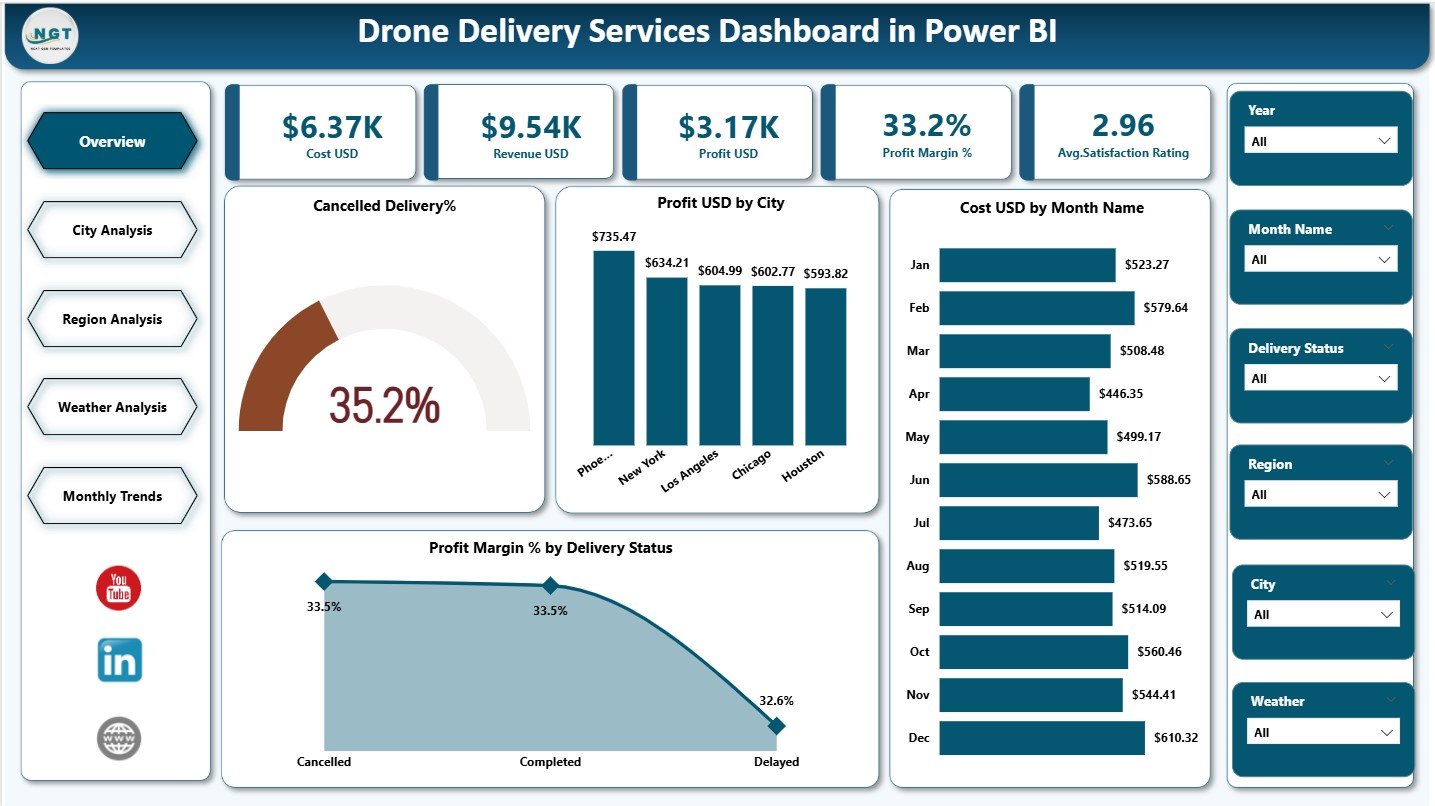
In today’s rapidly evolving logistics ecosystem, drone delivery services are transforming how organizations handle last-mile delivery. However, managing drone operations without structured analytics often leads to hidden costs, delayed decisions, and missed optimization opportunities. That is exactly why the Drone Delivery Services Dashboard in Power BI becomes an essential, business-ready solution.
This professionally designed dashboard converts complex drone delivery data into clear KPIs, interactive visuals, and actionable insights. Instead of juggling spreadsheets and disconnected reports, you gain one centralized Power BI dashboard to monitor costs, revenue, profitability, delivery performance, weather impact, and customer satisfaction—all in real time.
Built with operational clarity and scalability in mind, this dashboard empowers logistics teams, analysts, and decision-makers to move from reactive management to proactive, data-driven control.
✨ Key Features of Drone Delivery Services Dashboard in Power BI
📊 Executive-Level KPI Cards
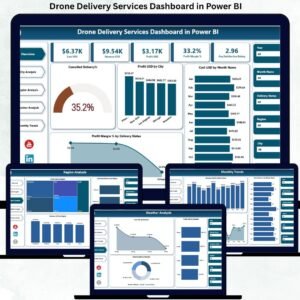
Track Cost USD, Revenue USD, Profit USD, Profit Margin %, and Average Satisfaction Rating instantly.
🌍 City-Wise Performance Analysis
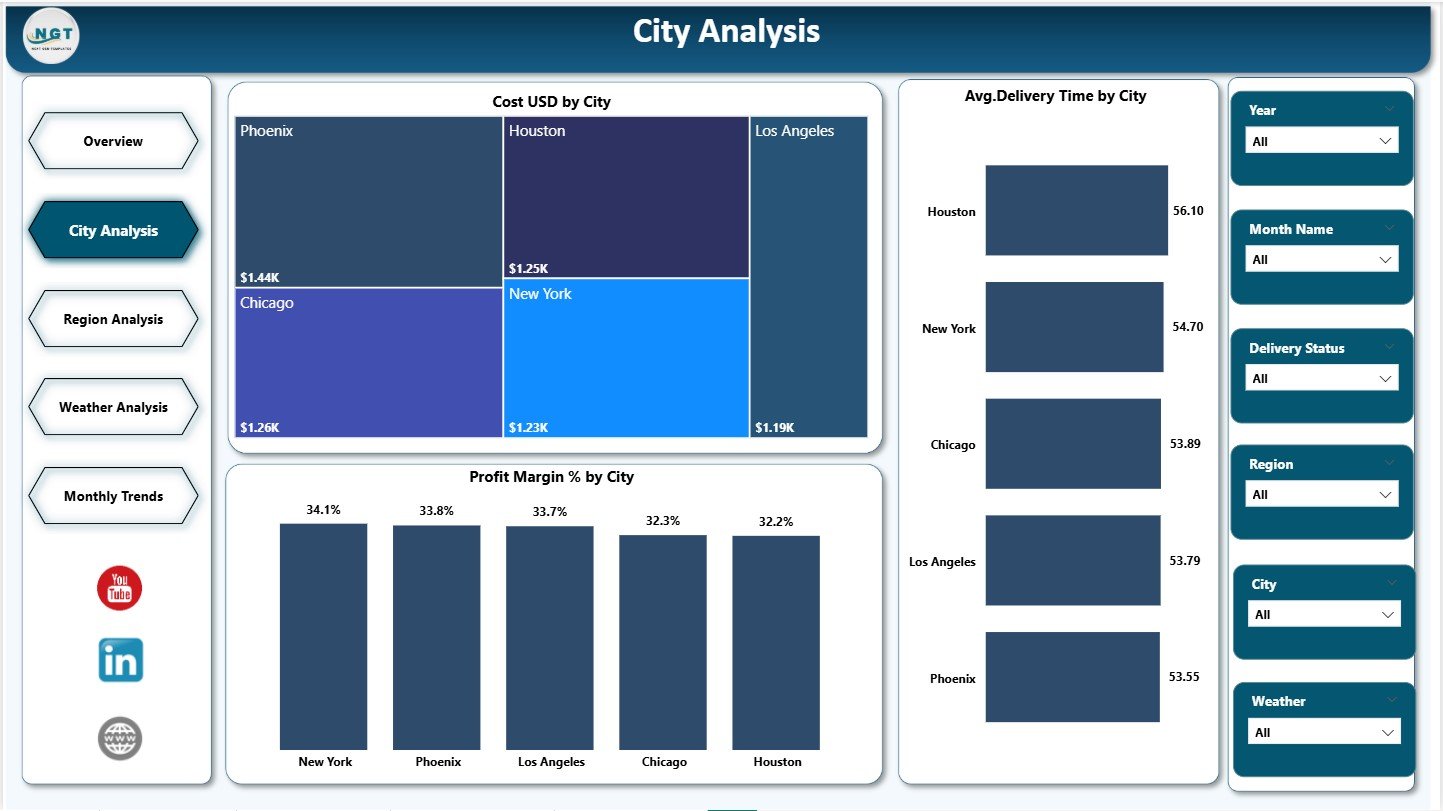
Identify high-cost cities, delivery delays, and profitability variations with focused city insights.
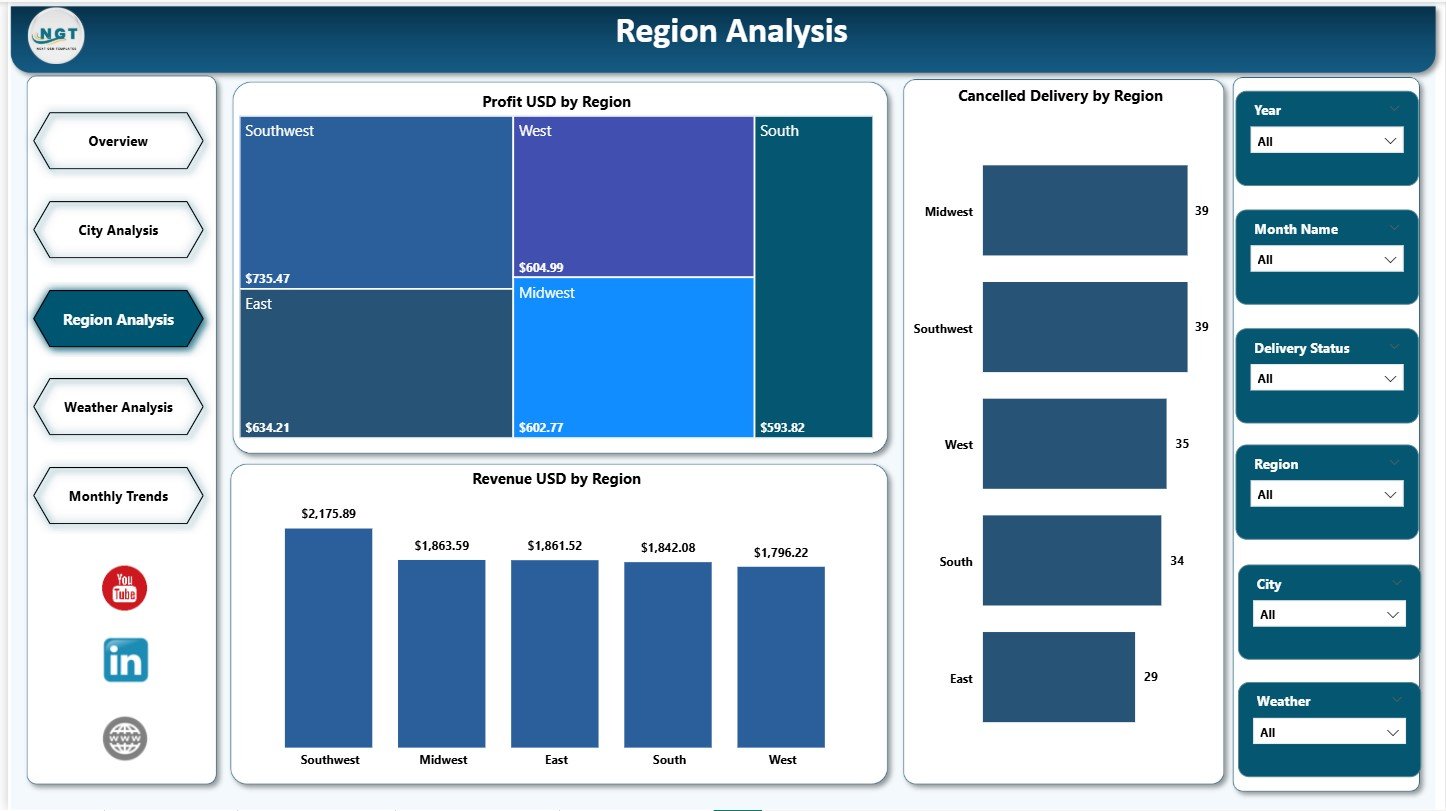
🗺️ Region-Level Strategic View
Understand regional profitability, cancellation risks, and revenue distribution for better planning.
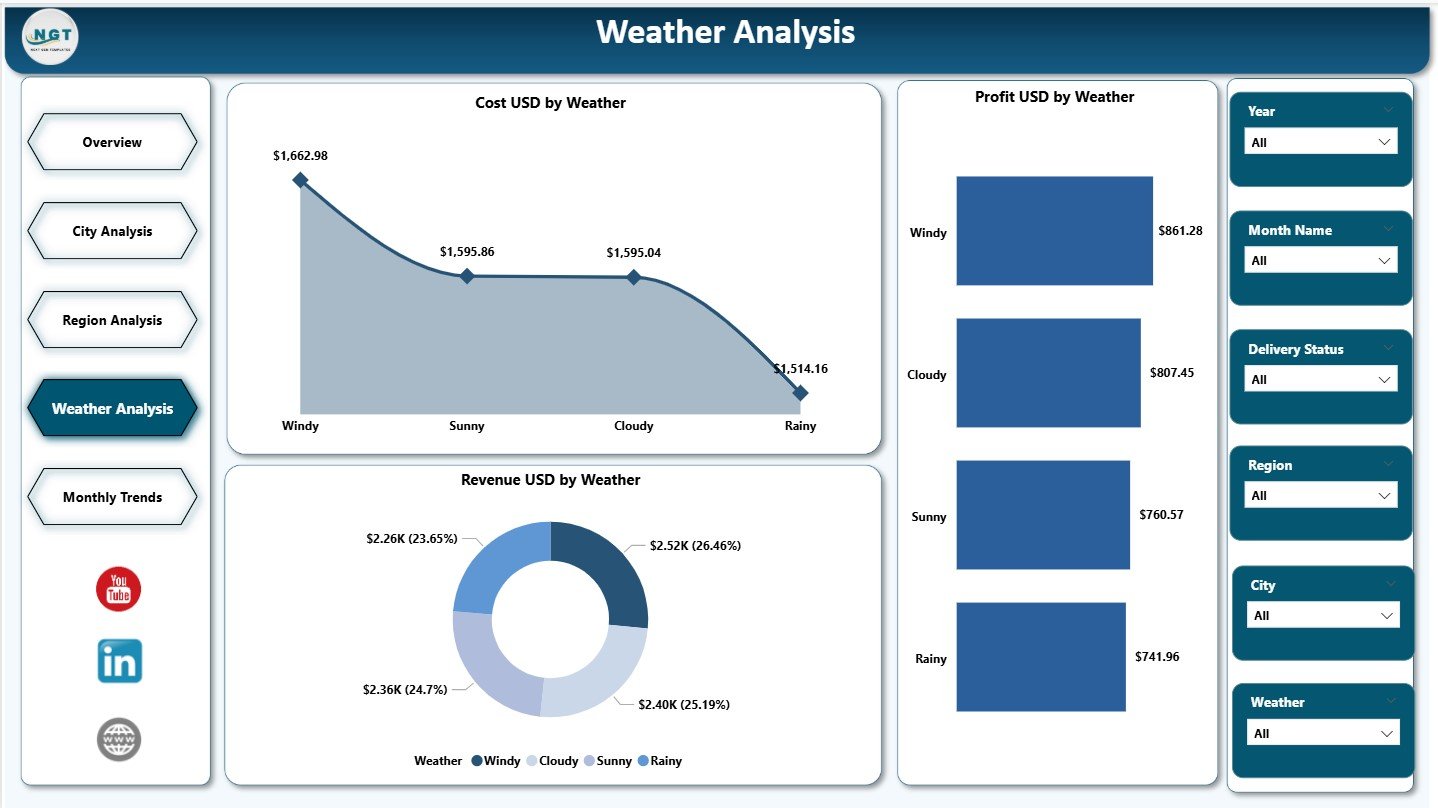
🌦️ Weather Impact Analysis
Analyze how weather conditions affect costs, revenue, and profitability of drone operations.
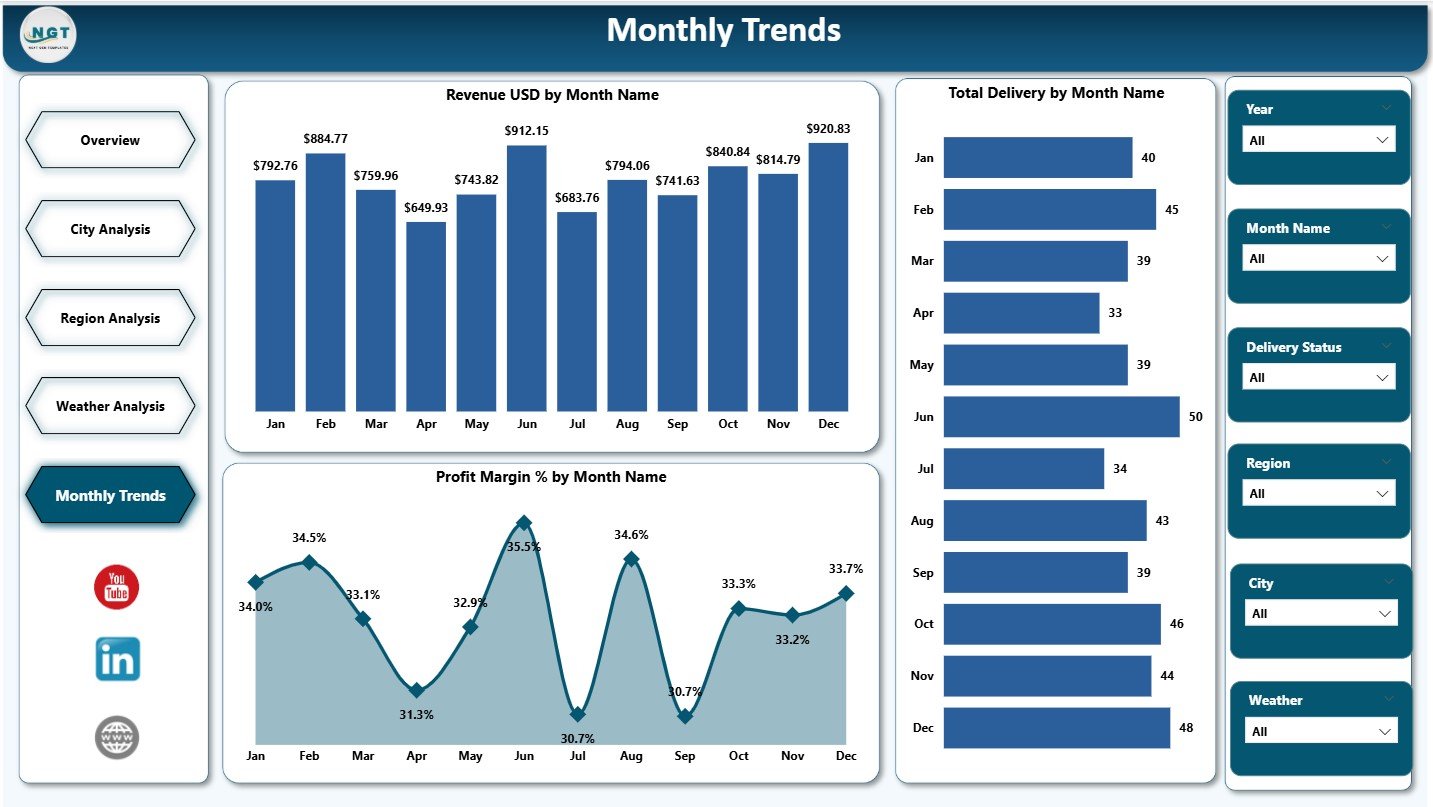
📈 Monthly Trend Monitoring
Track revenue growth, delivery volumes, and profit margins over time for forecasting.
🎛️ Interactive Slicers & Filters
Slice data by city, region, month, delivery status, and weather conditions instantly.
⚡ Business-Ready Visual Design
Clean layouts, consistent colors, and intuitive charts for faster understanding.
📦 What’s Inside the Drone Delivery Services Dashboard in Power BI
This Power BI dashboard includes five professionally structured analytical pages:
📌 Overview Page – High-level snapshot with KPI cards and summary charts
📌 City Analysis Page – Cost, delivery time, and profit margin insights by city
📌 Region Analysis Page – Profit, revenue, and cancellation trends by region
📌 Weather Analysis Page – Cost, revenue, and profit impact by weather condition
📌 Monthly Trends Page – Revenue, delivery volume, and profit margin trends by month
Each page is designed to answer specific business questions without technical complexity.
🛠️ How to Use the Drone Delivery Services Dashboard in Power BI
Using this dashboard is simple and intuitive:
1️⃣ Connect the dashboard to your Excel or structured data source
2️⃣ Refresh the data inside Power BI
3️⃣ Use slicers to filter by city, region, month, weather, or delivery status
4️⃣ Analyze KPIs, trends, and performance gaps
5️⃣ Make faster operational and strategic decisions
No advanced Power BI expertise is required—everything is designed for business users.
👥 Who Can Benefit from This Drone Delivery Services Dashboard in Power BI
This dashboard is ideal for:
🚚 Logistics & Supply Chain Managers
🛩️ Drone Operations Teams
🛒 E-commerce & Retail Companies
🏥 Healthcare & Emergency Delivery Providers
🏙️ Smart City & Urban Mobility Projects
📊 Business Analysts & Leadership Teams
Whether you manage a small drone fleet or a large-scale delivery network, this dashboard adapts to your needs.
🔗 Click here to read the Detailed Blog Post
👉 Visit our YouTube channel to learn step-by-step video tutorials
Youtube.com/@PKAnExcelExpert
Watch the step-by-step video tutorial:
Compatibility and Requirements
- Works in Power BI Desktop, which is free to download from Microsoft. Microsoft explains the download in Get Power BI Desktop.
- The dashboard connects to your Excel or other structured data source, and you refresh the data inside Power BI.
- Slicers filter the report by city, region, month, delivery status and weather condition.
Frequently Asked Questions
Which pages are included?
Five pages: Overview, City Analysis, Region Analysis, Weather Analysis and Monthly Trends.
Which KPIs does the dashboard show?
The KPI cards show Cost USD, Revenue USD, Profit USD, Profit Margin % and Average Satisfaction Rating.
Can I see how weather affects drone delivery results?
Yes. The Weather Analysis page shows cost, revenue and profit by weather condition.
How do I load my own data?
Connect the dashboard to your Excel or structured data source, then refresh the data inside Power BI. Use the slicers to filter by city, region, month, weather or delivery status.
Is there an Excel version?
Yes. See the Drone Delivery Services Dashboard in Excel.
Related Delivery and Logistics Templates
- Drone Delivery Services Dashboard in Excel: the same topic in Excel
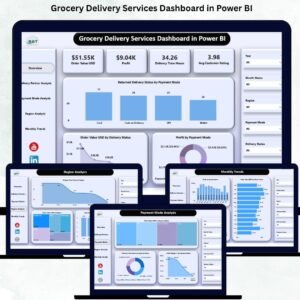
- Grocery Delivery Services Dashboard in Power BI: a delivery dashboard in Power BI for grocery orders
- Transportation Services KPI Dashboard in Excel: transport service KPIs in Excel
- Logistics and Transportation Hub: 7 logistics templates in one download (Excel + Power BI)
Browse all Power BI dashboards.
































Reviews
There are no reviews yet.