

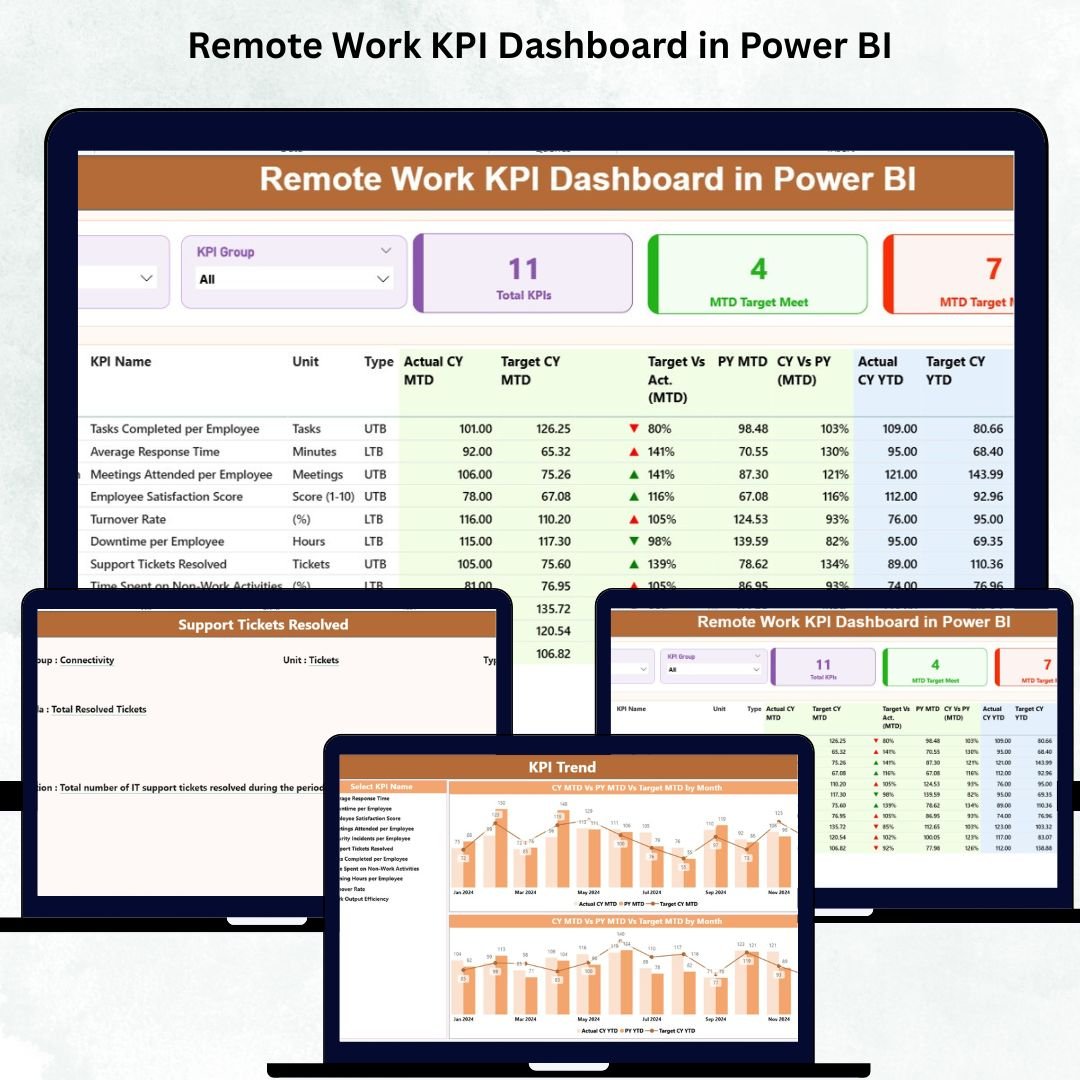
Remote Work KPI Dashboard is no longer a temporary trend—it has become a permanent work model for companies across the world. Teams now operate from different cities, countries, and time zones. While this brings flexibility and global talent access, it also creates challenges for managers who must monitor productivity, performance, deadlines, output quality, and collaboration without physical visibility.
The Remote Work KPI Dashboard in Power BI solves this problem by transforming scattered remote work data into simple, visual insights. Whether you want to track productivity, measure collaboration, analyze time management, or compare current performance with last year’s numbers, this dashboard offers everything in one powerful view. It eliminates manual reporting, reduces confusion, and helps businesses make decisions with complete clarity.
Built with dynamic slicers, automated visuals, KPI indicators, and drill-through pages, this dashboard becomes an essential tool for HR professionals, project managers, department heads, and leadership teams who manage remote employees.
✨ Key Features of the Remote Work KPI Dashboard in Power BI
This dashboard includes three data-rich pages designed to give deep visibility into remote work performance.
📦 What’s Inside the Remote Work KPI Dashboard
1️⃣ Summary Page – The Complete Performance Snapshot
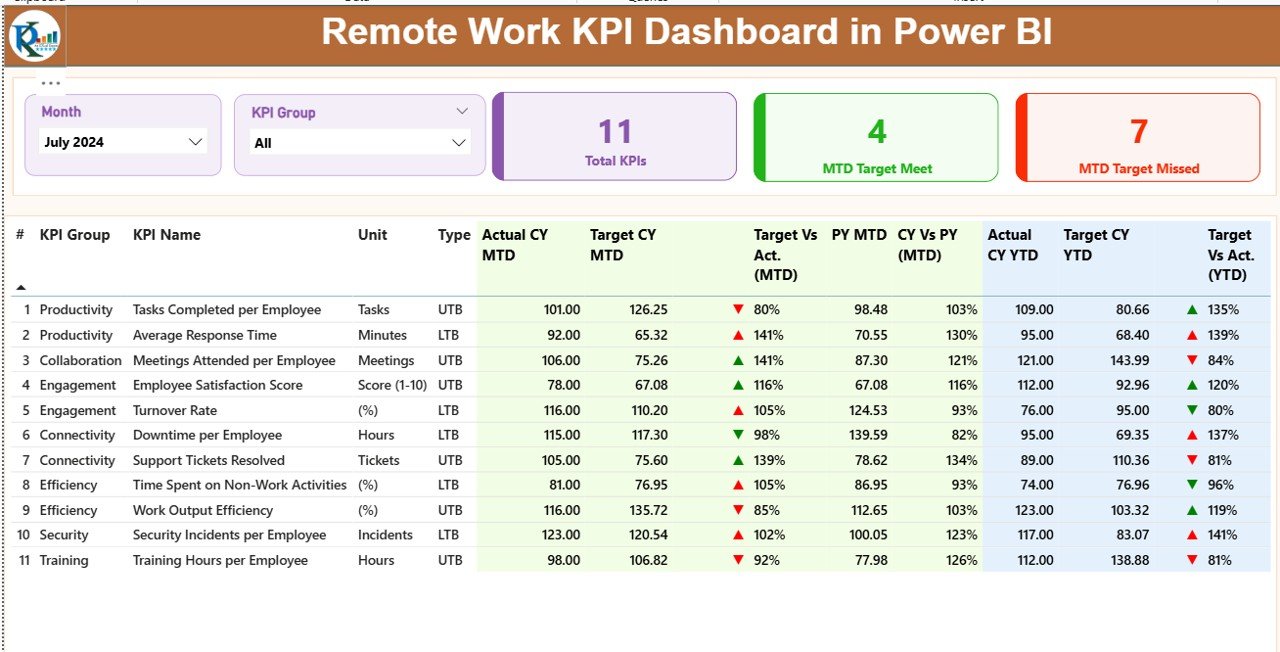
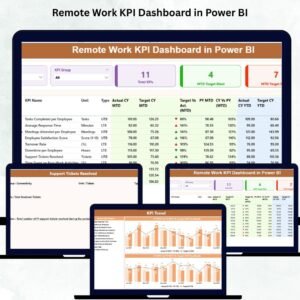
The Summary Page is the most important part of the dashboard. It helps managers understand all KPIs instantly without navigating multiple reports.
Key elements include:
🌐 Month Slicer
Filter all visuals by selecting any month. The dashboard updates instantly.
📂 KPI Group Slicer
Choose from groups such as:
Productivity
Quality
Attendance
Collaboration
Customer Support
Compliance
Time Management
📌 Performance Cards
Three cards on the top show powerful insights:
Total KPI Count
MTD Target Met
MTD Target Missed
📋 KPI Table with Conditional Formatting
The detailed KPI table includes:
KPI Name, KPI Number
KPI Group
Unit
Type (UTB or LTB)
Actual vs Target (MTD and YTD)
Trend percentage (CY vs PY)
MTD/YTD indicator icons (▲ green, ▼ red)
Previous Year comparisons
This table gives a complete performance summary so managers understand exactly where teams are doing well and where improvements are required.
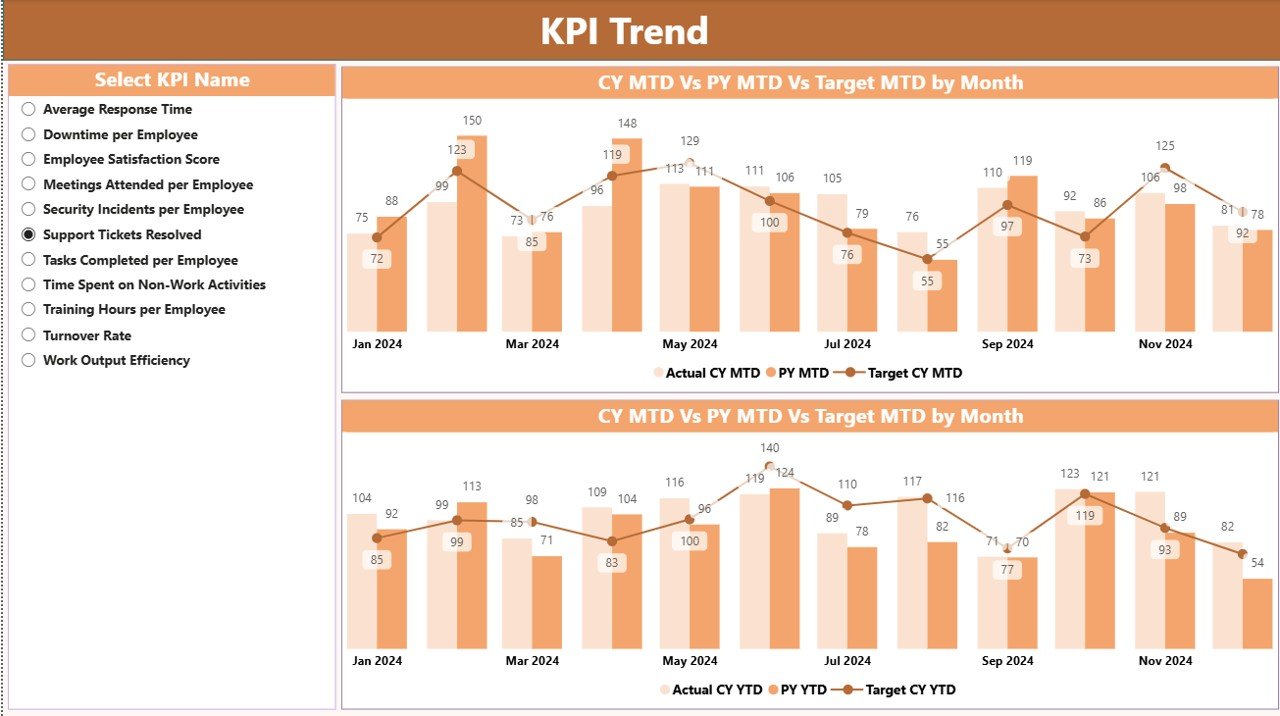
2️⃣ KPI Trend Page – Track Monthly Performance Patterns
The KPI Trend Page helps companies identify performance movement across time.
🔍 Select Any KPI
A slicer lets you choose any KPI name. Once selected, all trend visuals update automatically.
📈 Two Combo Charts
These charts display:
Current Year Actual
Previous Year Actual
Current Year Target
You get both MTD Trend and YTD Trend, helping you analyze if performance is rising, dropping, or staying stable.
This page is extremely useful for performance reviews, remote employee evaluations, and weekly or monthly management meetings.
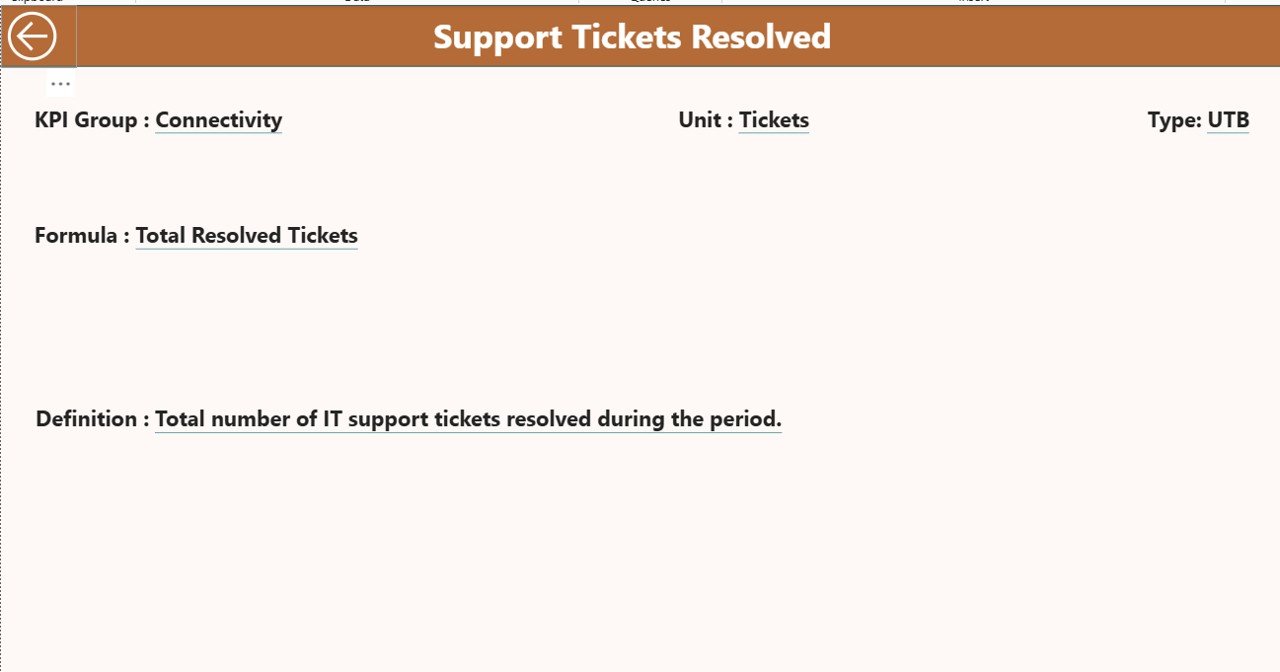
3️⃣ KPI Definition Page – Understand KPI Formulas Clearly
This page is a hidden drill-through view that appears when you right-click any KPI from the Summary Page.
It shows:
KPI Number
KPI Name
KPI Group
Formula
Unit
KPI Definition
KPI Type (LTB or UTB)
A Back Button ensures quick navigation to the Summary Page.
🧩 How to Use the Remote Work KPI Dashboard
Using the dashboard is simple:
Update the Excel input sheets
Refresh Power BI
Select month & KPI group
Analyze MTD and YTD performance
Drill through to view definitions
Study trends using combo charts
No technical skills required.
👥 Who Can Benefit from This Dashboard?
HR & Workforce Management Teams
Remote Team Leaders
Operations & Project Managers
Customer Support Managers
Finance & Compliance Heads
Senior Executives managing distributed teams
This dashboard is ideal for small teams, startups, large enterprises, hybrid teams, and fully remote organizations.
💡 Why This Dashboard Is Important for Remote Work
Real-time visibility across remote employees
Clear tracking of productivity and engagement
MTD/YTD comparison for accurate performance reviews
Fewer manual reports and faster decision-making
Better collaboration and time-management insights
Transparent and objective KPI measurement
It helps organizations boost performance, reduce confusion, and align remote teams with business goals.
### Click hare to read the Detailed blog post
Visit our YouTube channel to learn step-by-step video tutorials
👉 Youtube.com/@PKAnExcelExpert



























Reviews
There are no reviews yet.