

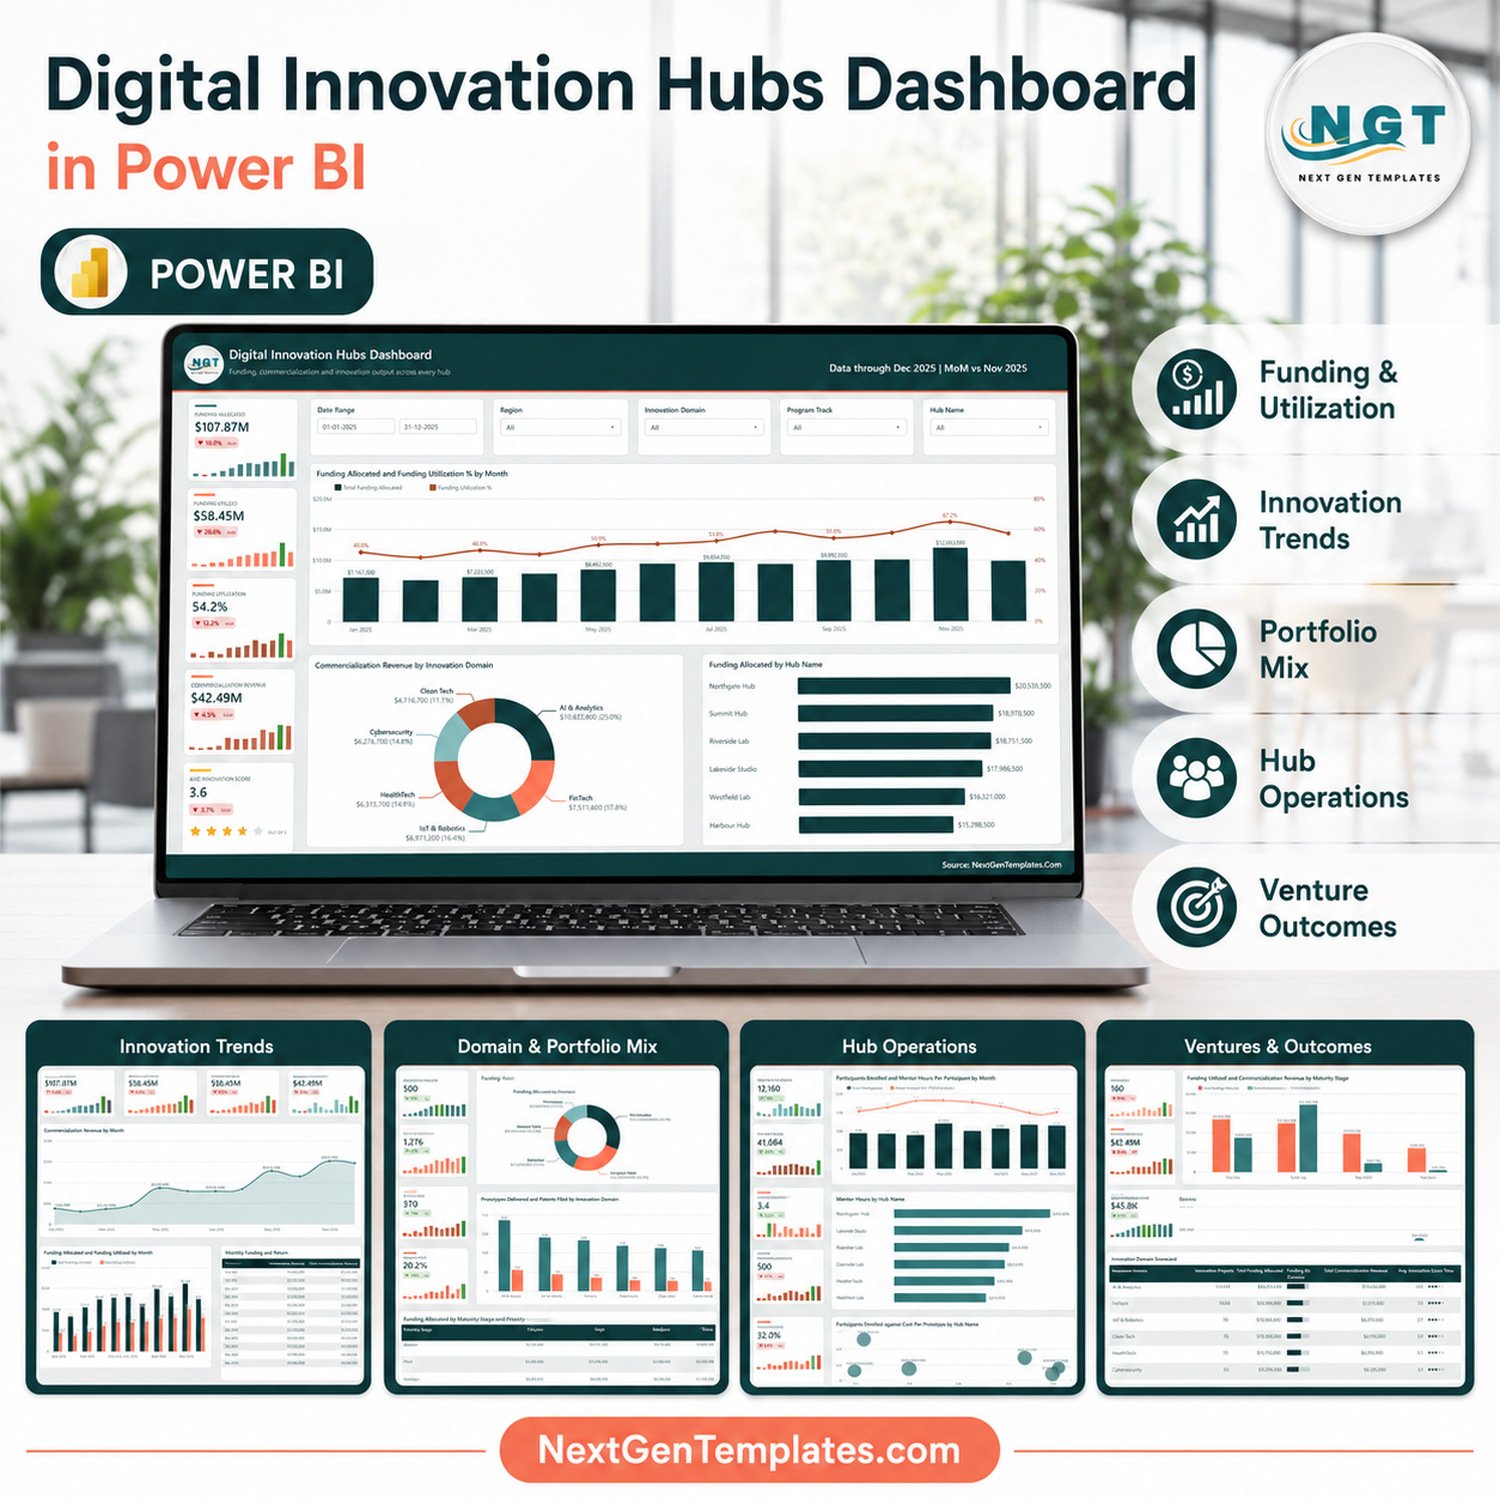

The Digital Innovation Hubs Dashboard in Power BI turns a 500-project innovation portfolio into five report pages you can read in about a minute. The sample model carries $107.87M allocated against $58.45M utilized (a 54.2% utilization rate), $42.49M in commercialization revenue, 1,276 prototypes, 370 patents filed and 12,160 participants across 6 hubs, 6 innovation domains and 5 program tracks. Every figure on every page is calculated from the included Data.xlsx, so nothing is hard-typed. Open the .pbix in the free Power BI Desktop, point it at your own project register, and the same five pages redraw against your numbers. Built by NextGenTemplates and shipped with a user manual – if it does not fit your reporting, tell us within 30 days.
Key Features of the Digital Innovation Hubs Dashboard in Power BI
- Five linked report pages – Digital Innovation Hubs Dashboard, Innovation Trends, Domain & Portfolio Mix, Hub Operations, and Ventures & Outcomes.
- Five slicers on every page – a Date Range pair plus Region, Innovation Domain, Program Track, and a fifth page-specific slicer (Hub Name, Maturity Stage, Priority or Status).
- 25 KPI cards across the five pages, each with its own sparkline and a month-on-month arrow measured against the prior month.
- Funding waterfall in numbers – Funding Allocated, Funding Utilized, Funding Utilization %, Net Innovation Value and Commercialization ROI all derive from the same two columns, so they can never disagree.
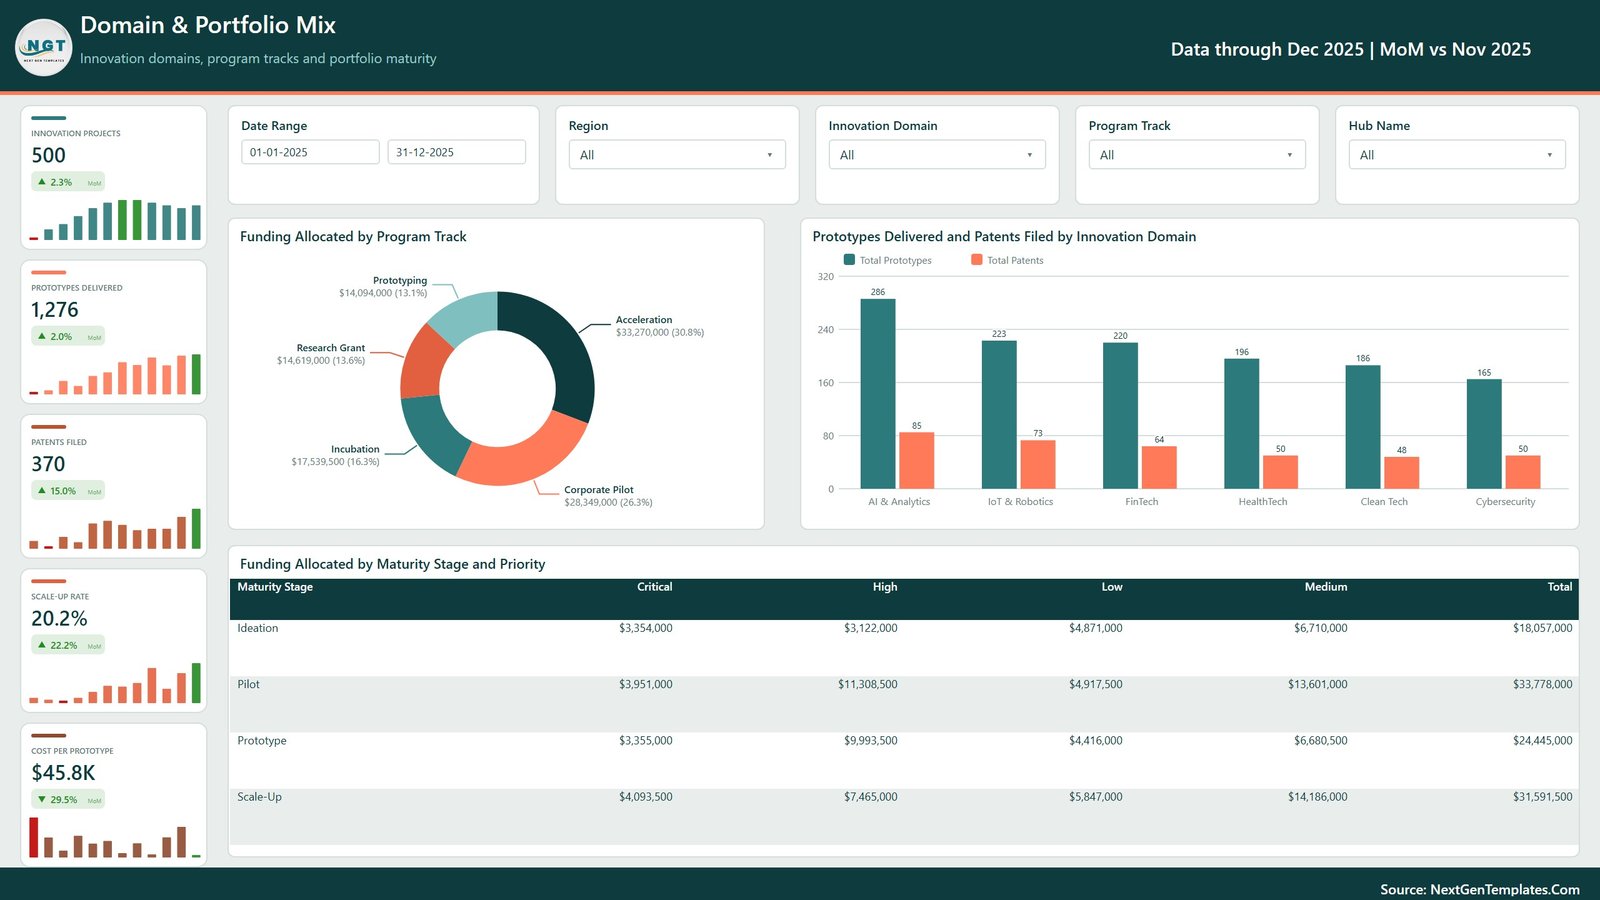
- Domain and track mix – donuts for Commercialization Revenue by Innovation Domain and Funding Allocated by Program Track, both labelled with value and share.
- A maturity matrix – Funding Allocated by Maturity Stage and Priority, Ideation through Scale-Up crossed with Critical / High / Medium / Low.
- Hub league tables – Funding Allocated by Hub Name and Mentor Hours by Hub Name, plus a Participants Enrolled against Cost Per Prototype scatter that exposes the expensive hubs.
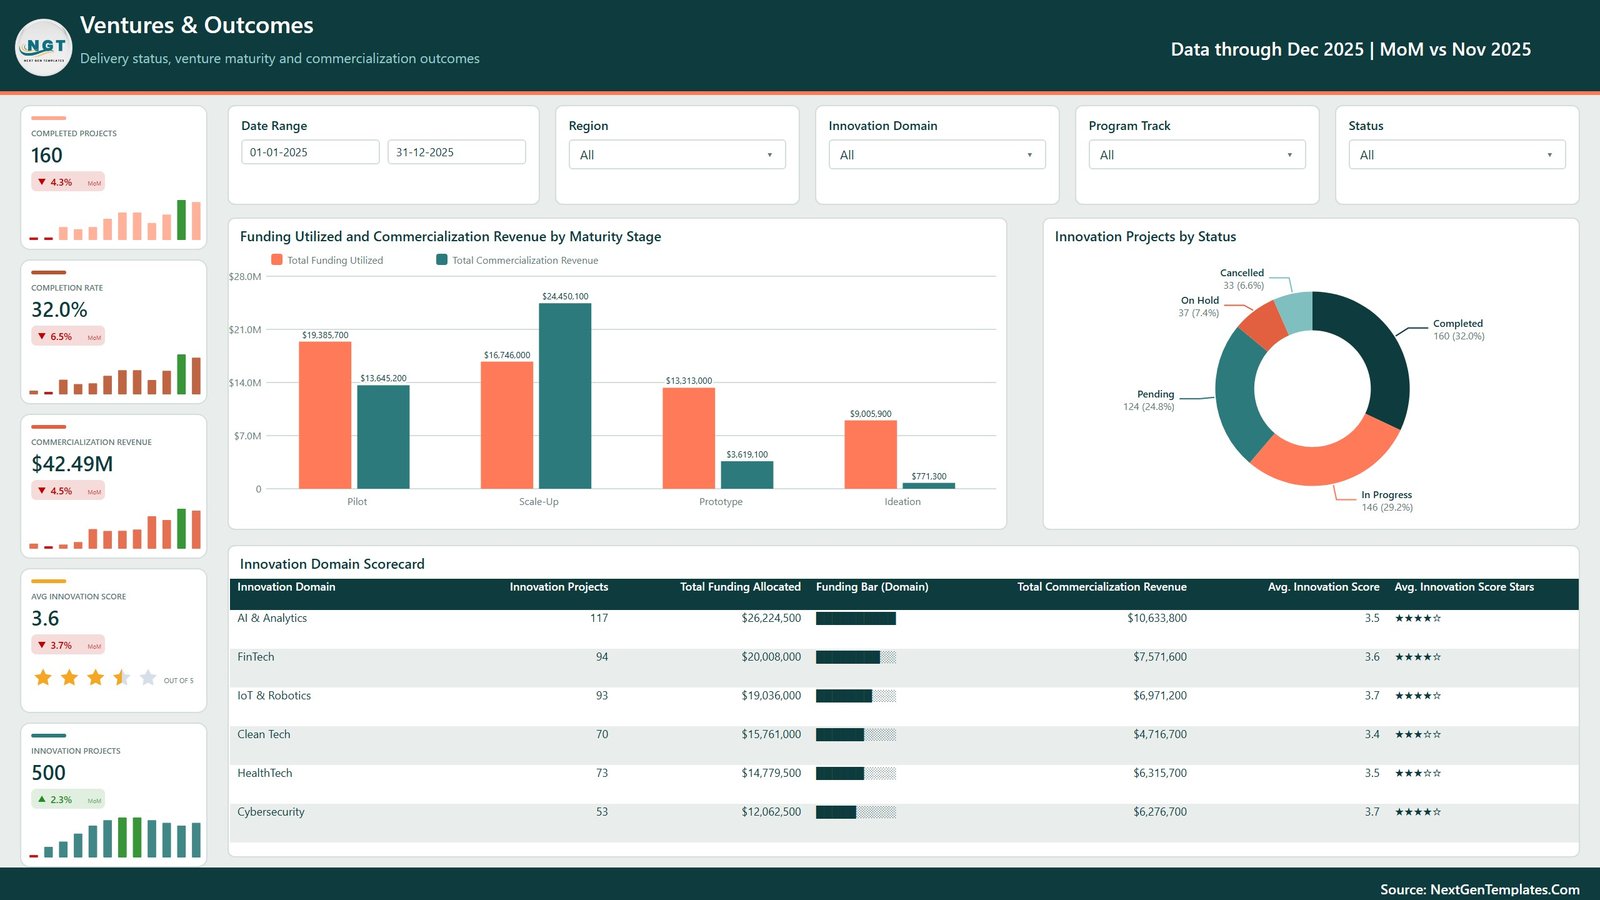
- An Innovation Domain Scorecard with projects, funding, a funding bar, commercialization revenue and a star-rated average innovation score per domain.
- 500 sample rows, 19 columns covering Jan-Dec 2025, including Venture Partner and Project Lead so partner and owner reporting works out of the box.
- Editable .pbix – no external service, no add-in, no subscription. Power BI Desktop is free from Microsoft.
What’s Inside the Digital Innovation Hubs Dashboard in Power BI
Page 1 – Digital Innovation Hubs Dashboard
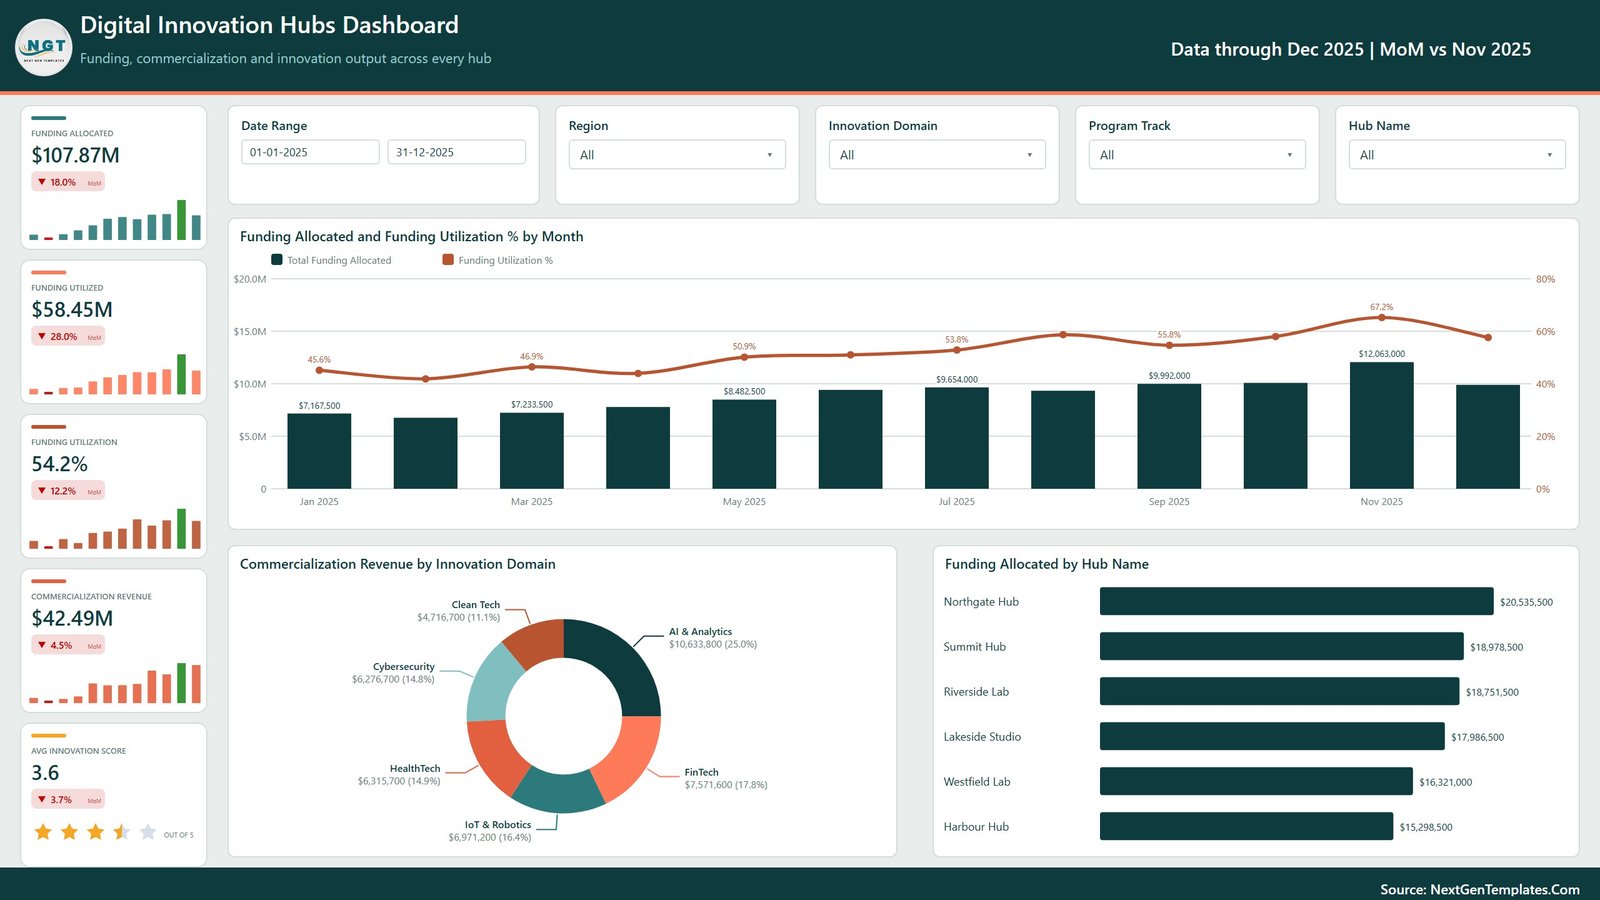
The portfolio summary: Funding Allocated $107.87M, Funding Utilized $58.45M, Funding Utilization 54.2%, Commercialization Revenue $42.49M and an Avg Innovation Score of 3.6 out of 5. A combo chart plots Funding Allocated and Funding Utilization % by Month; utilization runs from 45.6% in January to a 67.2% peak in November. Beside it, Commercialization Revenue by Innovation Domain shows AI & Analytics leading at $10,633,800 (25.0%) ahead of FinTech at $7,571,600 (17.8%), and Funding Allocated by Hub Name ranks Northgate Hub ($20,535,500) to Harbour Hub ($15,298,500).
Page 2 – Innovation Trends
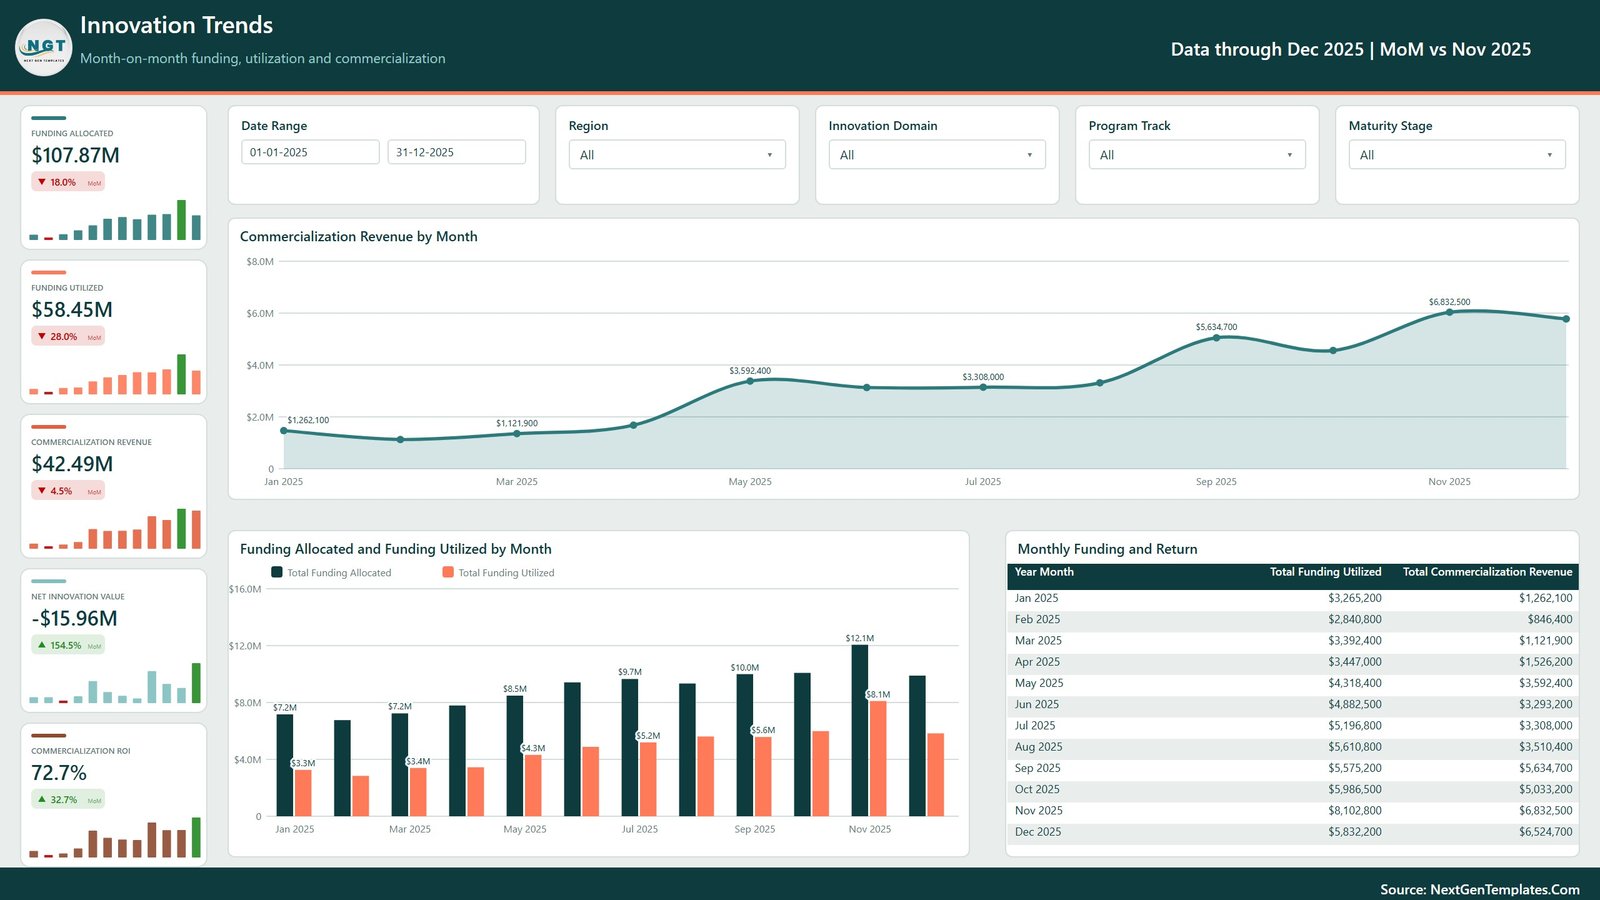
Month-on-month movement. Commercialization Revenue by Month climbs from $1,262,100 in January to $6,832,500 in November. A clustered column compares Funding Allocated with Funding Utilized month by month, and the Monthly Funding and Return table lists all twelve months side by side. Two cards do the honest arithmetic: Net Innovation Value at -$15.96M and Commercialization ROI at 72.7% – the portfolio has not yet returned what it spent, and the dashboard says so.
Page 3 – Domain & Portfolio Mix
Output rather than money: 500 Innovation Projects, 1,276 Prototypes Delivered, 370 Patents Filed, a 20.2% Scale-Up Rate and a $45.8K Cost Per Prototype. Funding Allocated by Program Track splits Acceleration $33,270,000 (30.8%), Corporate Pilot $28,349,000 (26.3%), Incubation $17,539,500 (16.3%), Research Grant $14,619,000 (13.6%) and Prototyping $14,094,000 (13.1%). A paired column chart sets Prototypes Delivered against Patents Filed per domain – AI & Analytics 286 and 85, Cybersecurity 165 and 50.
Page 4 – Hub Operations
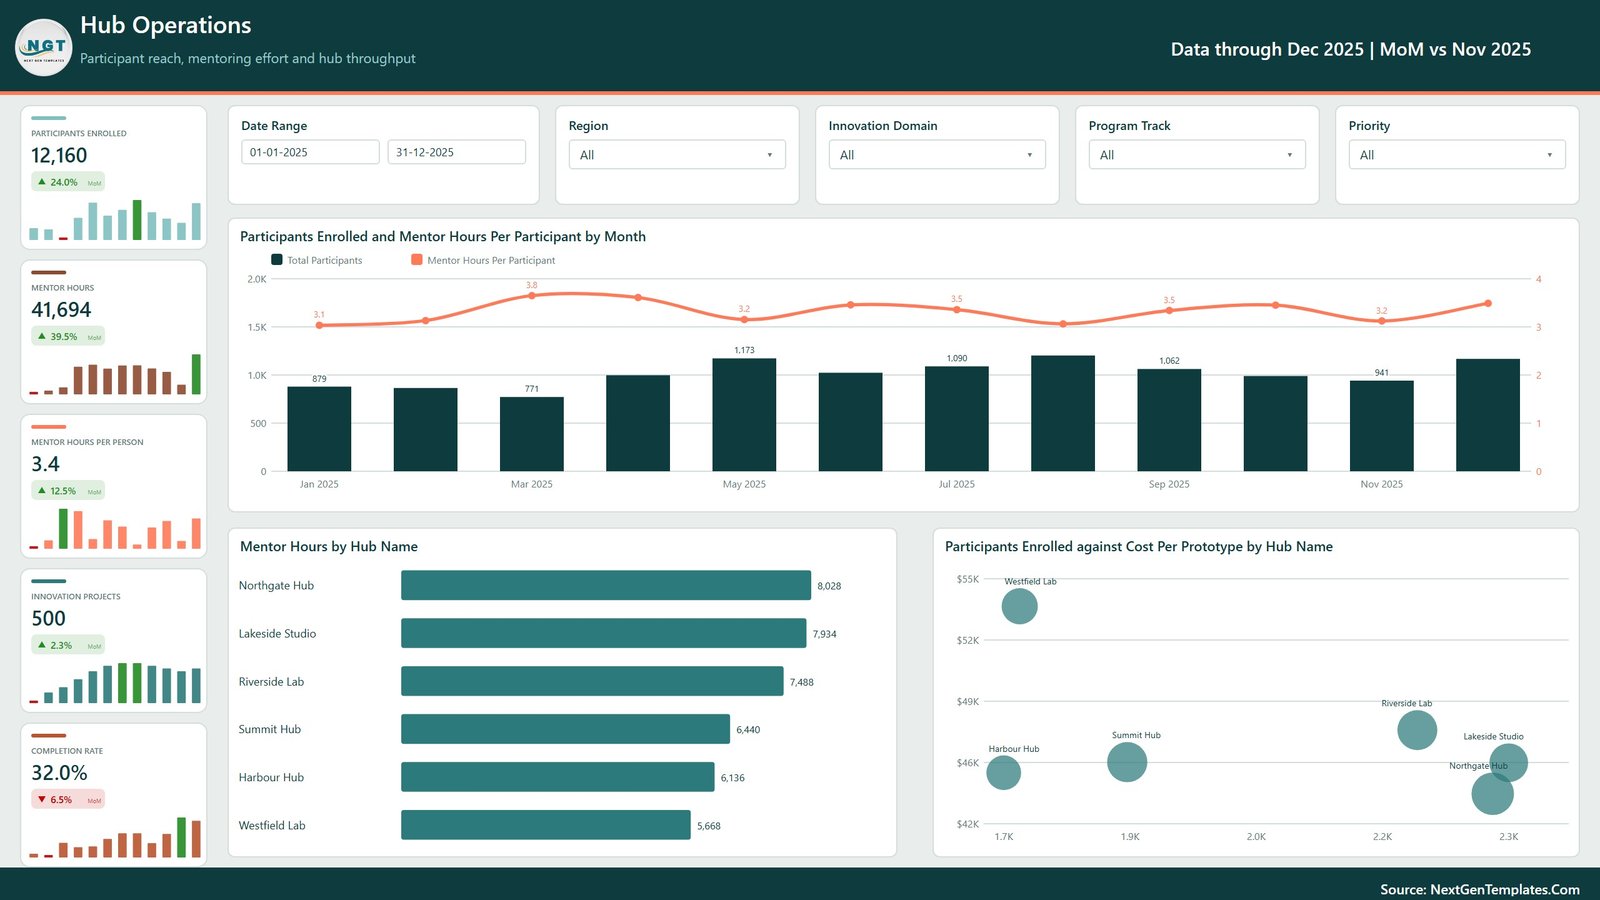
The people side: 12,160 Participants Enrolled, 41,694 Mentor Hours, 3.4 Mentor Hours Per Person and a 32.0% Completion Rate. Mentor Hours by Hub Name runs Northgate Hub 8,028 down to Westfield Lab 5,668, and the Participants Enrolled against Cost Per Prototype scatter puts Westfield Lab alone above $54K per prototype on the lowest enrolment – the single clearest efficiency question in the model.
Page 5 – Ventures & Outcomes
Delivery and return. Innovation Projects by Status splits 160 Completed (32.0%), 146 In Progress (29.2%), 124 Pending (24.8%), 37 On Hold (7.4%) and 33 Cancelled (6.6%). Funding Utilized and Commercialization Revenue by Maturity Stage shows Scale-Up as the only stage returning more than it consumes ($24,450,100 against $16,746,000), while Ideation returns $771,300 on $9,005,900. The Innovation Domain Scorecard closes the page with projects, funding, revenue and a star-rated score for all six domains.
Digital Innovation Hubs Dashboard in Power BI vs. Excel vs. Paid Innovation Management SaaS – Where This Fits
| This Power BI template | Excel edition | Paid innovation SaaS (Sopheon, Planview, Brightidea) | |
|---|---|---|---|
| Cost | $17.99 one time | $17.99 one time | $15,000-$60,000 per year |
| Platform | Power BI Desktop (free) | Microsoft Excel | Vendor cloud |
| Setup time | 15-30 minutes | 15-30 minutes | 6-16 weeks with consultants |
| Real-time team collaboration | Via Power BI Service if you publish | Via OneDrive or SharePoint | Yes, built in |
| Mobile access | Power BI mobile app | Excel mobile | Yes |
| Customizable fields | Full – it is your model | Full | Configurable within vendor limits |
| Share with link | Yes, once published | File share | Yes |
| Year-1 cost at 5 users | $17.99 | $17.99 | $20,000+ |
| Stage-gate workflow and approvals | No – reporting only | No | Yes |
| Idea intake portal | No | No | Yes |
The honest read: if you need stage-gate approvals and an idea intake portal, buy the SaaS. If you need to see where $107M of hub funding went and what came back, this is the same answer for a fraction of one seat.
Who This Template Is For – and Who It’s Not For
A good fit if you are an innovation hub or science-park manager reporting to a board, a corporate innovation lead consolidating several accelerator sites, a regional development agency tracking grant-funded programmes, or an analyst who already keeps a project register in Excel and wants it read properly.
Not for you if you need idea submission and voting from staff, formal stage-gate approvals with sign-off trails, individual grant claim or invoice processing, live integration with a CRM or finance system, or per-project Gantt scheduling. This is a reporting layer over a project register, not a workflow tool – and the sample dataset is synthetic, not a benchmark you should quote.
How to Use the Digital Innovation Hubs Dashboard in Power BI
- Unzip the download. You get the .pbix, the
Data.xlsxsource and a Power BI user manual PDF. - Open the .pbix in Power BI Desktop – free from Microsoft, Windows only.
- Replace the sample rows in
Data.xlsx, keeping all 19 column headers exactly as they are. Project ID, Date, Hub Name, Region, Innovation Domain, Program Track, Venture Partner, Project Lead, Maturity Stage, Priority, Funding Allocated, Funding Utilized, Commercialization Revenue, Participants Enrolled, Mentor Hours, Prototypes Delivered, Patents Filed, Innovation Score, Status. - Point the query at your file – Transform data, Data source settings, then browse to your copy of the workbook.
- Refresh and every card, chart and table on the five pages redraws.
- Rename the dimension values if your hubs, domains or tracks differ. The visuals read the column, not the label, so nothing breaks.
- Publish to the Power BI Service if you want the board to see it in a browser or on the mobile app.
Real-World Use Cases
Meera, hub director at a six-site science park. Her board asks one question every quarter: are we spending faster than we are commercializing? Page 2 answers it – $58.45M utilized against $42.49M returned, ROI 72.7%, net -$15.96M – and page 5 shows the gap sits entirely in Ideation and Prototype, which is a portfolio-mix argument rather than a failure.
Daniel, corporate innovation lead. He runs Acceleration and Corporate Pilot tracks side by side. Page 3 shows the two absorbing 57.1% of allocated funding between them, and the maturity matrix tells him how much of that is Critical priority – the number his CFO actually asks about.
Priya, programme analyst at a regional development agency. She slices to one Region and one Program Track and lifts Mentor Hours Per Person and Cost Per Prototype straight into the grant report, instead of rebuilding the same pivot every month.
Frequently Asked Questions
Do I need a paid Power BI licence?
No. Power BI Desktop is free from Microsoft and opens the .pbix, refreshes it and lets you edit every visual. A Pro or PPU licence is only needed if you want to publish and share through the Power BI Service.
Can I use my own data?
Yes – that is the point. Replace the 500 sample rows in Data.xlsx, keep the 19 headers, repoint the data source and refresh.
What exactly is in the download?
One ZIP containing the .pbix file, the Data.xlsx source workbook and a Power BI Dashboard user manual PDF.
Are the figures real?
No. The 500 projects, six hubs and 64 venture partners are realistic sample data built to exercise every visual. Treat them as a demo, never as an industry benchmark.
Is there an Excel version?
Yes – the Digital Innovation Hubs Dashboard in Excel covers the same portfolio in a workbook, if your team does not run Power BI Desktop.
Will it work on a Mac?
Power BI Desktop is Windows only, so you would need a Windows machine or VM. On Mac, use the Excel edition instead.
Can I add pages or measures?
Yes. The file is unlocked – add pages, rewrite DAX measures, restyle the theme, and reuse it across as many of your own projects as you like.
About the Author
Built by PK – Microsoft Certified Professional with 15+ years of Excel, Google Sheets, and Power BI experience. Founder of NextGenTemplates, reaching 300K+ subscribers across YouTube channels. Every template is hand-built and tested before release.
Explore Related Templates
- Digital Innovation Hubs Dashboard in Excel – the same portfolio model as a workbook.
- Knowledge Transfer Partnerships Dashboard in Power BI – for university-industry collaboration programmes.
- Product Development KPI Dashboard in Power BI – when the question moves from portfolio to product.
- Cybersecurity Startups Dashboard in Power BI and Climate Tech Startups Dashboard in Power BI – sector-specific venture views.
- Browse the full Power BI Dashboard category or every Power BI template.
Get the Digital Innovation Hubs Dashboard in Power BI for $17.99 (regular $29.99). Instant download, editable .pbix, sample data and user manual included. Add it to your cart and you can be looking at your own hub portfolio inside half an hour.
Watch the step-by-step video Demo:
Last updated: 6 September 2026.

































Reviews
There are no reviews yet.