

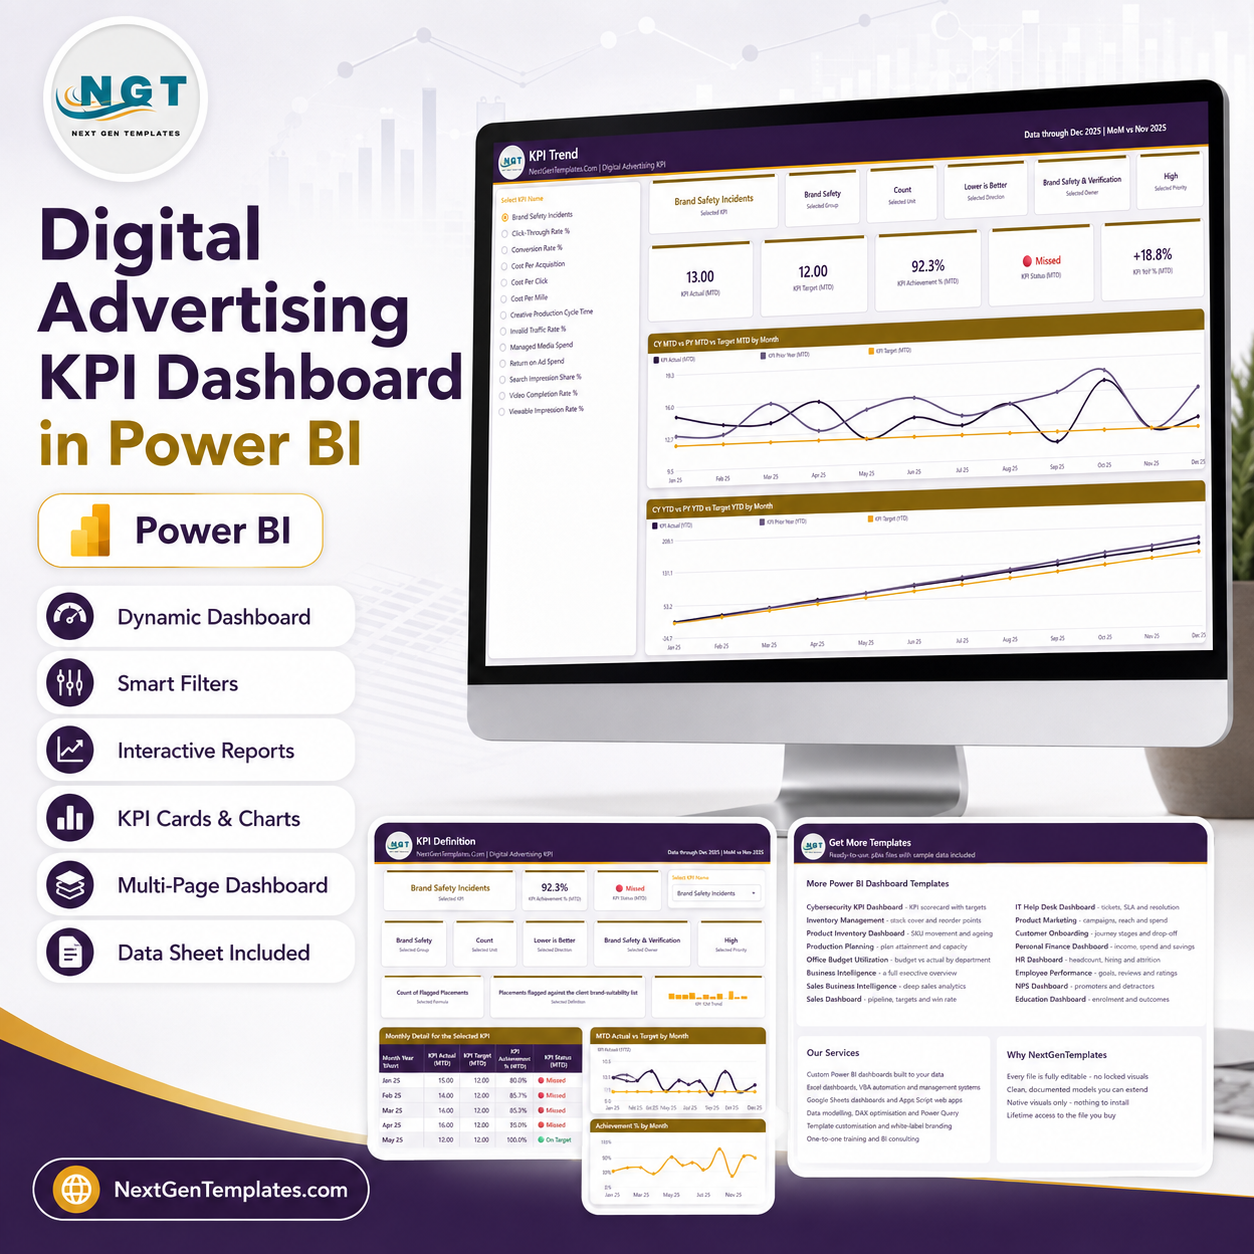
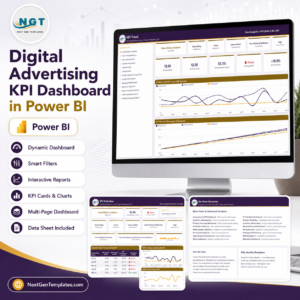
Track 13 digital advertising KPIs against monthly targets in one editable Power BI scorecard. The Digital Advertising KPI Dashboard in Power BI combines MTD and YTD achievement, status lights, prior-year movement, 12-month trends, ownership, priority, and lower-is-better or upper-is-better logic. It includes four visible report pages, two hidden tooltip pages, sample data through December 2025, and a separate Data.xlsx source. Buy once for $12.99 during the sale; there is no recurring dashboard subscription. Replace the sample data, refresh the model, and keep the report on your own computer or publish it through your own Power BI environment.
Key Features of Digital Advertising KPI Dashboard in Power BI
- 13 advertising KPIs: Brand Safety Incidents, Cost Per Mille, Invalid Traffic Rate, Video Completion Rate, Cost Per Click, Search Impression Share, Cost Per Acquisition, Viewable Impression Rate, Conversion Rate, Managed Media Spend, Return on Ad Spend, Creative Production Cycle Time, and Click-Through Rate.
- MTD and YTD scorecards: compare actuals with targets and prior-year performance.
- Traffic-light status: identify on-target, at-risk, and missed KPIs quickly.
- Direction-aware scoring: supports both lower-is-better and upper-is-better measures.
- Five business filters: Month, KPI Group, Owner, Priority, and Direction.
- Editable PBIX: adjust visuals, colors, measures, and labels in Power BI Desktop.
- Included source file: update actual, target, prior-year, and KPI-definition data in Data.xlsx.
What’s Inside the Digital Advertising KPI Dashboard in Power BI
KPI Scorecard Page
The KPI Scorecard gives leaders a full portfolio view. Five summary cards show the total KPI count, targets met, KPIs at risk, missed targets, and overall MTD achievement. The detailed table then lists every KPI with its group, unit, 12-month sparkline, MTD actual and target, achievement percentage, status light, year-over-year arrow, YTD actual, YTD achievement, and YTD status.
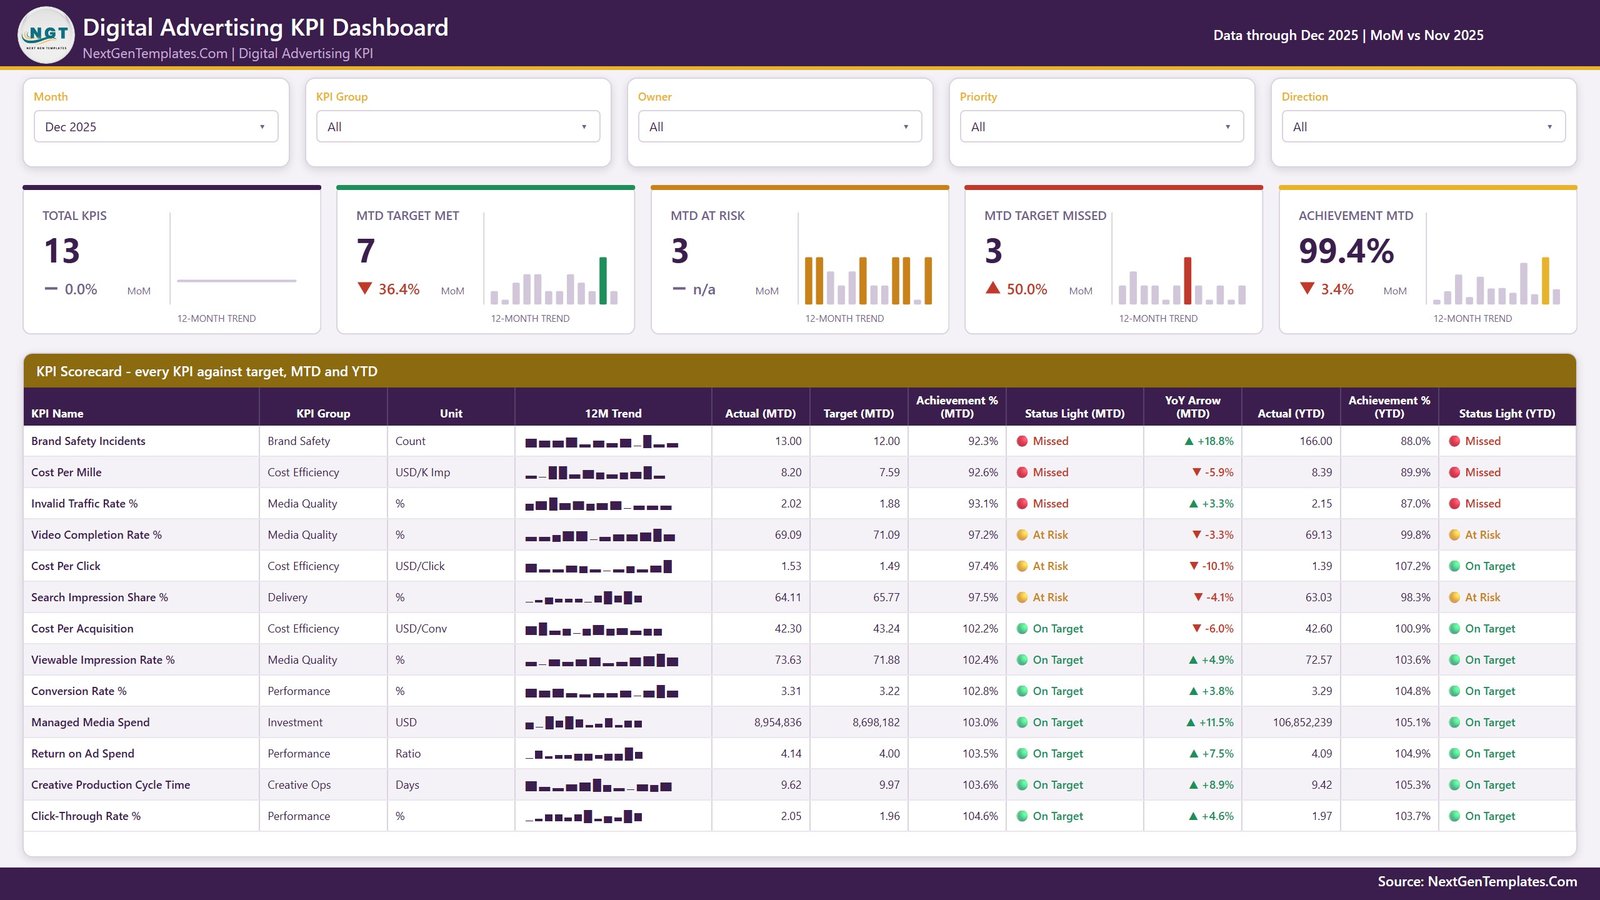
KPI Scorecard page
KPI Trend Page
Select one KPI to review its group, unit, direction, owner, priority, MTD actual, target, achievement, status, and year-over-year movement. Two monthly charts compare current-year actuals with prior year and target for both MTD and cumulative YTD views.
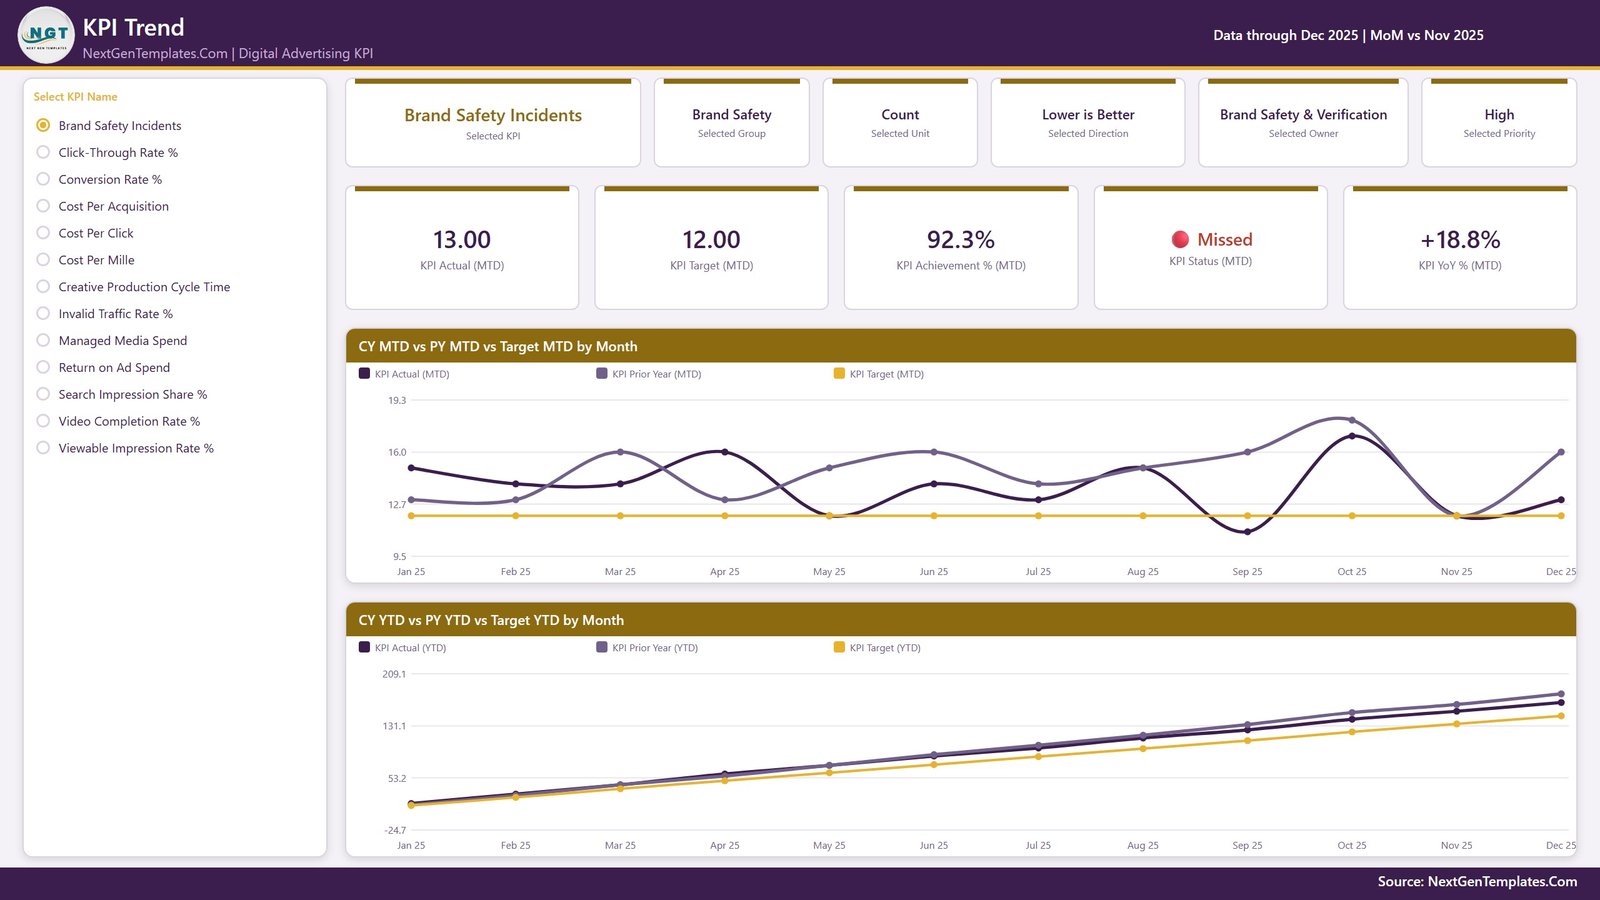
KPI Trend page
KPI Definition Page
The KPI Definition page puts the calculation context beside the performance result. It displays the selected KPI’s formula, definition, owner, group, unit, direction, priority, monthly detail table, actual-versus-target trend, and achievement percentage by month. This is a normal report page controlled by a KPI selector, not a drillthrough page.
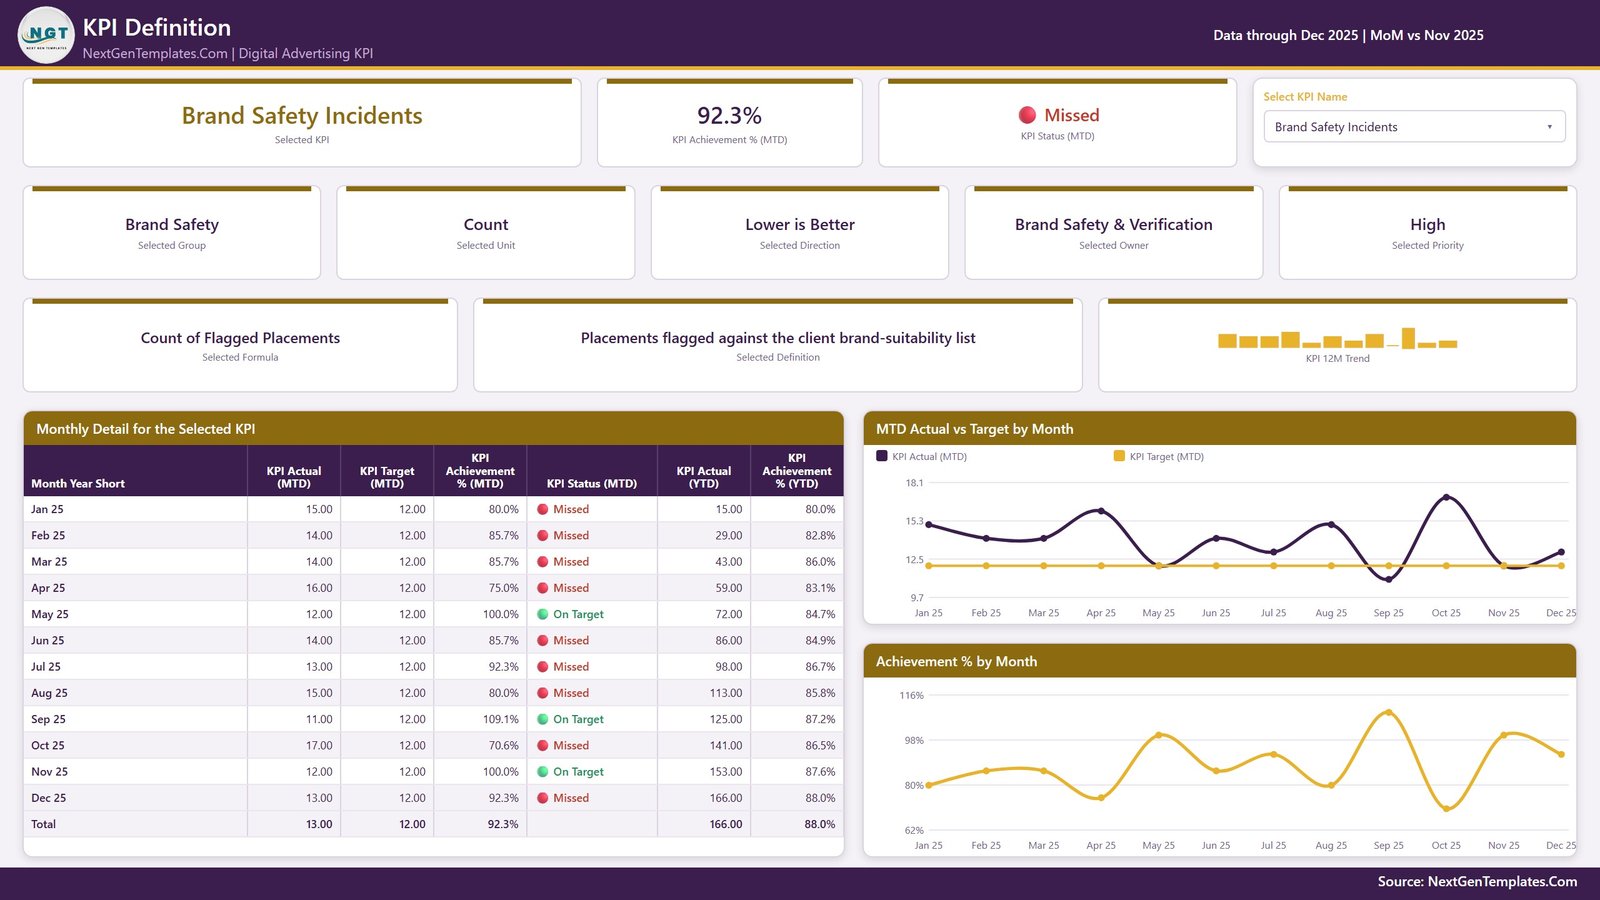
KPI Definition page
Get More Templates Page
The included catalogue page provides links to other dashboard templates, customization guidance, and NextGenTemplates support information.
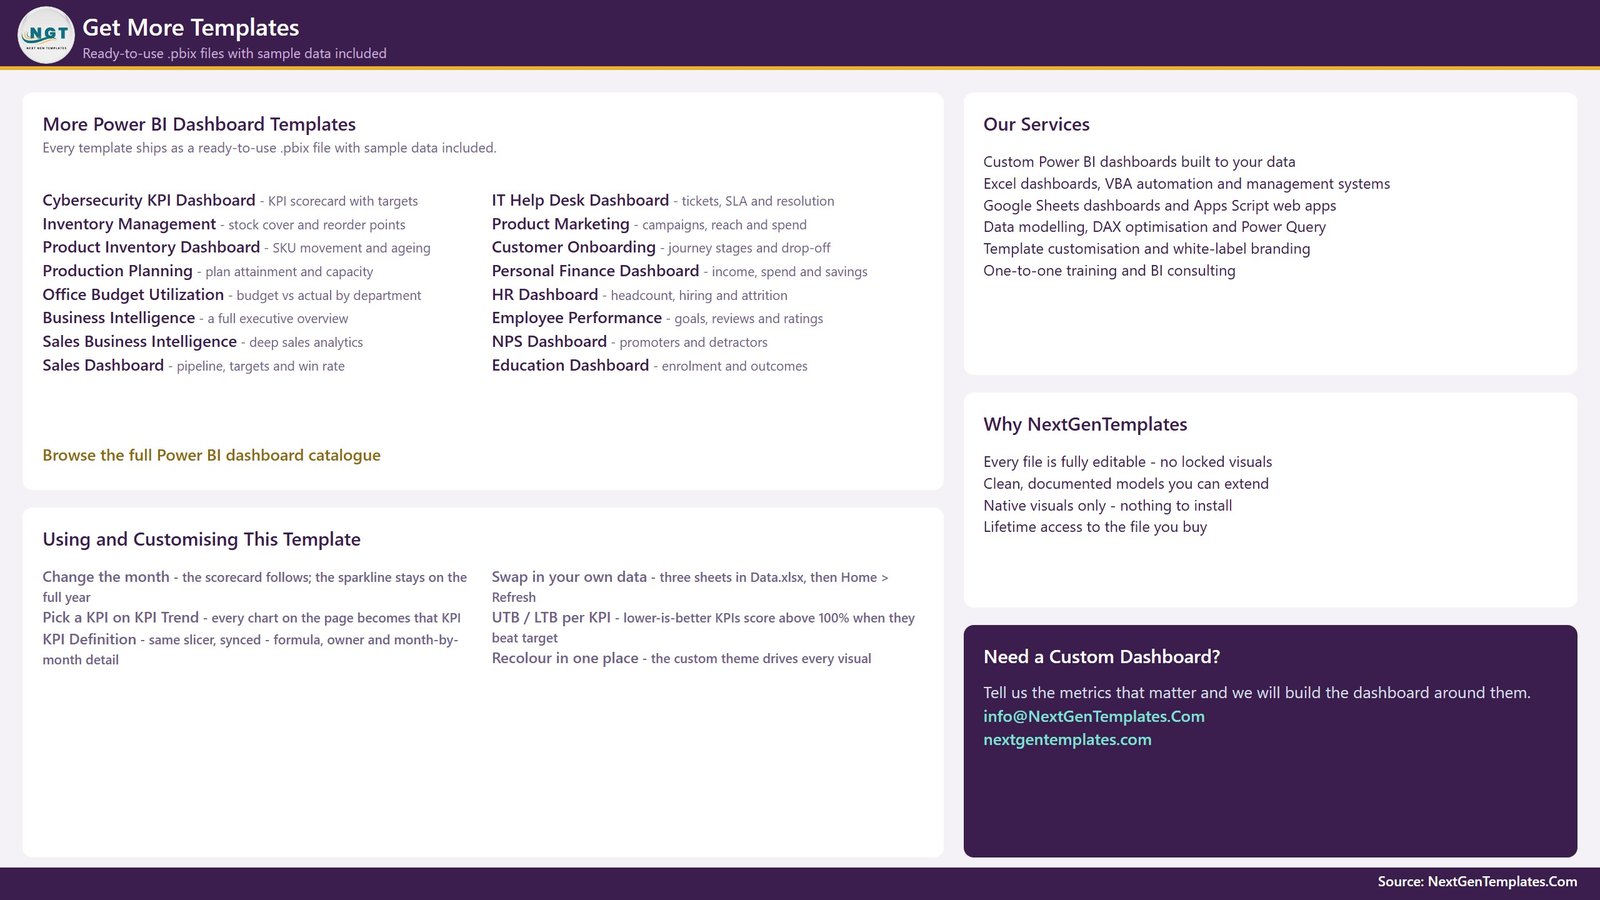
Get More Templates page
Digital Advertising KPI Dashboard in Power BI vs. Tableau vs. Paid Marketing SaaS – Where This Fits
| Feature | This Power BI template | Tableau or Qlik alternative | Paid marketing SaaS |
|---|---|---|---|
| Cost | $12.99 sale price, one time | License plus build effort | Recurring subscription |
| Setup | Replace Data.xlsx and refresh | Model and report setup required | Connector and account setup |
| Monthly targets | Included | Must be configured | Plan dependent |
| UTB/LTB scoring | Included per KPI | Custom logic required | Vendor dependent |
| Custom fields | Editable in PBIX and source file | Editable with BI skills | Limited by vendor |
| Live ad-platform connection | No; manual/source refresh | Requires connectors | Often included |
| Sharing | Desktop file or your Power BI Service | Server/cloud plan | Seat or link controls |
Who This Template Is For – and Who It’s Not For
Use it for paid-media managers, performance marketers, agency account leads, marketing operations teams, and analysts who already consolidate advertising data and need a target-led review layer. It is especially useful for monthly business reviews, client reporting, campaign governance, and executive scorecards.
It is not a connector for Google Ads, Meta Ads, LinkedIn Ads, or any other network. It does not pull live campaign data, create ads, optimize bids, verify brand safety, detect invalid traffic, or guarantee marketing performance. Power BI Desktop knowledge is helpful when changing the model.
How to Use the Digital Advertising KPI Dashboard in Power BI
- Unzip the download and open the PBIX in Power BI Desktop.
- Open Data.xlsx and replace the sample actuals, targets, prior-year values, and KPI definitions while preserving the existing column structure.
- Save the workbook and refresh the Power BI report.
- Use Month, KPI Group, Owner, Priority, and Direction filters to focus the scorecard.
- Select a KPI on the Trend and Definition pages to review its monthly pattern and calculation context.
- Validate every formula and target against your organization’s definitions before sharing results.
Real-World Use Cases
Agency Account Lead
Combine approved monthly client figures into one scorecard and use status lights to structure the review around missed and at-risk KPIs.
Performance Marketing Manager
Compare CPC, CPM, CPA, conversion rate, ROAS, impression share, and spend against monthly targets without mixing higher-is-better and lower-is-better logic.
Marketing Operations Analyst
Maintain KPI ownership and definitions, then use the Trend page to separate one-month movement from cumulative YTD performance.
Frequently Asked Questions
Does it connect directly to advertising platforms?
No. The template uses the included Data.xlsx source and refreshes from data you supply.
How many KPIs are included?
The sample model contains 13 digital advertising KPIs across performance, cost efficiency, delivery, media quality, investment, creative operations, and brand safety.
Can I replace the KPIs?
Yes, but changes must preserve or deliberately update the model structure and measures. Test every calculation after editing.
What software do I need?
You need Microsoft Power BI Desktop to open and edit the PBIX. Editing Data.xlsx also requires compatible spreadsheet software.
Is Power BI Service included?
No. Publishing, online sharing, refresh gateways, and Microsoft licensing are managed separately by you.
Is this the same as an analytical advertising dashboard?
No. This is the KPI scorecard family: it focuses on targets, status, direction, trend, and definitions. Analytical campaign dashboards explore channels, campaigns, regions, and other detailed drivers.
About the Author
Built by PK – Microsoft Certified Professional with 15+ years of Excel, Google Sheets, and Power BI experience. Founder of NextGenTemplates, reaching 300K+ subscribers across YouTube channels. Every template is hand-built and tested before release.
Explore Related Templates
- Digital Advertising KPI Dashboard in Google Sheets for a browser-based scorecard.
- Digital Marketing Campaign Dashboard in Power BI for campaign-level analysis.
- MarTech Dashboard in Power BI for wider marketing technology reporting.
- Advertising Dashboard in Power BI for broader advertising analysis.
- Browse Power BI KPI Dashboard templates.
Turn your approved monthly advertising figures into a consistent KPI review. Download the editable Power BI template, replace the sample data, refresh, and validate the results against your own definitions.
Last updated: August 18, 2026.






























Reviews
There are no reviews yet.