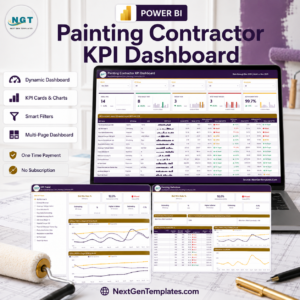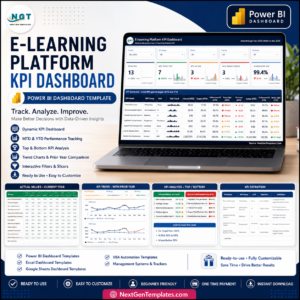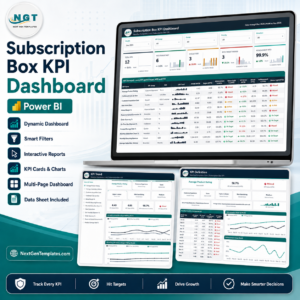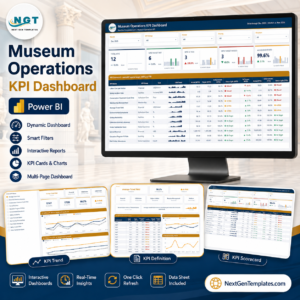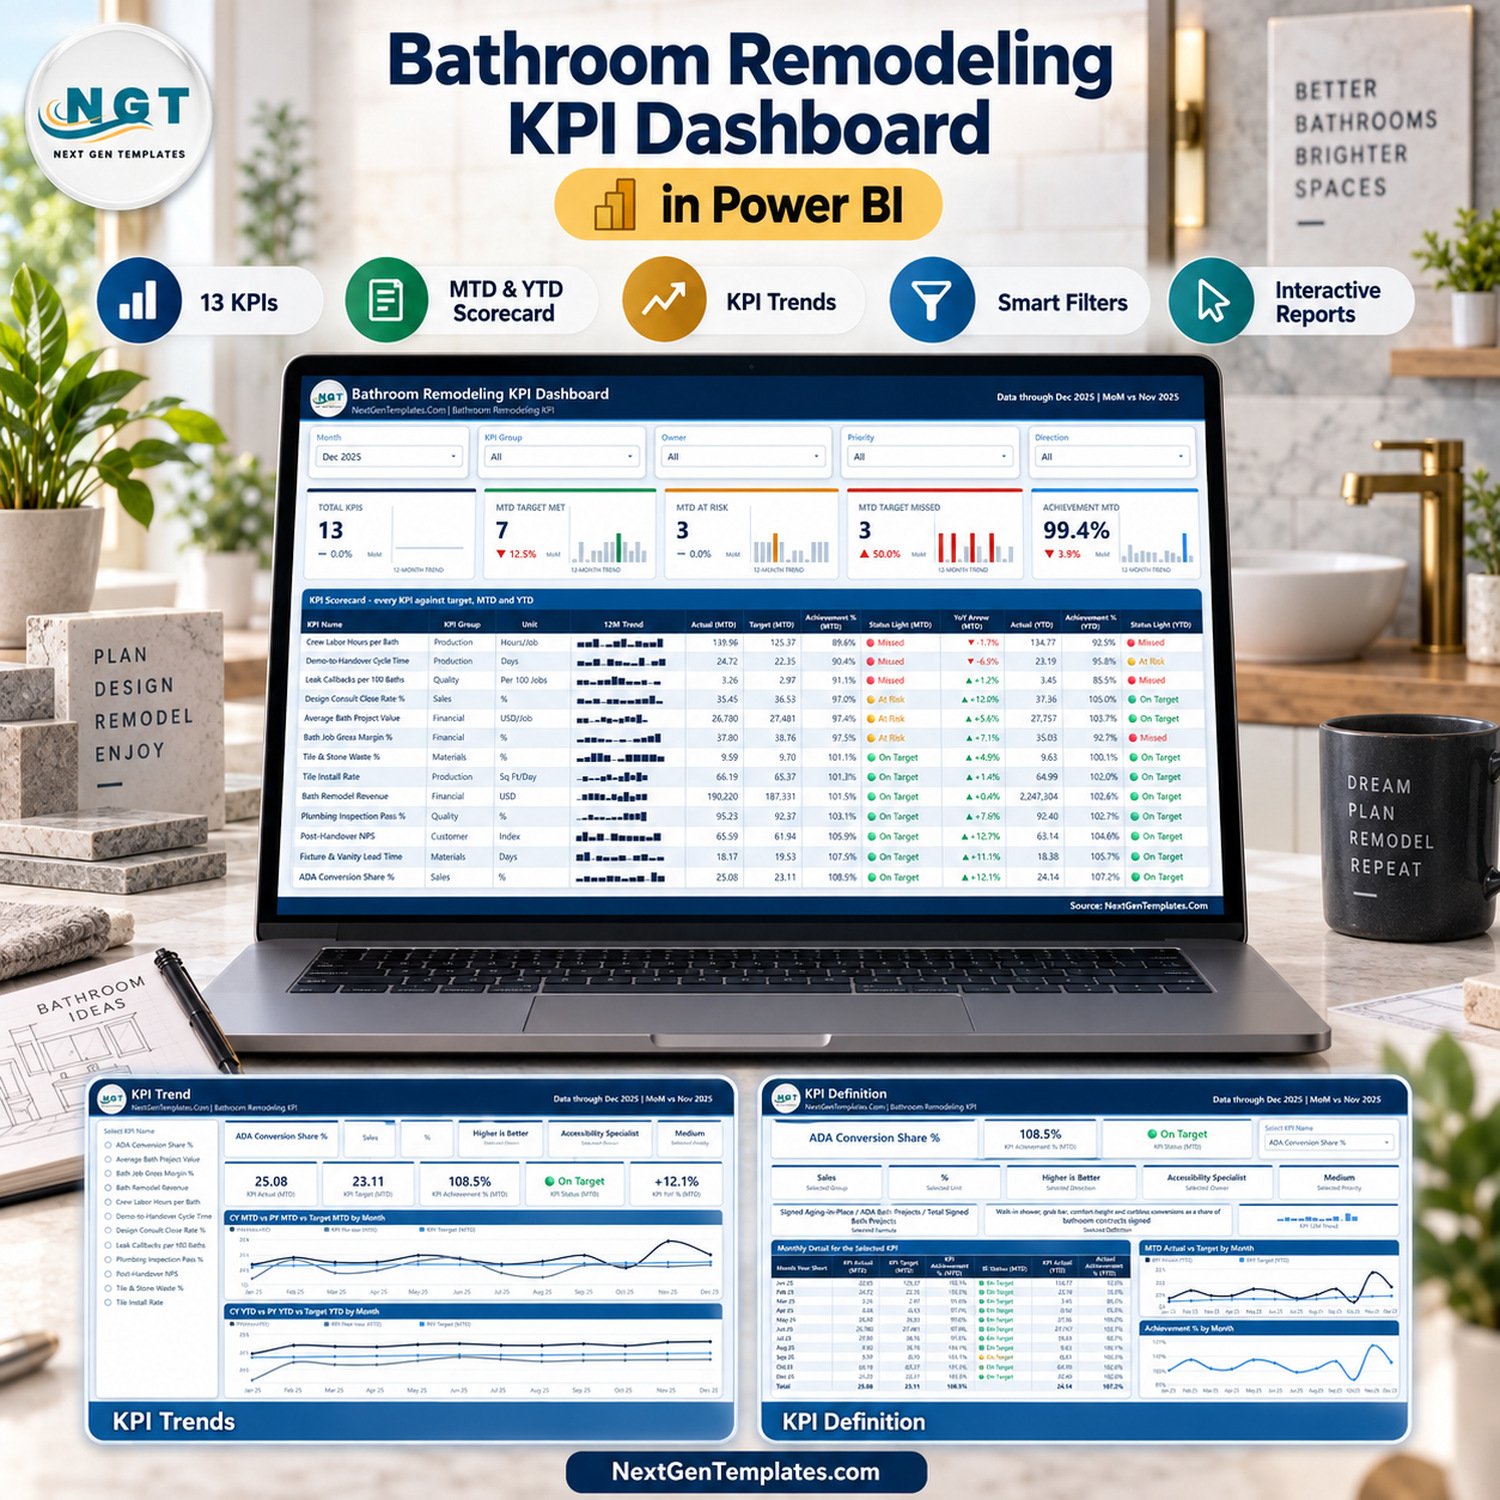
The Bathroom Remodeling KPI Dashboard in Power BI scores 13 KPIs in 6 groups against monthly targets, with Month-to-Date and Year-to-Date traffic lights on one scorecard page. The shipped sample covers January to December 2025, with 2024 as the prior year. The December 2025 view reads 7 On Target, 3 At Risk and 3 Missed, at an overall MTD achievement of 99.4%.
It belongs to the NextGenTemplates Power BI KPI Dashboard line (month slicer, traffic lights, KPI Trend and KPI Definition pages). It is not one of our analytical Power BI dashboards, which chart transaction-level data. Your numbers go into the included Data.xlsx, then one Refresh updates every page.
✅ Instant download · One-time payment · No subscription · Lifetime access to the file you buy
🔑 Key Features of the Bathroom Remodeling KPI Dashboard in Power BI
- 📊 13 bathroom-specific KPIs in 6 groups. Financial: Bath Remodel Revenue, Average Bath Project Value, Bath Job Gross Margin %. Sales: Design Consult Close Rate %, ADA Conversion Share %. Production: Tile Install Rate, Demo-to-Handover Cycle Time, Crew Labor Hours per Bath. Quality: Plumbing Inspection Pass %, Leak Callbacks per 100 Baths. Materials: Tile & Stone Waste %, Fixture & Vanity Lead Time. Customer: Post-Handover NPS.
- 🎯 Direction-aware achievement. 8 KPIs are higher-is-better and 5 are lower-is-better. Lower-is-better KPIs score Target divided by Actual, so a bathroom handed over in fewer days than planned, or with fewer leak callbacks than the target, scores above 100%.
- 🚦 Three-band status lights for MTD and YTD. On Target at 100% or more, At Risk from 95% to just under 100%, Missed below 95%. Both lights sit on every row, so a KPI that slipped this month but is still ahead for the year is easy to spot.
- 🎛️ Five slicers on the scorecard. Month, KPI Group, Owner, Priority and Direction. Show only the 5 Critical KPIs, or only the KPIs owned by the Warranty Manager or the Tile Crew Lead, in two clicks.
- 📈 Five header cards with 12-month mini trends. Total KPIs, MTD Target Met, MTD At Risk, MTD Target Missed and Achievement MTD, each with its month-on-month change against the previous month.
- 🔍 Two hidden tooltip pages. Hover a scorecard row for KPI Detail (owner, MTD achievement and variance), or hover a trend line for Trend Detail (priority, MTD and YTD achievement and on-target rate).
- 🧾 A formula and definition for every KPI. For example, Leak Callbacks per 100 Baths is waterproofing and leak warranty callbacks divided by baths completed, times 100, counted within 12 months of handover.
- 🔄 Driven by data, not hard-coded. Rename, add or delete KPIs in Data.xlsx. Counts, the scorecard, the KPI list and every chart follow after Home > Refresh.
📦 What’s Inside the Download
The ZIP for the Bathroom Remodeling KPI Dashboard in Power BI contains the .pbix report, Data.xlsx (KPI Definition, Input_ Target and Input_ Actual sheets plus a Read Me) and a Power BI dashboard user manual in PDF. The report has four visible pages.
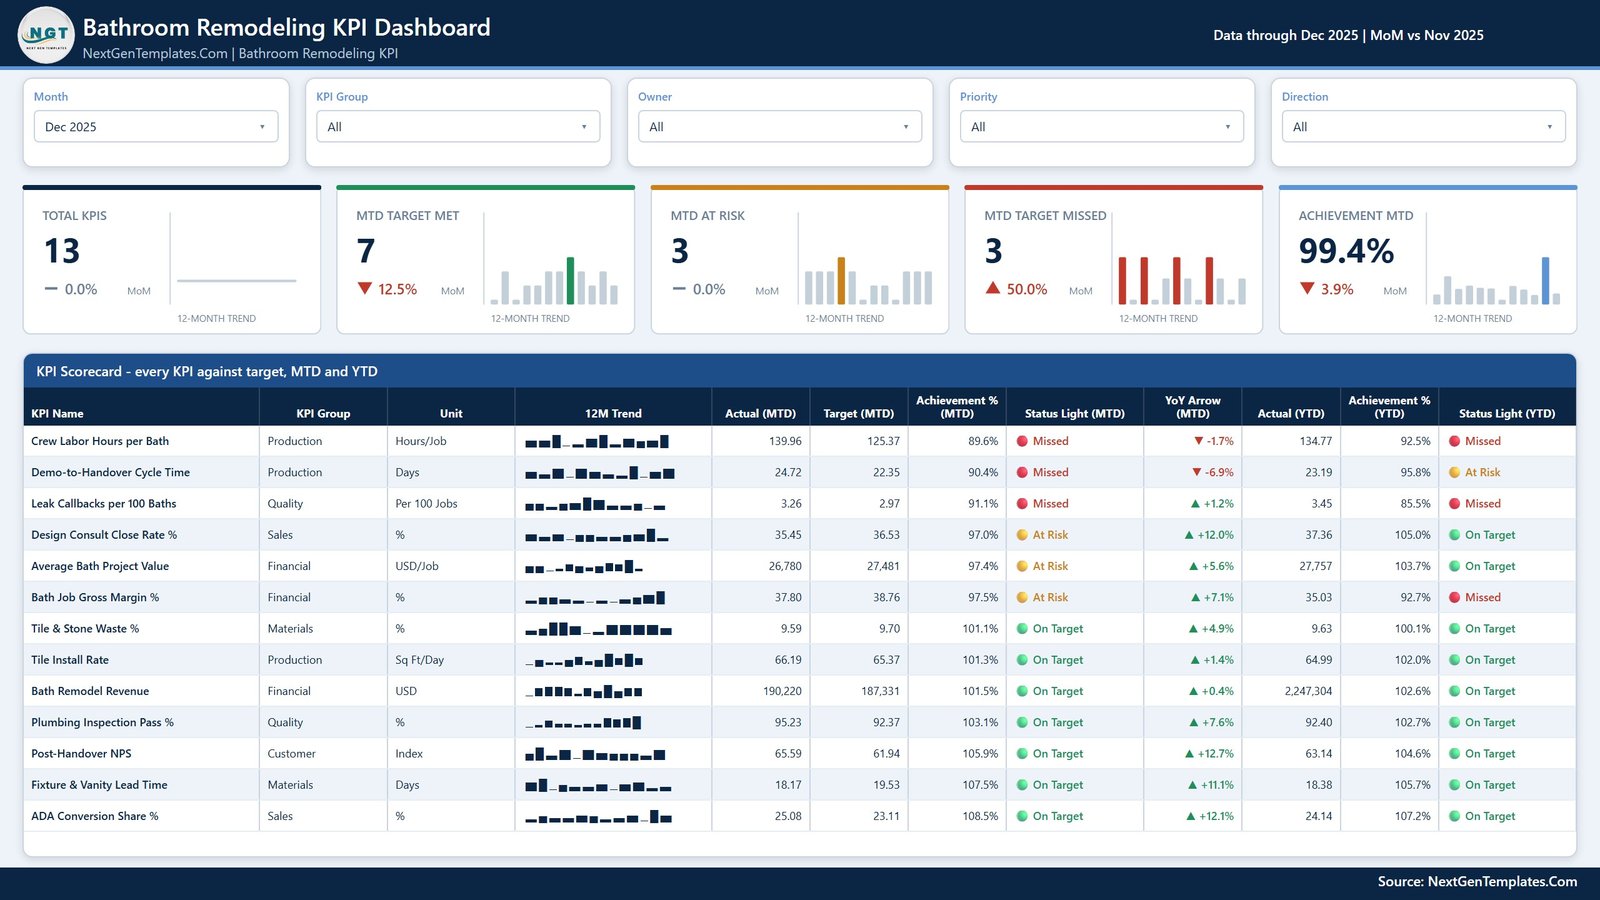
Page 1: KPI Scorecard
Five slicers, five KPI count cards with 12-month trends, and a 13-row table showing KPI Group, Unit, a 12M Trend sparkline, Actual and Target MTD, Achievement % MTD, Status Light MTD, YoY Arrow (MTD), Actual YTD, Achievement % YTD and Status Light YTD.
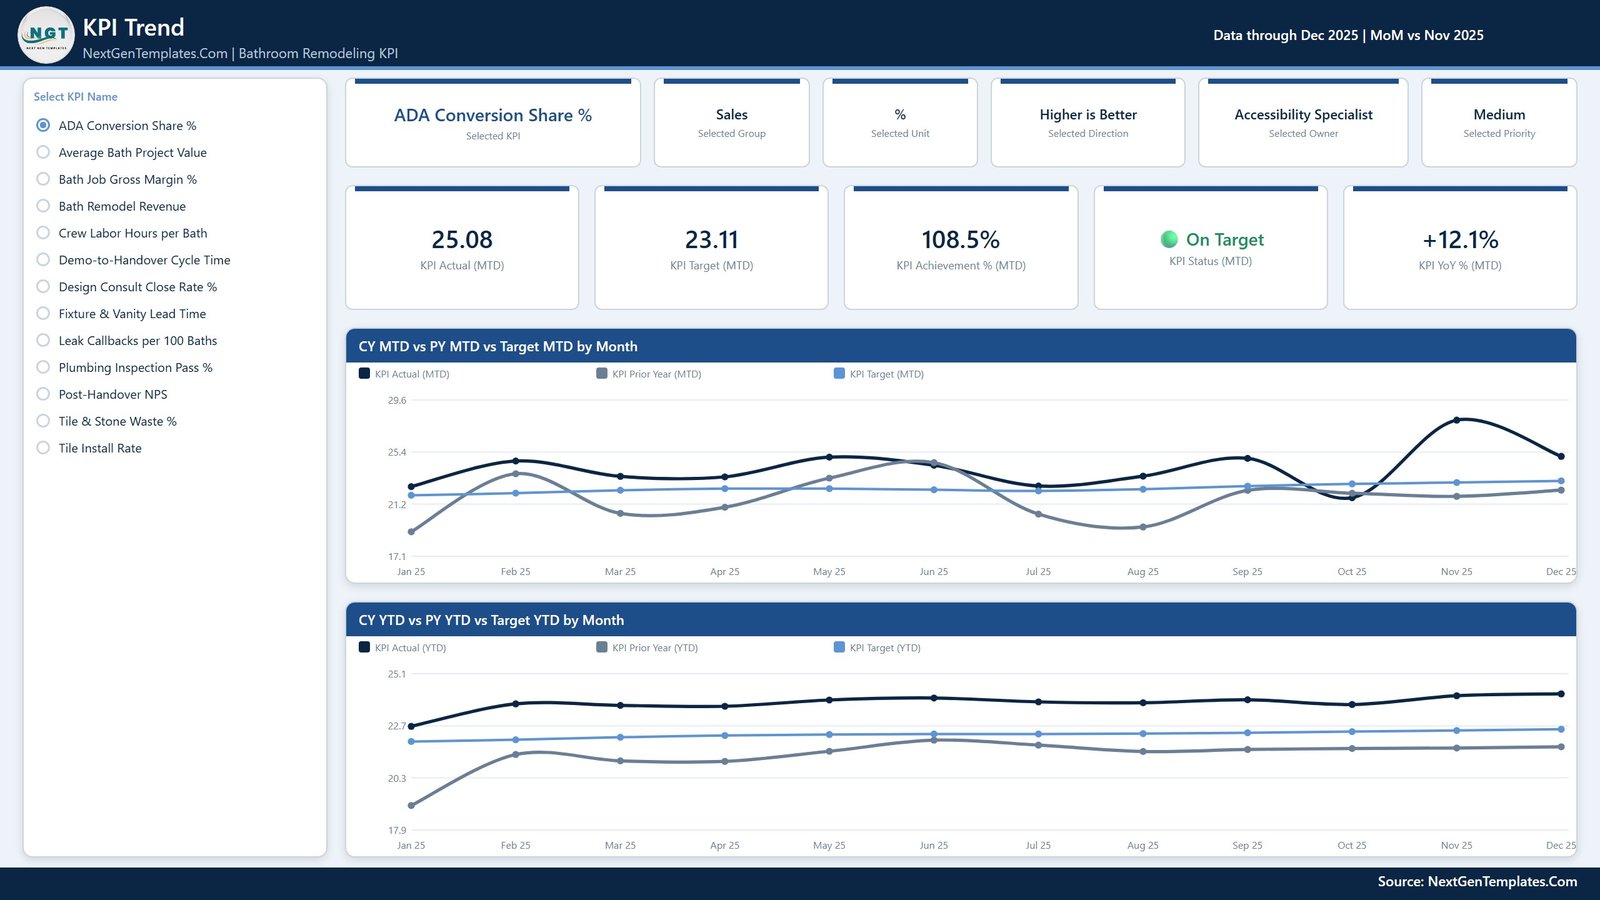
Page 2: KPI Trend
Pick one of the 13 KPIs from the list to see its group, unit, direction, owner and priority, five cards (Actual, Target, Achievement %, Status and YoY % for the month), and two charts: CY MTD vs PY MTD vs Target MTD by Month and CY YTD vs PY YTD vs Target YTD by Month.
Page 3: KPI Definition
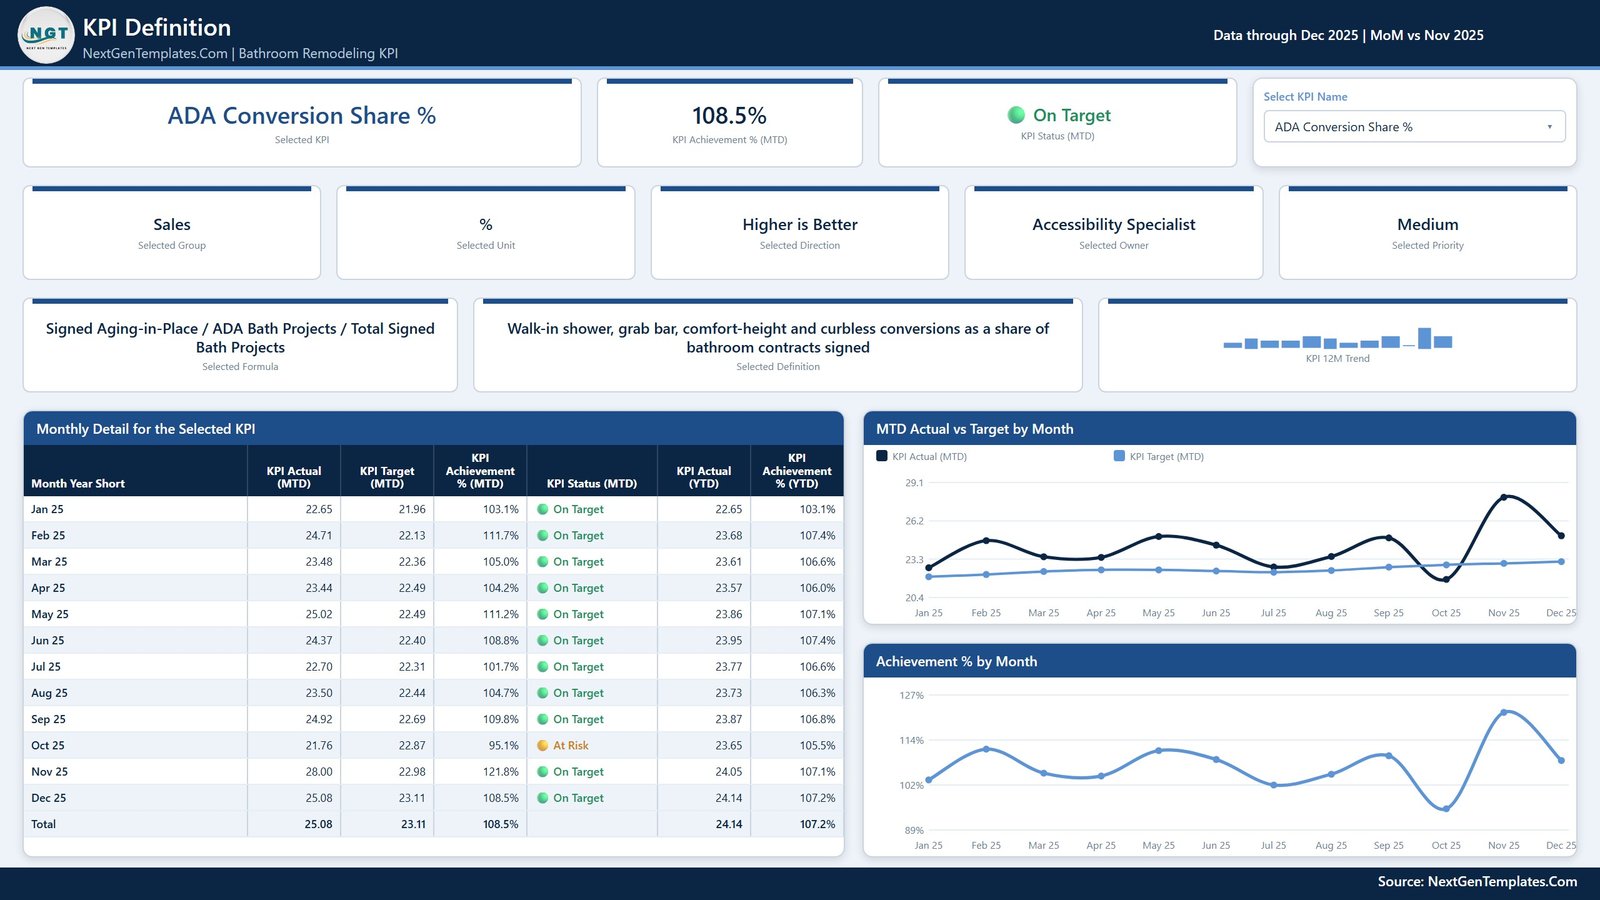
Shows the selected KPI’s formula and plain-English definition, a Monthly Detail table with 12 months plus a total, and two charts: MTD Actual vs Target by Month and Achievement % by Month. In the sample, ADA Conversion Share % is On Target in 11 months and At Risk only in October 2025, at 95.1%.
Page 4: Get More Templates
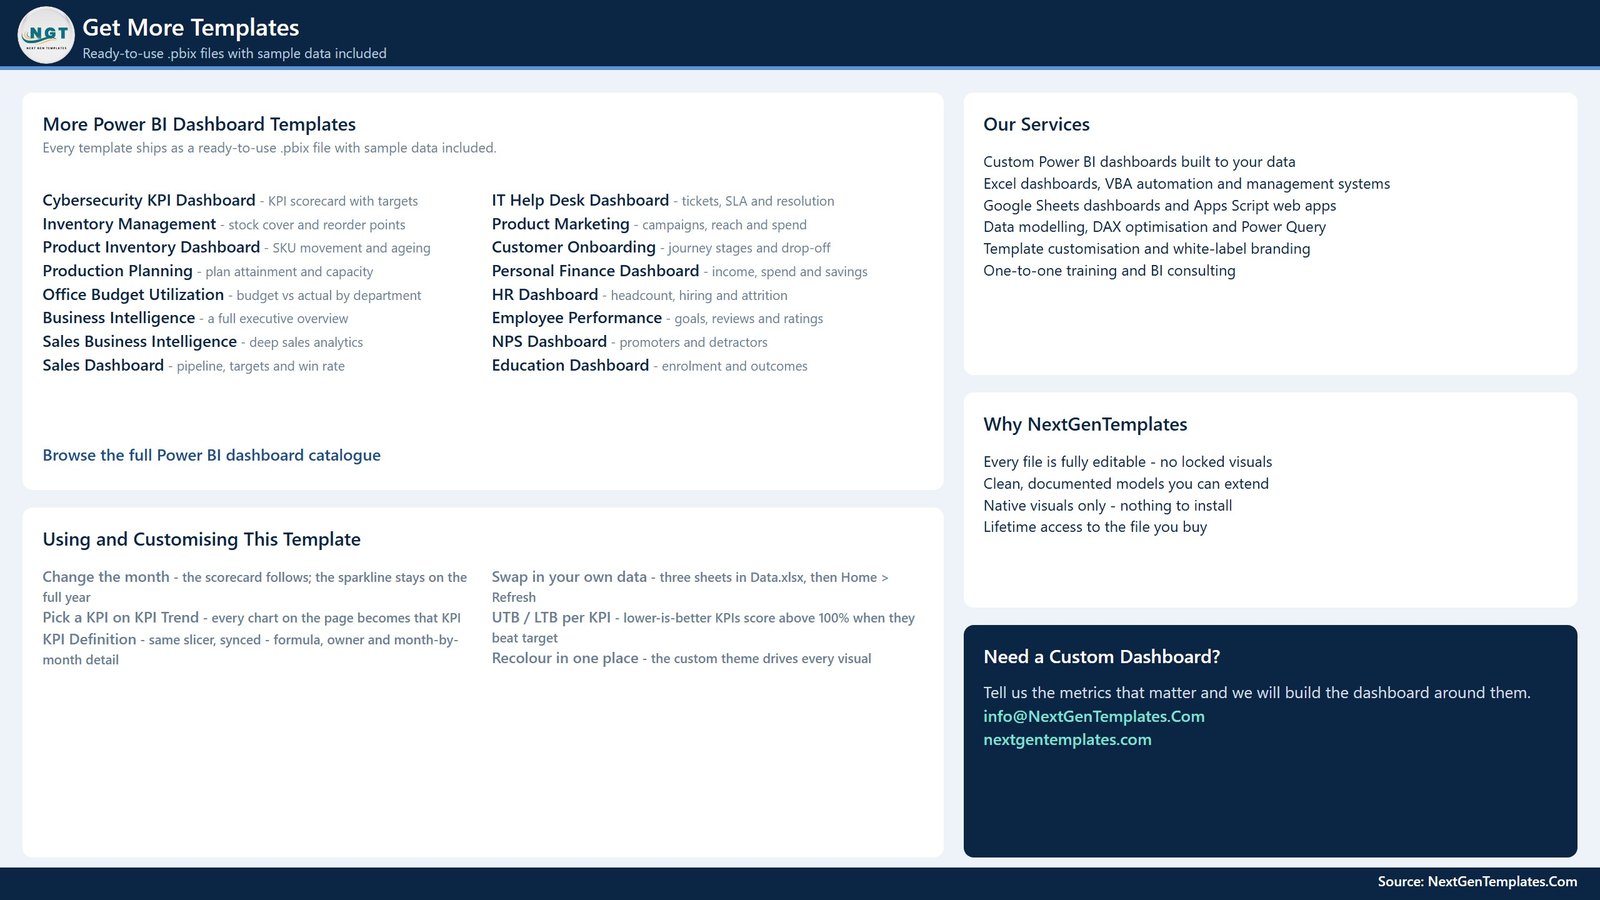
Quick tips on the month slicer, UTB and LTB scoring and recolouring through the custom theme, plus links to more Power BI templates and our custom-build contact details.
📊 This Power BI KPI Dashboard vs. Tableau / Qlik vs. Buildertrend / JobTread — Where It Fits
| Feature | This bathroom remodeling KPI dashboard | Tableau / Qlik build | Buildertrend / JobTread |
|---|---|---|---|
| Cost | ✅ $12.99 sale ($19.99 regular), one time | Per-user licences plus build time | Recurring subscription |
| Platform | Power BI Desktop (Windows) | Tableau or Qlik | Web and mobile app |
| Setup time | ✅ Open, point at Data.xlsx, Refresh | Model and visuals built from scratch | Account onboarding and job setup |
| Bathroom remodeling KPIs out of the box | ✅ 13, each with formula and owner | None shipped | Vendor’s own job reports |
| Direction-aware target scoring | ✅ UTB and LTB built in | Must be written | Depends on the report |
| Real-time team collaboration | After publishing to the Power BI Service | Via Tableau Cloud or Qlik Cloud | ✅ Built in |
| Mobile access | Power BI mobile app after publishing | ✅ Mobile apps | ✅ Mobile apps |
| Customizable KPI list | ✅ Edit rows in Data.xlsx | ✅ Fully custom | Limited to the vendor’s fields |
| Year-1 cost at 5 users | ✅ One purchase; Microsoft licences only if you share online | Five user licences | Subscription for the team |
For remodelers who want a monthly KPI review without paying for a full job-management platform, this Power BI KPI dashboard sits in the sweet spot.
👥 Who This Template Is For — and Who It’s Not For
✅ This template is built for:
- Owners and general managers of bathroom remodeling companies who review margin, revenue and job value every month.
- Project managers and field superintendents tracking demo-to-handover days, crew labor hours and tile install rate.
- Warranty and quality leads watching leak callbacks and first-time plumbing inspection passes.
- BI consultants who need a ready remodeling KPI pack to adapt for a client.
❌ This template is NOT for:
- Firms that need scheduling, estimating, invoicing or a client portal. This is a reporting layer, not job-management software.
- Mac-only teams, because Power BI Desktop runs on Windows.
- Anyone looking for permit, building-code, plumbing or electrical licensing, or warranty compliance records. The dashboard reports the numbers you enter and certifies nothing.
⚙️ How to Use This Dashboard
- Unzip the download and keep the .pbix and Data.xlsx in the same folder.
- Install Power BI Desktop, free from Microsoft, and open the .pbix.
- If you moved Data.xlsx, use Home > Transform data > Data source settings > Change Source.
- In KPI Definition, keep one row per KPI with Group, Unit, Formula, Definition, Type (UTB or LTB), Owner and Priority.
- Enter monthly MTD and YTD targets in Input_ Target, and actuals for the reporting year and the prior year in Input_ Actual.
- Press Home > Refresh, then choose your month on the KPI Scorecard page.
💼 Real-World Use Cases
Maria owns a bathroom remodeling company with four install crews. At her monthly review she filters the scorecard to the Financial group and sees Bath Job Gross Margin % At Risk this month and Missed for the year (92.7% YTD achievement). She opens KPI Definition to confirm the formula counts labor, tile, fixture and subcontractor cost before she re-prices her next wet-room quotes.
Dev is the warranty manager. He sets the Owner slicer to Warranty Manager and finds Leak Callbacks per 100 Baths Missed at 3.26 against a 2.97 target. On KPI Trend he compares the year against 2024 to judge whether shower pan and membrane callbacks are a one-month spike or a pattern for the field team to fix.
Alicia leads sales and aging-in-place projects. She tracks ADA Conversion Share % (25.08% in December against 23.11%) next to Design Consult Close Rate %, which sits At Risk at 97.0% of target, to decide whether walk-in shower and grab bar demand deserves its own consultation slot.
❓ Frequently Asked Questions
What KPIs does the Bathroom Remodeling KPI Dashboard in Power BI track?
It tracks 13 KPIs: Bath Remodel Revenue, Average Bath Project Value, Bath Job Gross Margin %, Design Consult Close Rate %, ADA Conversion Share %, Tile Install Rate, Demo-to-Handover Cycle Time, Crew Labor Hours per Bath, Plumbing Inspection Pass %, Leak Callbacks per 100 Baths, Tile & Stone Waste %, Fixture & Vanity Lead Time and Post-Handover NPS.
Is this a KPI dashboard or an analytical Power BI dashboard?
It is a KPI dashboard. You enter one actual and one target per KPI per month, and it scores achievement with traffic lights and year-over-year comparison. Our analytical Power BI dashboards are a different line that charts row-level transactions such as individual jobs or invoices.
Do I need a Power BI Pro licence?
No licence is needed to open, edit and refresh the report in Power BI Desktop, which Microsoft provides free. If you publish it to the Power BI Service to share with your team, Microsoft’s licensing terms for that service apply.
How long does setup take?
The sample opens straight away. Loading your own year depends on how ready your numbers are: you need 13 KPI rows, 12 monthly targets per KPI and 24 months of actuals per KPI, covering the reporting year and the prior year, then one Refresh.
How does this compare to Buildertrend or JobTread?
Those platforms run jobs, schedules and client communication on a subscription. This dashboard does one job: it scores 13 business KPIs against target each month for a one-time price. Many remodelers keep their job software and feed monthly totals from it into this report.
Is the YoY arrow direction-aware?
No. The YoY Arrow (MTD) column colours by the direction of change only, so a lower-is-better KPI that improved, such as Crew Labor Hours per Bath down 1.7%, shows a red arrow. Achievement %, both status lights and the header counts are direction-aware and correct.
👤 About the Author
Built by PK, Microsoft Certified Professional with 15+ years of Excel, Google Sheets and Power BI experience and founder of NextGenTemplates, with YouTube channels @PKAnExcelExpert, @NextGenTemplates and @NeoTechNavigators. Every template is hand-built and tested before release.
🔗 Explore Related Templates
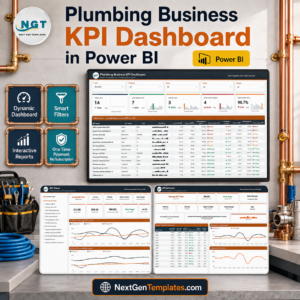
- 🚿 Plumbing Business KPI Dashboard in Power BI for the plumbing side of wet-room work.
- 🪟 Glass Installation KPI Dashboard in Power BI if you also fit shower screens and glass.
- 🧱 Flooring Installation KPI Dashboard in Power BI for tile and floor crews.
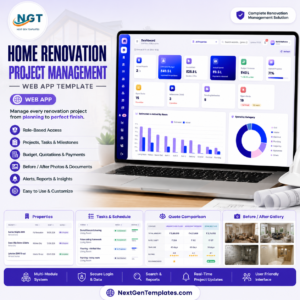
- 🏠 Home Renovation Project Management Web App when you need job tracking as well as KPIs.
- 📋 Bathroom Remodeling KPI Scorecard in Google Sheets, a separate scorecard product for teams that work in Google Sheets.
Browse every Power BI template in the store. An Excel edition of this bathroom remodeling KPI dashboard and a Kitchen Remodeling KPI Dashboard in Power BI are in preparation.
📖 Click here to read the Detailed Blog Post
🎥 Visit our YouTube channel for step-by-step video tutorials
👉 YouTube.com/@NextGenTemplates
📅 Last updated: September 2026