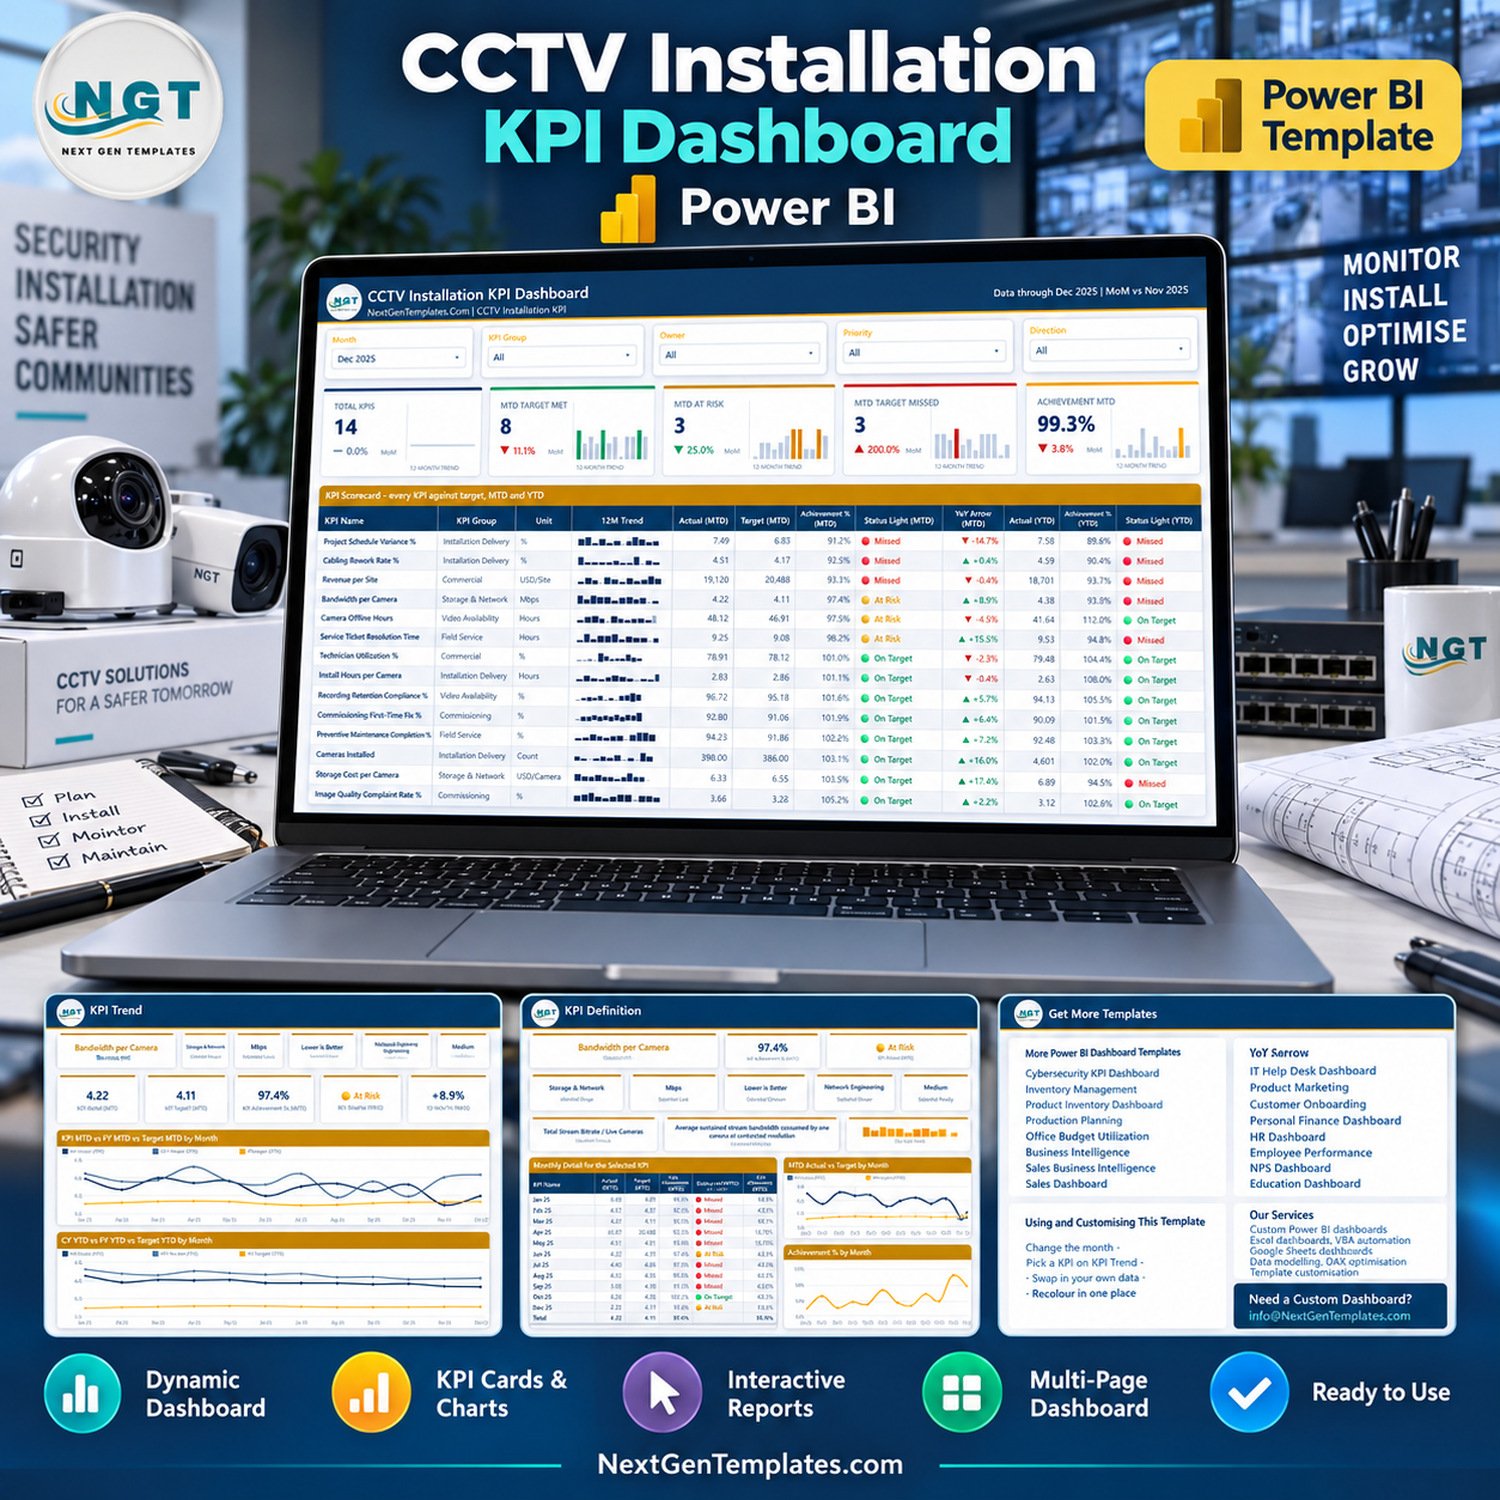
The CCTV Installation KPI Dashboard in Power BI tracks 14 installation, commissioning, availability and service KPIs across 6 KPI groups, on three interactive report pages plus two hover tooltip pages. The sample pack carries 504 monthly rows — 168 target rows for 2025 and 336 actual rows covering 2024 and 2025 — so every month-on-month and year-on-year figure is live the moment you open it. Setup is a spreadsheet edit and one refresh.
🌐 Join 8,400+ teams in 40+ countries using NextGenTemplates to replace paid SaaS tools with one-time-purchase Excel, Google Sheets, Power BI and HTML templates.
✅ Instant download · One-time payment · No subscription · No per-user fees · Lifetime access
⚠ Read this before you buy. This is an internal management reporting template over data you supply. It does not view, record, store, analyse or process any video, image or footage of any kind — it holds installation project records only. It performs no facial recognition, no biometric identification and no video analytics. It does not establish compliance with GDPR or UK GDPR, the EU AI Act, the Data Protection Act 2018, the Surveillance Camera Code of Practice, BIPA, state CCTV or two-party consent laws, data-retention rules, or any installer licensing requirement (SIA, state alarm and CCTV licences). It is not a Data Protection Impact Assessment, a surveillance risk assessment, a system design, a commissioning record or an inspection certificate, and it certifies nothing about camera performance, coverage, uptime or evidential quality. If you enter client site names, camera locations or any personal data into the workbook, lawful handling, minimisation and retention of that data are entirely your responsibility. Every figure in the screenshots is buyer-entered demo data.
🔑 Key Features of the CCTV Installation KPI Dashboard in Power BI
📍 14 KPIs, defined in the file rather than hard-coded. The KPI Definition sheet carries all 14 metrics with unit, formula, plain-English definition, owner, priority and direction: Cameras Installed, Install Hours per Camera, Cabling Rework Rate %, Project Schedule Variance %, Commissioning First-Time Fix %, Image Quality Complaint Rate %, Camera Offline Hours, Recording Retention Compliance %, Bandwidth per Camera, Storage Cost per Camera, Service Ticket Resolution Time, Preventive Maintenance Completion %, Revenue per Site and Technician Utilization %.
📊 Direction-aware scoring. Each KPI is tagged UTB (higher is better) or LTB (lower is better). Higher-is-better KPIs score Actual ÷ Target; lower-is-better KPIs score Target ÷ Actual, so beating a cost or cycle-time target reads above 100%. The traffic light is fixed at On Target from 100%, At Risk from 95% to 100%, and Missed below 95%.
🔄 Nothing in the report is bound to a KPI name. Rename, add or delete a KPI in the three input sheets, press Home > Refresh, and the cards, the scorecard, the KPI slicer list and every chart follow. The visuals reference 46 distinct field and measure names between them; none of them names a specific metric.
🗺 Six KPI groups with real owners. Installation Delivery, Commissioning, Video Availability, Storage & Network, Field Service and Commercial, each pointing at a named owner such as Field Operations, Commissioning Team, Remote Monitoring Center, Network Engineering, Service Desk or Commercial Finance.
💡 MTD and YTD handled correctly. YTD sums for additive measures such as counts and money, and averages for rates and ratios — the difference that stops a compliance percentage from adding up to 1,900% by December.
📦 What’s Inside the CCTV Installation KPI Dashboard in Power BI
The download is a ZIP holding three files: the .pbix report, Data.xlsx (the four-sheet data pack — Read Me, Input_ Target, Input_ Actual and KPI Definition) and a Power BI Dashboard – User Manual PDF. Keep all three in the same folder.
Page 1: KPI Scorecard
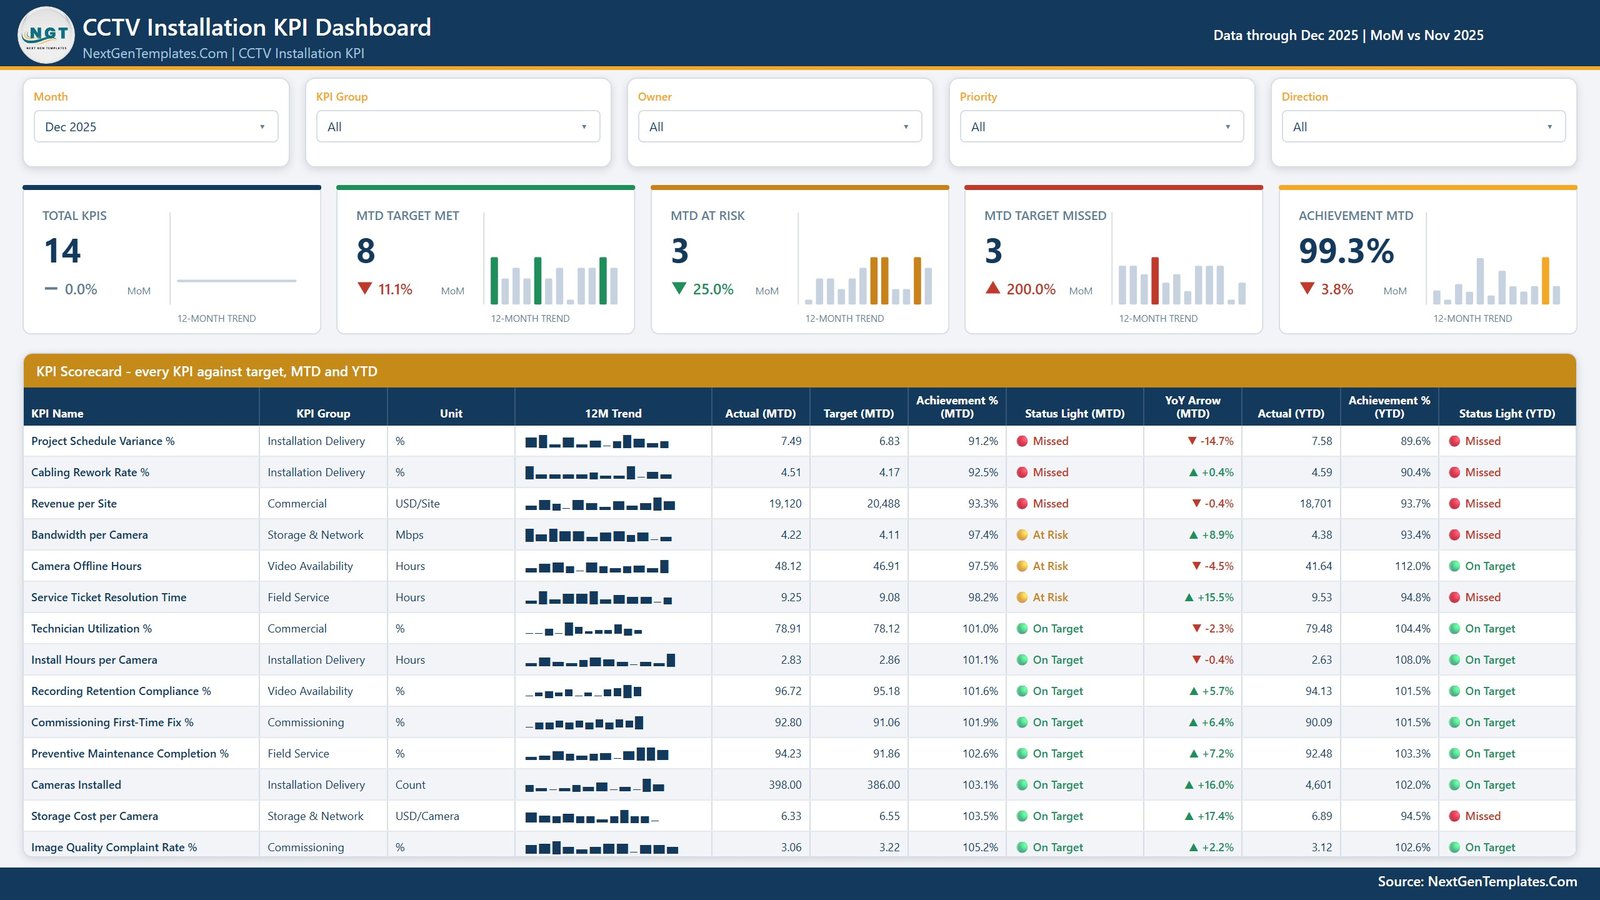
Five slicers — Month, KPI Group, Owner, Priority and Direction — sit above five summary cards: Total KPIs, MTD Target Met, MTD At Risk, MTD Target Missed and Achievement MTD, each with its own MoM delta and a 12-month sparkline. Below them the scorecard table lists every KPI with group, unit, a 12-month trend column, Actual and Target MTD, Achievement % MTD, a status light, a YoY arrow, Actual YTD, Achievement % YTD and a second status light.
Page 2: KPI Trend
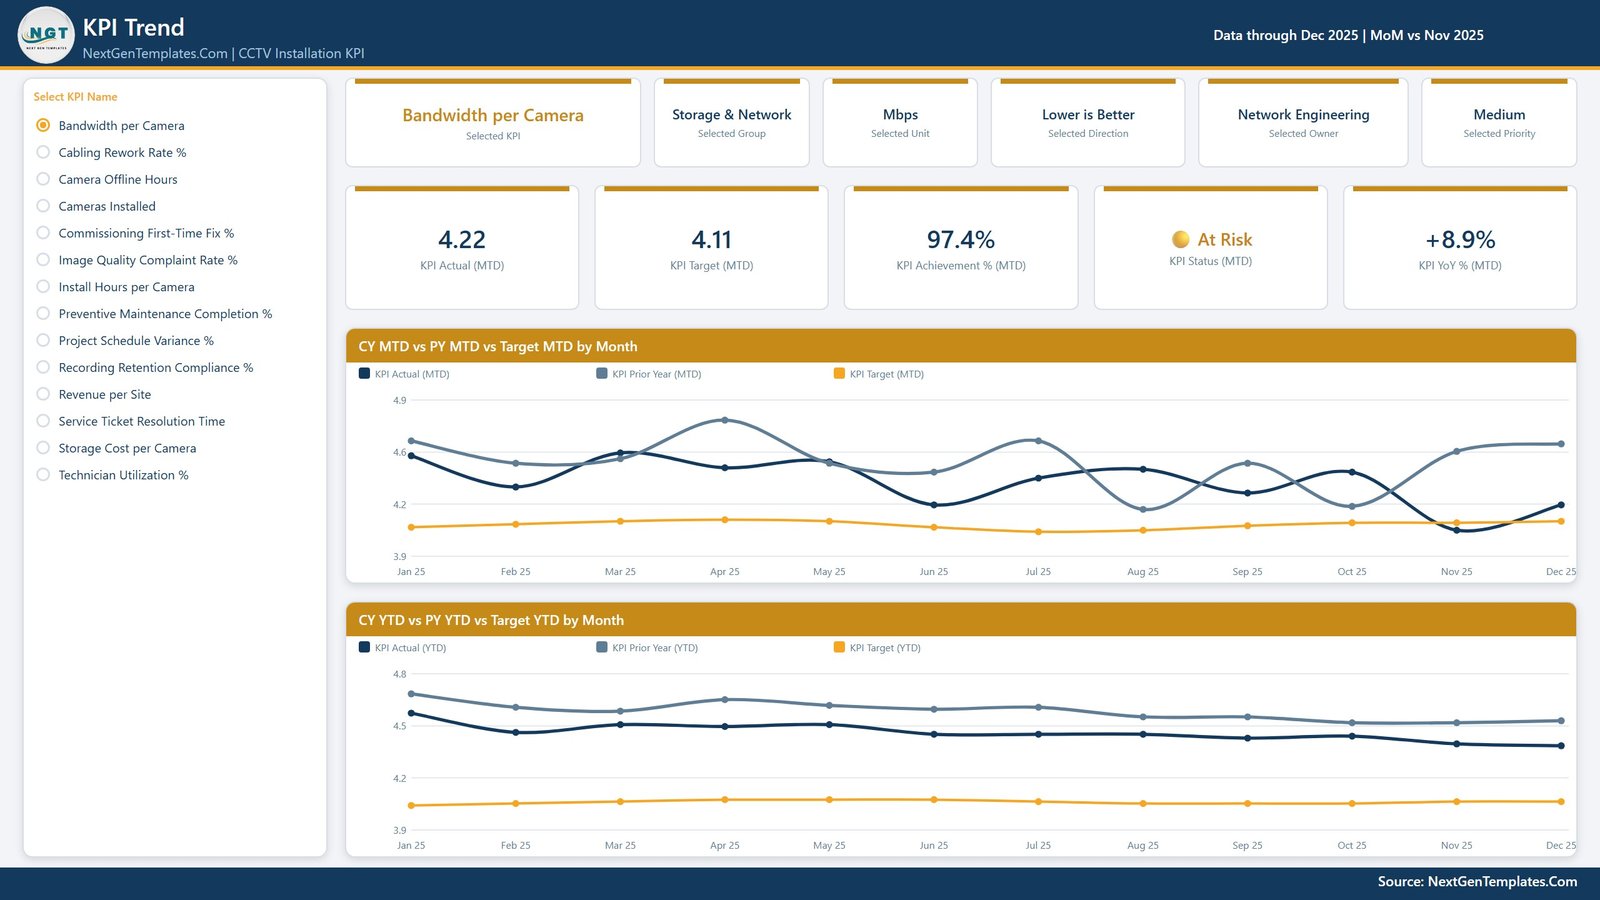
A single-select KPI list on the left drives the whole page. Six context cards restate the selected KPI, group, unit, direction, owner and priority; five value cards show Actual MTD, Target MTD, Achievement % MTD, the status light and YoY % MTD. Two line charts follow: CY MTD vs PY MTD vs Target MTD by Month and CY YTD vs PY YTD vs Target YTD by Month, each plotting current year, prior year and target together.
Page 3: KPI Definition
The same KPI selection, synced as a slicer rather than a drillthrough, surfaces the metric’s formula and written definition alongside its group, unit, direction, owner, priority and a 12-month sparkline. A Monthly Detail for the Selected KPI table gives twelve months of Actual MTD, Target MTD, Achievement % MTD, status, Actual YTD and Achievement % YTD with a total row, next to MTD Actual vs Target by Month and Achievement % by Month.
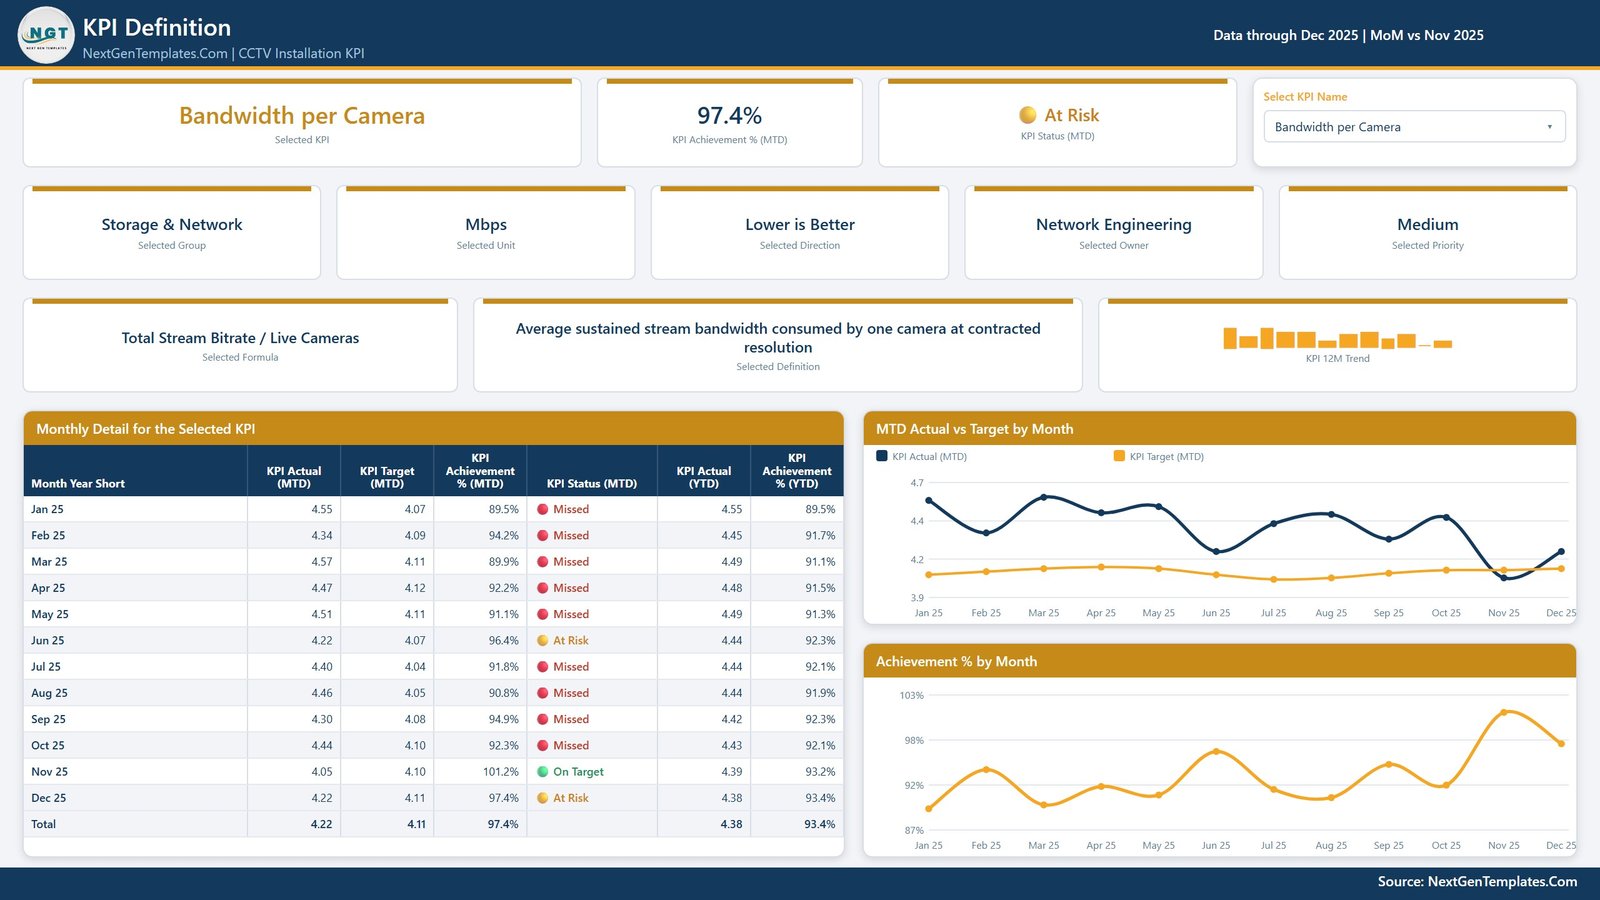
🔍 Two hover tooltip pages — KPI Detail and Trend Detail, both 280×360 — pop up over the visuals with three cards and a bar chart each. They are hidden in view mode by design, so you will not see them as tabs. There are no hidden drillthrough pages. A fourth page in the file, Get More Templates, is the NextGenTemplates catalogue plus a short “Using and Customising This Template” note; it is not a report page, and it is deliberately left out of the gallery above.
What the export actually looks like. No clipped rows, no colliding labels and no unit or currency-format errors were found in the shipped pages. Two cosmetic points, stated plainly: the Total KPIs card’s 12-month sparkline renders as a flat, almost invisible line because the KPI count never changes month to month; and the line-chart Y axes label at uneven intervals (3.9 / 4.2 / 4.6 / 4.9 on KPI Trend) because Power BI rounds axis labels to one decimal place at that scale.
📊 This CCTV KPI Dashboard vs. a Tableau/Qlik Build vs. Field-Service SaaS — Where It Fits
| Feature | CCTV Installation KPI Dashboard in Power BI | Tableau / Qlik build | ServiceTitan / Jobber |
|---|---|---|---|
| Cost | $12.99 one-time ✅ | $75–$115 / user / month | $99–$400+ / month, quoted |
| Platform | Power BI Desktop, free from Microsoft ✅ | Paid licence per creator and viewer | Vendor-hosted only |
| Setup time | Under 10 minutes — edit Data.xlsx, press Refresh ✅ | Days of modelling and design | Weeks of onboarding and migration |
| Add or rename a KPI | One spreadsheet row, no report edits ✅ | Rebuild the calculation and the visuals | Fixed metric set, vendor roadmap |
| Target vs actual, MTD and YTD | Built in, direction-aware ✅ | You build it | Partial, job-level only |
| Prior-year comparison | 24 months shipped, YoY on every KPI ✅ | You build it | Depends on plan tier |
| Your data leaves the building | No — the file stays on your machine ✅ | Usually cloud-published | Yes, vendor-hosted |
| Real-time team collaboration | No — file-based, or publish to your own workspace | Yes ✅ | Yes ✅ |
| Year-1 cost at 5 users | $12.99 ✅ | $4,500–$6,900 | $1,200–$4,800+ |
For an installer who wants a board-ready monthly KPI pack without a BI licence or a field-service subscription, this dashboard sits in the sweet spot.
👥 Who This Template Is For — and Who It’s Not For
✅ This template is built for:
- Security and CCTV installation contractors running 5–200 sites a year who report monthly to an owner or a board
- Operations and project managers who already keep install, commissioning and service numbers in a spreadsheet and want them scored against target
- Managed-service providers reporting camera availability, retention compliance and storage cost back to clients
- Anyone who wants a Power BI KPI pack they can rename and reuse for an adjacent trade
❌ This template is NOT for:
- Anyone who needs to view, store, search or analyse actual video footage — this file never touches footage
- Teams looking for evidence of GDPR, EU AI Act, DPA 2018, BIPA or Surveillance Camera Code compliance, or for a DPIA
- Live camera health monitoring or alerting — this is a monthly management report, not an NVR or VMS console
- Dispatch, scheduling, quoting or invoicing — use a field-service system for that
- Teams that need several people editing the same report simultaneously in a browser
⚙️ How to Use the CCTV Installation KPI Dashboard in Power BI
- Unzip all three files into one folder and keep them together.
- Open
Data.xlsxand read the Read Me sheet — it explains UTB and LTB and how YTD is meant to behave. - Edit the KPI Definition sheet first: one row per KPI, with unit, formula, definition, owner, priority and direction.
- Fill Input_ Target with one row per KPI per month for your reporting year.
- Fill Input_ Actual the same way, for the reporting year and the year before it — the prior year is what every YoY figure reads from.
- Open the
.pbixin Power BI Desktop and press Home > Refresh. - Moved the workbook? Use Home > Transform data > Data source settings > Change Source to repoint it.
- Pick a month on KPI Scorecard; pick a KPI on KPI Trend and the KPI Definition page follows with it.
💼 Real-World Use Cases
Marcus runs a 22-engineer CCTV installation firm in Manchester. He replaces the demo rows with his own monthly numbers and opens the KPI Scorecard on the first Monday of every month. The MTD Target Missed card tells him in one glance how many of his 14 metrics slipped, and the Direction slicer lets him look only at the lower-is-better ones — rework, schedule variance, offline hours — before the ops meeting.
Priya manages remote monitoring for a managed-service provider. She uses the KPI Trend page on Camera Offline Hours and Recording Retention Compliance %, showing current year against prior year and target on one chart, and exports it straight into the client’s quarterly service review. She keeps client names out of the workbook entirely and refers to sites by code.
Dan owns a small alarm and access-control business. He renamed six of the 14 KPIs to suit his trade, deleted two he does not measure, pressed Refresh, and had a working scorecard the same afternoon without ever opening the report editor.
❓ Frequently Asked Questions
Does this handle CCTV footage or make our surveillance compliant?
No — to both. The CCTV Installation KPI Dashboard in Power BI holds installation project records only. It never views, records, stores or analyses video, images or footage, it performs no facial recognition or video analytics, and it establishes no compliance with GDPR, the EU AI Act, the DPA 2018, BIPA, the Surveillance Camera Code or any installer licence.
What KPIs does this dashboard track?
It tracks 14 KPIs across 6 groups, including Cameras Installed, Install Hours per Camera, Cabling Rework Rate %, Commissioning First-Time Fix %, Camera Offline Hours, Recording Retention Compliance %, Storage Cost per Camera, Service Ticket Resolution Time, Revenue per Site and Technician Utilization %.
Can I add my own KPIs or delete the ones I do not use?
Yes. Nothing in the report hard-codes a KPI name. Add, rename or delete rows across the three input sheets — KPI Definition, Input_ Target and Input_ Actual — then press Home > Refresh. The cards, scorecard, slicer list and every chart follow automatically.
How long does setup take?
Under ten minutes if your numbers are already in a spreadsheet. Paste them into the three input sheets, keep the workbook beside the .pbix, and press Refresh. The included Power BI Dashboard user manual PDF covers repointing the data source if you move the folder.
Are the numbers in the screenshots real?
No. Every figure shown is realistic sample data shipped for demonstration, not real operational data from any installer. Replace it with your own before you show the report to anyone.
How does this compare to ServiceTitan or Jobber?
Those are field-service platforms for dispatch, scheduling and invoicing, and they cost $99–$400+ a month. The CCTV Installation KPI Dashboard in Power BI is a $12.99 one-time management report that scores your KPIs against target. They solve different problems, and many installers run both.
Do I need a paid Power BI licence?
No. Power BI Desktop is free from Microsoft and opens the .pbix directly. A Power BI Pro licence is only needed if you want to publish and share the report through the Power BI service.
👤 About the Author
Built by PK — Microsoft Certified Professional with 15+ years of Excel, Google Sheets and Power BI experience. Founder of NextGenTemplates, reaching 300K+ subscribers across YouTube channels (@PKAnExcelExpert, @NextGenTemplates, @NeoTechNavigators). Every template is hand-built and tested before release.
🔗 Explore Related Templates
Also available as: the same KPI pack ships as the CCTV Installation KPI Dashboard in Google Sheets if you would rather work in a browser, and as the lighter CCTV Installation KPI Scorecard in Google Sheets.
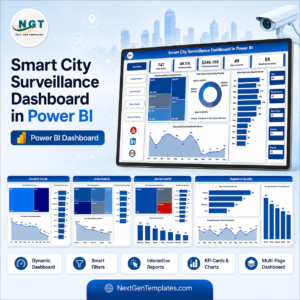
Adjacent trades and topics: Security System Installation KPI Dashboard in Google Sheets, the analytics-style Smart City Surveillance Dashboard in Power BI, and the Fire Safety Services KPI Dashboard in Power BI. Browse the full range of Power BI KPI Dashboards or every Power BI template we publish.
📖 Click here to read the Detailed Blog Post
🎥 Visit our YouTube channel for step-by-step video tutorials
👉 YouTube.com/@NextGenTemplates
📅 Last updated: September 2026