

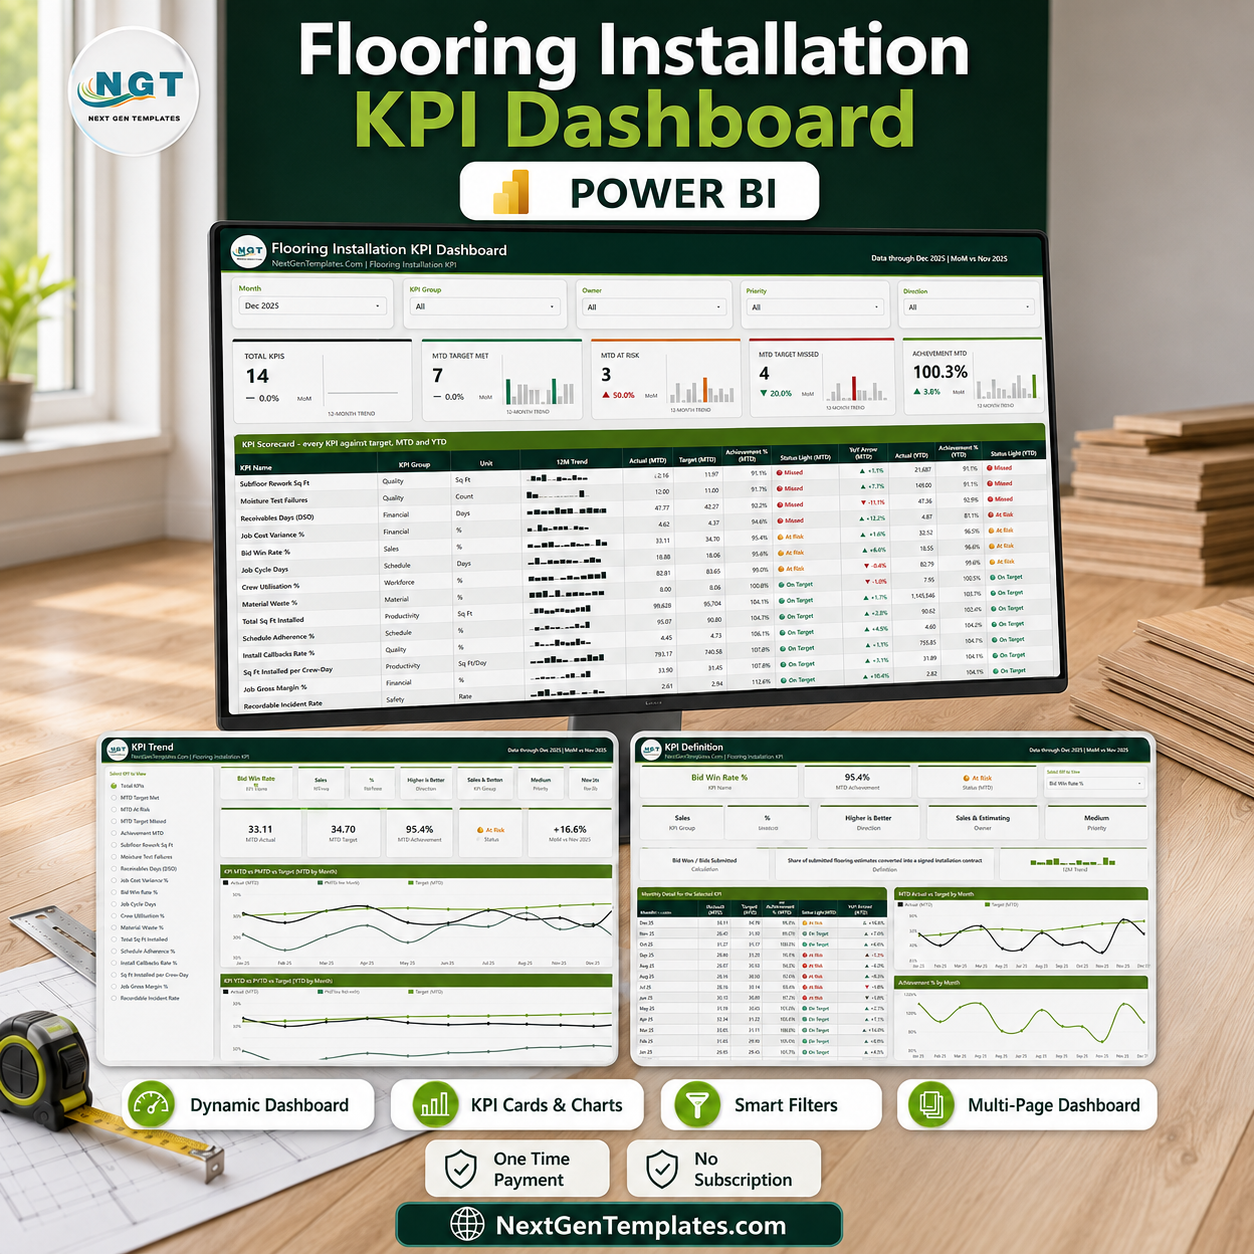
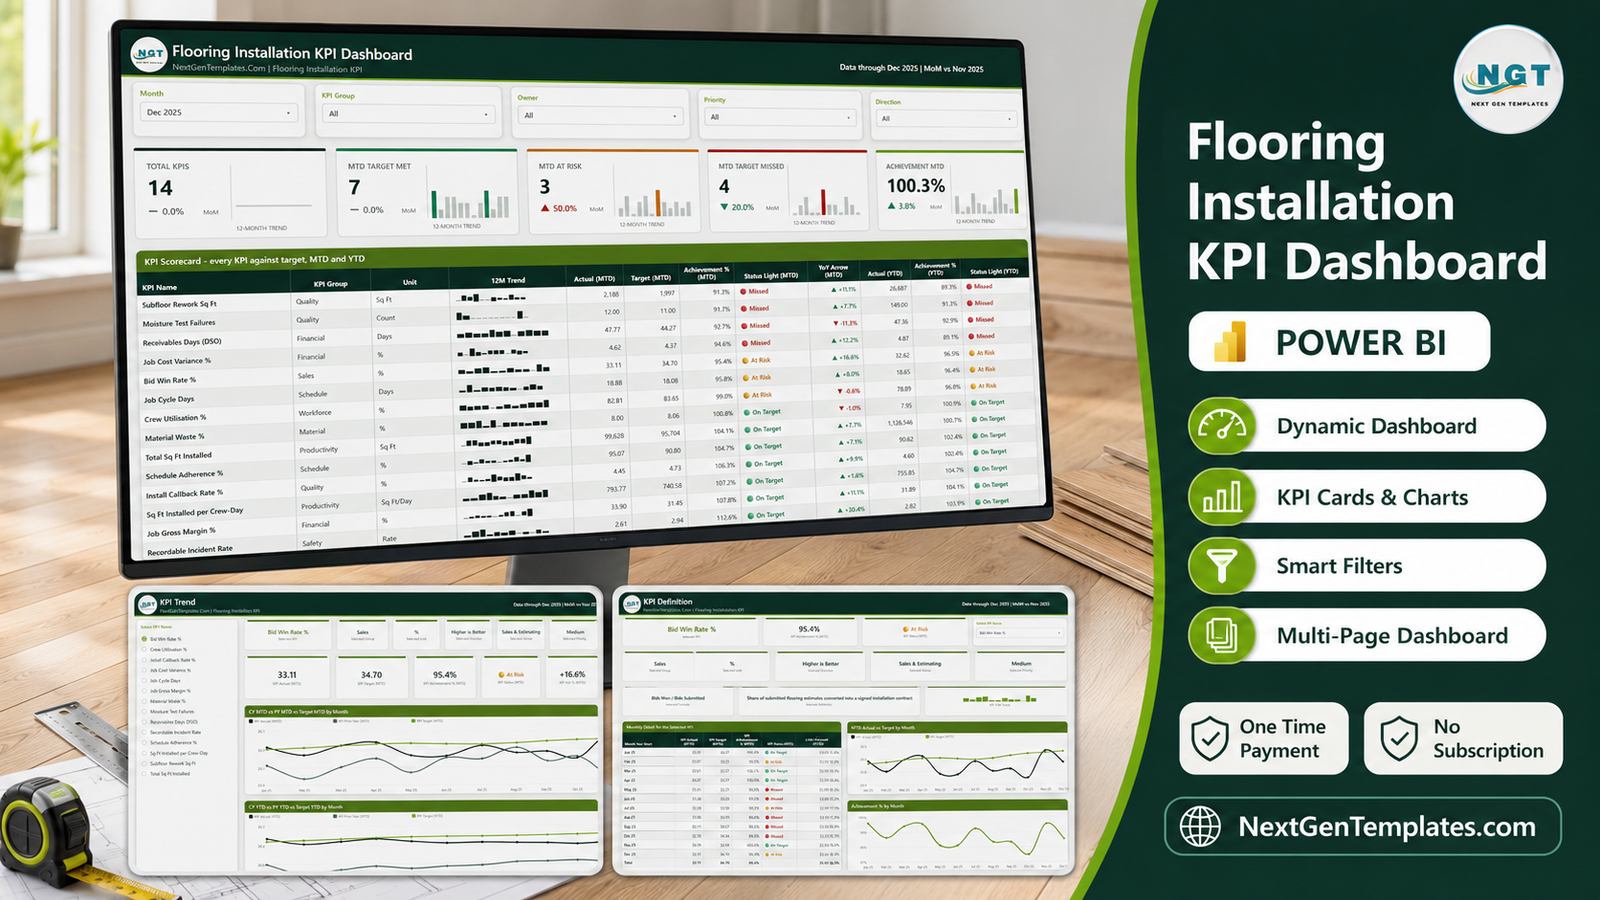

The Flooring Installation KPI Dashboard in Power BI is a ready-to-open .pbix report that scores 14 flooring-contractor KPIs against target every month, MTD and YTD, across 8 KPI groups – Productivity, Workforce, Material, Quality, Schedule, Financial, Sales and Safety. Four report pages, five synced slicers, more than 100 DAX measures, and twelve months of sample data plus the prior year already loaded. One file, one price, no subscription and no per-seat fee. Built by a Microsoft Certified Professional, hand-tested before release, and yours to edit – nothing in it is locked. Flooring Installation KPI Dashboard in Power BI
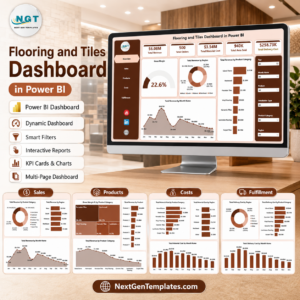
It is a KPI scorecard, not an analytics report. If you want charts that slice jobs, crews and products every which way, buy the Flooring and Tiles Dashboard in Power BI instead. This one answers a narrower question every month: which of my 14 numbers hit target, which are drifting, and who owns each one.
Key Features of the Flooring Installation KPI Dashboard in Power BI
- 14 flooring KPIs, target-scored – Sq Ft Installed per Crew-Day, Total Sq Ft Installed, Crew Utilisation %, Material Waste %, Subfloor Rework Sq Ft, Moisture Test Failures, Install Callback Rate %, Job Cycle Days, Schedule Adherence %, Job Cost Variance %, Job Gross Margin %, Bid Win Rate %, Receivables Days (DSO) and Recordable Incident Rate.
- Direction-aware scoring – 6 KPIs are higher-is-better and 8 are lower-is-better. Beat a waste, callback or cycle-time target and the achievement scores above 100% instead of punishing you for it.
- Three-state traffic lights – On Target at 100% or more, At Risk between 95% and 100%, Missed below 95%, shown separately for MTD and YTD on every row.
- Five synced slicers – Month, KPI Group, Owner, Priority and Direction. Slicer selections follow you from page to page, so a filter set on the scorecard is still set on the trend page.
- A 12-month sparkline per KPI right inside the scorecard table, so a single row tells you the level and the shape at once.
- Ownership and priority built in – every KPI carries an accountable owner (Field Operations, Scheduling, Site Supervision, Estimating, Finance, Customer Care, Project Management, Materials & Purchasing, Sales & Estimating, Safety & Compliance) and a Critical / High / Medium priority.
- Two hidden tooltip pages that pop the detail when you hover a scorecard row or a trend point – no extra clicks, no navigation.
- Native Power BI visuals only – nothing to install from AppSource, nothing that can break when a custom visual is retired.
- One custom theme file drives every colour on every page, so re-branding to your own palette is a single edit rather than a visual-by-visual crawl.
What’s Inside the Flooring Installation KPI Dashboard in Power BI
The download is a single ZIP holding three files: the .pbix report, the Data.xlsx workbook it reads from, and a Power BI Dashboard User Manual PDF.
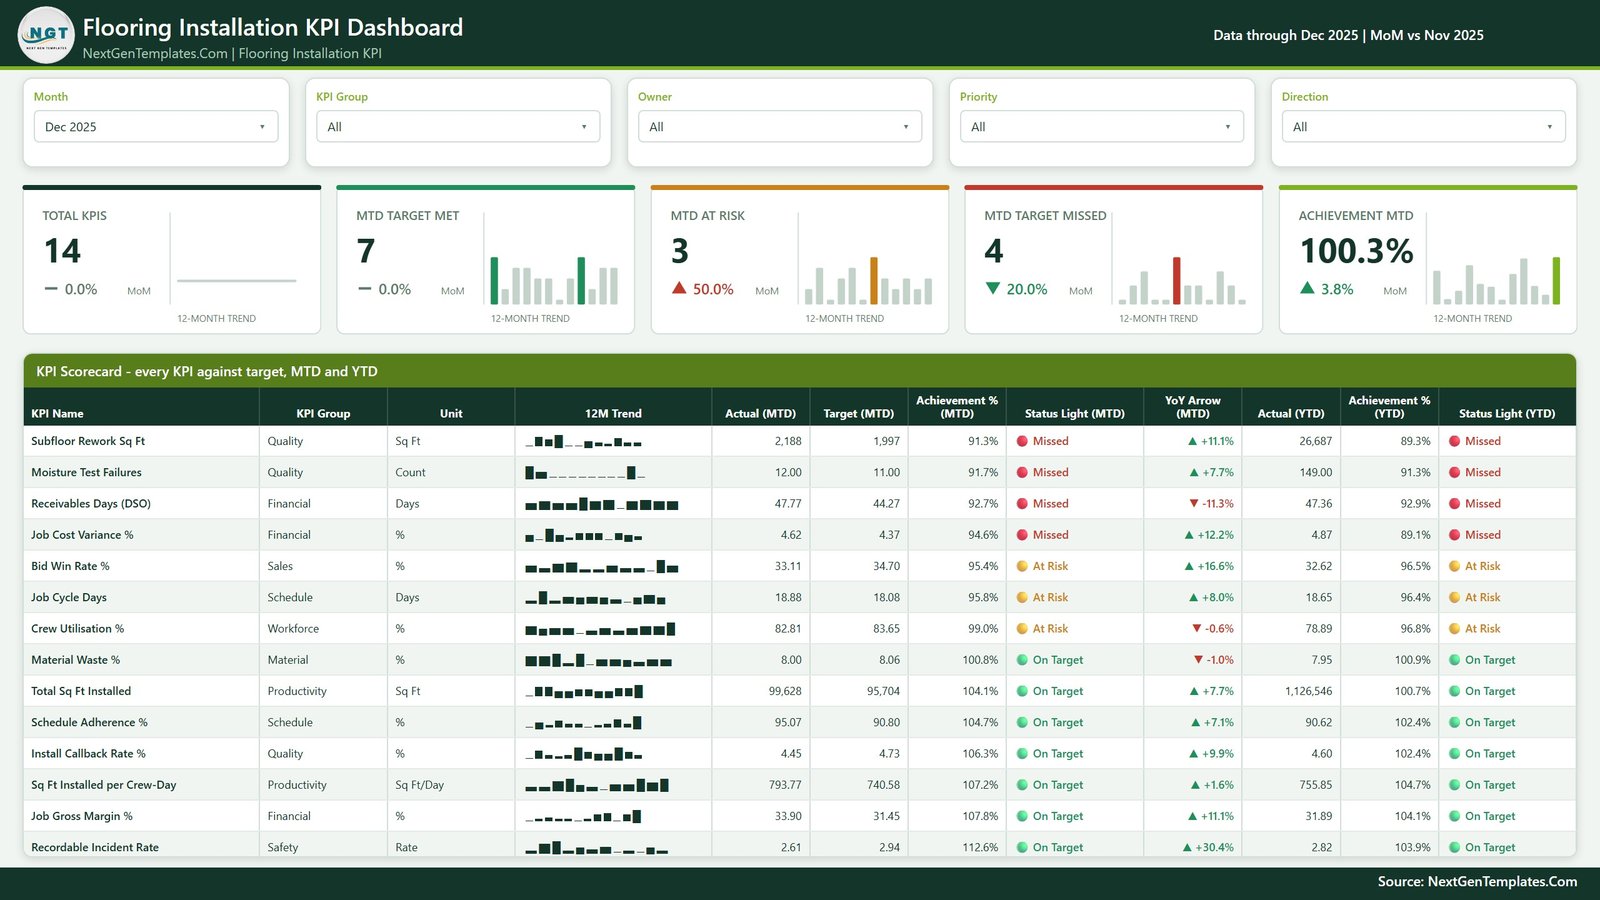
KPI Scorecard
The landing page. Five summary cards – Total KPIs, MTD Target Met, MTD At Risk, MTD Target Missed and Achievement MTD – each with a month-on-month delta and a 12-month bar trend, sitting above the full scorecard table. Every KPI shows its group, unit, sparkline, MTD actual, MTD target, MTD achievement %, MTD status light, a year-on-year arrow, then YTD actual, YTD achievement % and YTD status light. In the sample month (Dec 2025) 7 KPIs are on target, 3 at risk and 4 missed, at 100.3% overall achievement.
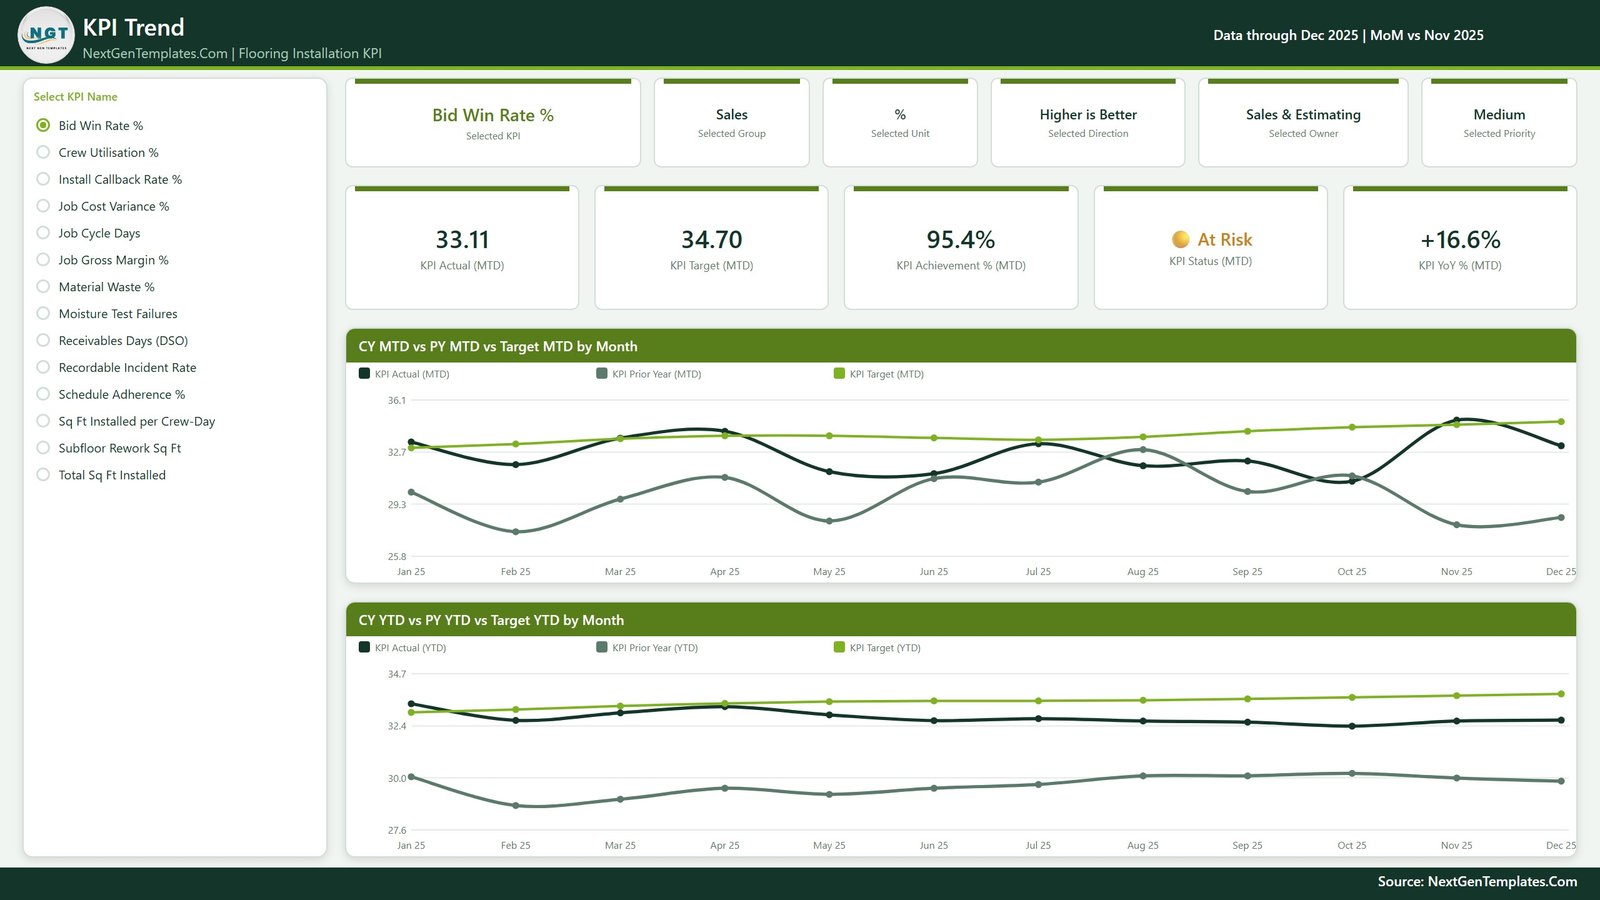
KPI Trend
Pick one KPI from the list on the left and the whole page becomes that KPI. Six context cards restate its group, unit, direction, owner and priority so you are never reading a number without knowing what it means, then five value cards give actual, target, achievement, status and year-on-year change. Below them, CY MTD vs PY MTD vs Target MTD by Month and CY YTD vs PY YTD vs Target YTD by Month plot this year against last year against target across all twelve months.
KPI Definition
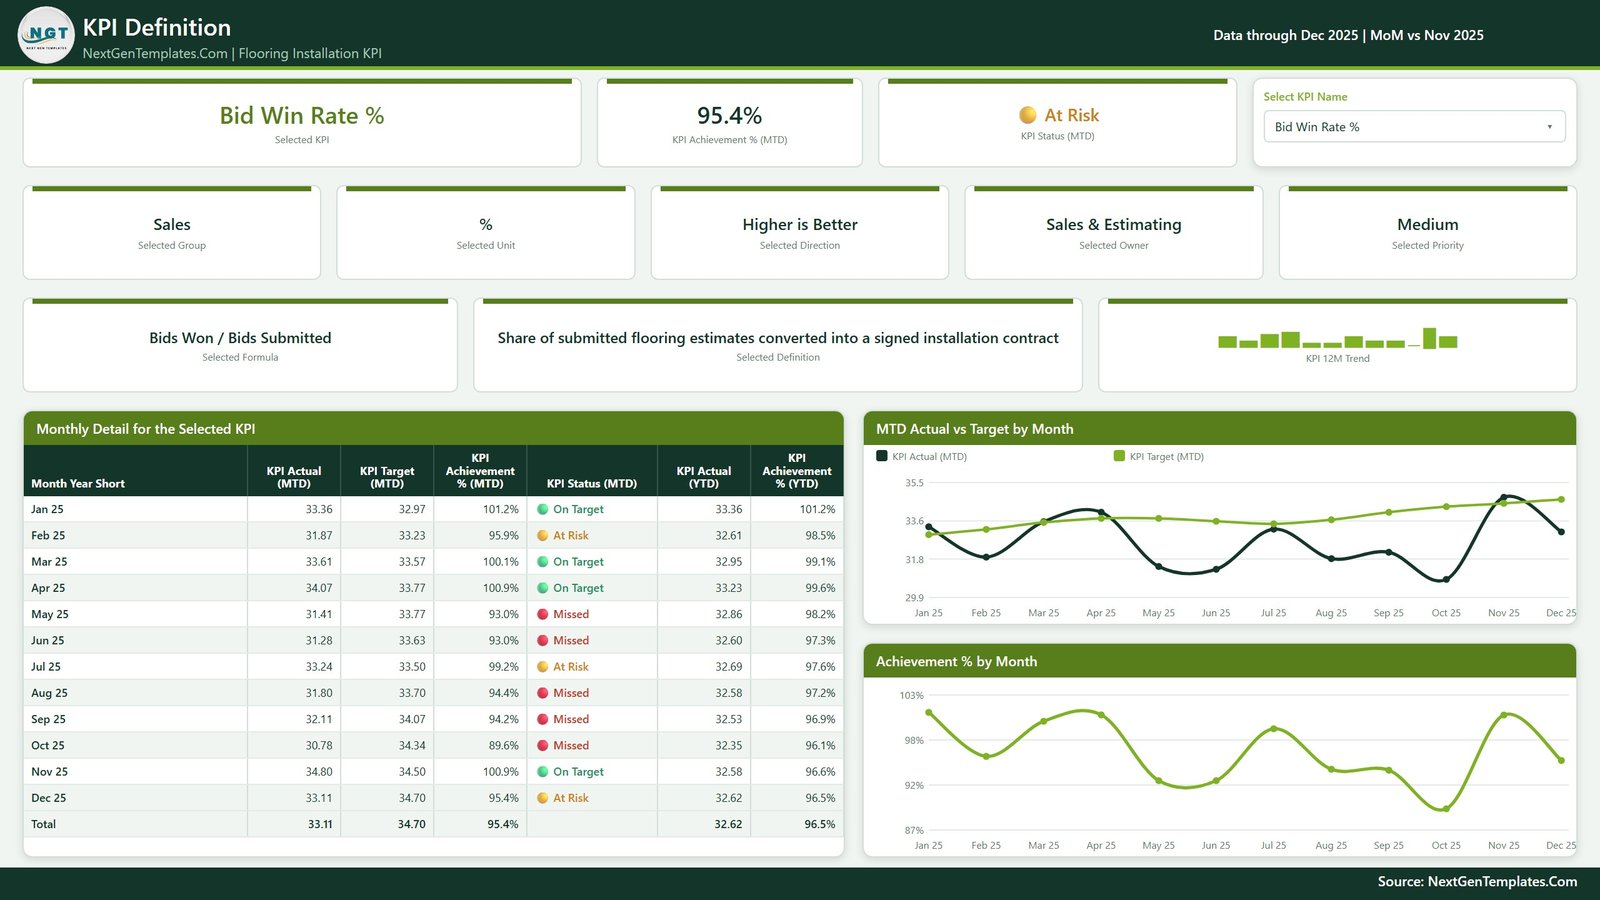
The page that stops the arguments. For the selected KPI it prints the formula and the plain-English definition alongside the owner, priority and direction, then a month-by-month table of actual, target, achievement % and status for all twelve months, plus MTD Actual vs Target by Month and Achievement % by Month charts. The KPI slicer here is synced with the trend page, so choosing a KPI on one page selects it on the other.
Get More Templates
A fourth page inside the report listing other NextGenTemplates Power BI dashboards and a short customising guide. It is a catalogue page, not a data page – delete it in five seconds if you are sharing the file internally. Flooring Installation KPI Dashboard in Power BI
Data.xlsx
Four sheets: a Read Me, KPI Definition (one row per KPI – group, unit, formula, definition, direction, owner, priority), Input_ Target (168 rows: 14 KPIs x 12 months of MTD and YTD targets) and Input_ Actual (336 rows: the same for the reporting year and the year before it). Nothing in the report hard-codes a KPI name. Add a row, rename a KPI, delete one, then press Home > Refresh and the cards, the scorecard, the KPI list and every chart follow.
Power BI vs. Tableau or Qlik vs. Paid Contractor SaaS – Where This Fits
| This Power BI template | Tableau / Qlik build | Procore, ServiceTitan, RFMS | |
|---|---|---|---|
| Cost | One payment, this page | Licence plus build time | Per-user monthly subscription |
| Platform | Power BI Desktop (free) | Tableau Desktop / Qlik Sense | Vendor cloud |
| Setup time | Open it, swap the Excel data, refresh | Model and design from scratch | Onboarding and data migration |
| Real-time team collaboration | No – refresh on demand | Via paid server | Yes |
| Mobile access | Only if you publish it to your own workspace | Via paid server | Native apps |
| Customizable fields | Every KPI, group, owner and target | Yes, if you build it | Limited to vendor fields |
| Share with link | Send the file, or publish it yourself | Server link | Account invite |
| Year-1 cost at 5 users | The price on this page | Licences plus consultant days | Typically four figures and up |
| Direction-aware KPI scoring | Built in for all 14 KPIs | You write the logic | Fixed vendor metrics |
| Owns your operational data | You do – it stays in your files | You do | The vendor hosts it |
Who This Template Is For – and Who It’s Not For
It fits flooring installation contractors running 5-60 crews who already keep job, crew and cost numbers somewhere and want one monthly page that scores them; operations managers who report to an owner or a private-equity backer every month; and Power BI users who would rather adapt a finished model than build one.
It does not fit if you want any of the following, and it is cheaper to say so now than to refund you later. It is not estimating, takeoff or job-costing software. It has no connector to QuickBooks, Sage, Procore, ServiceTitan, RFMS or Measure Square – you export or type your monthly numbers into the Excel workbook. It is not a scheduling or crew-dispatch system. It does not read moisture meters: Moisture Test Failures is a count you enter, and the report performs no ASTM F2170 test and validates nothing about your subfloor. Recordable Incident Rate is likewise a number you type – the report does not maintain an OSHA 300 or 300A log, is not a safety management system, and evidences no compliance with anything. There is no benchmark data: your targets are the targets you set. And it is not real-time – it shows what was in the workbook the last time you pressed Refresh. Flooring Installation KPI Dashboard in Power BI
How to Use the Flooring Installation KPI Dashboard in Power BI
- Unzip all three files into one folder and keep them together – the report reads the workbook by path.
- Open the
.pbixin Power BI Desktop (free from Microsoft). - Open
Data.xlsxand edit the KPI Definition sheet first: keep the 14 KPIs, rename them, or add your own. Type is the only fixed column – UTB for higher-is-better, LTB for lower-is-better. - Fill Input_ Target and Input_ Actual, one row per KPI per month, for this year and last year. For rates and ratios, make YTD the average of the months so far, never the sum.
- Back in Power BI, press Home > Refresh. If you moved the files, repoint them in Transform data > Data source settings.
- Pick a month on the scorecard, then use the KPI Group, Owner, Priority and Direction slicers to run the review by team.
- Click a KPI on KPI Trend to see its twelve-month story, and the same KPI stays selected when you move to KPI Definition.
Real-World Use Cases
Marcus, operations manager at a 30-crew commercial flooring contractor. His monthly review used to be a spreadsheet emailed the night before. He now opens the scorecard on Dec 2025, filters Priority to Critical, and walks his supervisors through the five KPIs that actually decide the bonus pool – Material Waste %, Install Callback Rate %, Job Cost Variance %, Job Gross Margin % and Moisture Test Failures.
Rina, finance lead at a residential flooring installer. She filters Owner to Finance and reviews only Job Gross Margin % and Receivables Days (DSO). When DSO reads 47.77 days against a 44.27 target, she opens KPI Definition and shows the collections team the month-by-month table rather than arguing about a single bad month.
Dev, a Power BI consultant. He keeps this as a starting model for trade-contractor clients: swap the 14 KPI rows, keep the direction-aware achievement measures, the traffic lights and the synced slicers, and a client scorecard is a day’s work instead of a week’s.
Frequently Asked Questions
Do I need a Power BI licence?
No. Power BI Desktop is free from Microsoft and opens the file. A Pro or Premium licence is only needed if you want to publish the report and share it through the Power BI Service.
Is there a drillthrough page?
No, and that is deliberate. This build has no drillthrough definitions at all. KPI Definition is reached by picking a KPI from the slicer, which is synced with the KPI Trend page – so do not go hunting for a right-click menu. Two hidden tooltip pages do give hover detail on the scorecard and trend visuals.
Can I change the 14 KPIs to my own?
Yes. Every visual is driven by the rows in Data.xlsx. Rename a KPI in all three sheets, add one, or delete one, then refresh. Nothing hard-codes a KPI name.
Why do some KPIs score above 100%?
Because achievement is direction-aware. A lower-is-better KPI scores target divided by actual, so beating a waste or cycle-time target lands above 100%. Recordable Incident Rate at 2.61 against a 2.94 target reads 112.6% for exactly that reason.
Are the numbers in the file real?
No. They are realistic sample values for Jan-Dec 2025 plus the prior year, built to demonstrate the model. Replace them with yours. Flooring Installation KPI Dashboard in Power BI
How is this different from the Flooring Installation KPI Scorecard?
The Excel scorecard is a ten-KPI workbook with a different page set. This is the Power BI KPI dashboard line – 14 KPIs, a DAX model, synced slicers and tooltip pages. They are companions, not two copies of one product.
Is there an Excel version of this exact dashboard?
Yes – the Flooring Installation KPI Dashboard in Excel covers the same subject in a workbook. Its KPI list is not identical to this one, so check both if the exact metrics matter to you.
About the Author
Built by PK – Microsoft Certified Professional with 15+ years of Excel, Google Sheets, and Power BI experience. Founder of NextGenTemplates, reaching 300K+ subscribers across YouTube channels. Every template is hand-built and tested before release.
Explore Related Templates
- Flooring and Tiles Dashboard in Power BI – the analytical report, if you want to slice rather than score.
- Flooring and Tiles KPI Dashboard in Power BI – the retail and supply side of the same trade.
- Electrical Contractor KPI Dashboard in Power BI and Plumbing Business KPI Dashboard in Power BI – the same scorecard pattern for the other trades.
- Carpet and Flooring Business Management System Web App – if you need to run the jobs, not just report on them.
- Browse more in Power BI and KPI Dashboard.
Buy it once, own it forever. Instant download, lifetime access to the file you buy, and every visual editable. Add it to your cart above and open your first scorecard in the next ten minutes. Flooring Installation KPI Dashboard in Power BI
Last updated: 29 August 2026.






























Reviews
There are no reviews yet.