

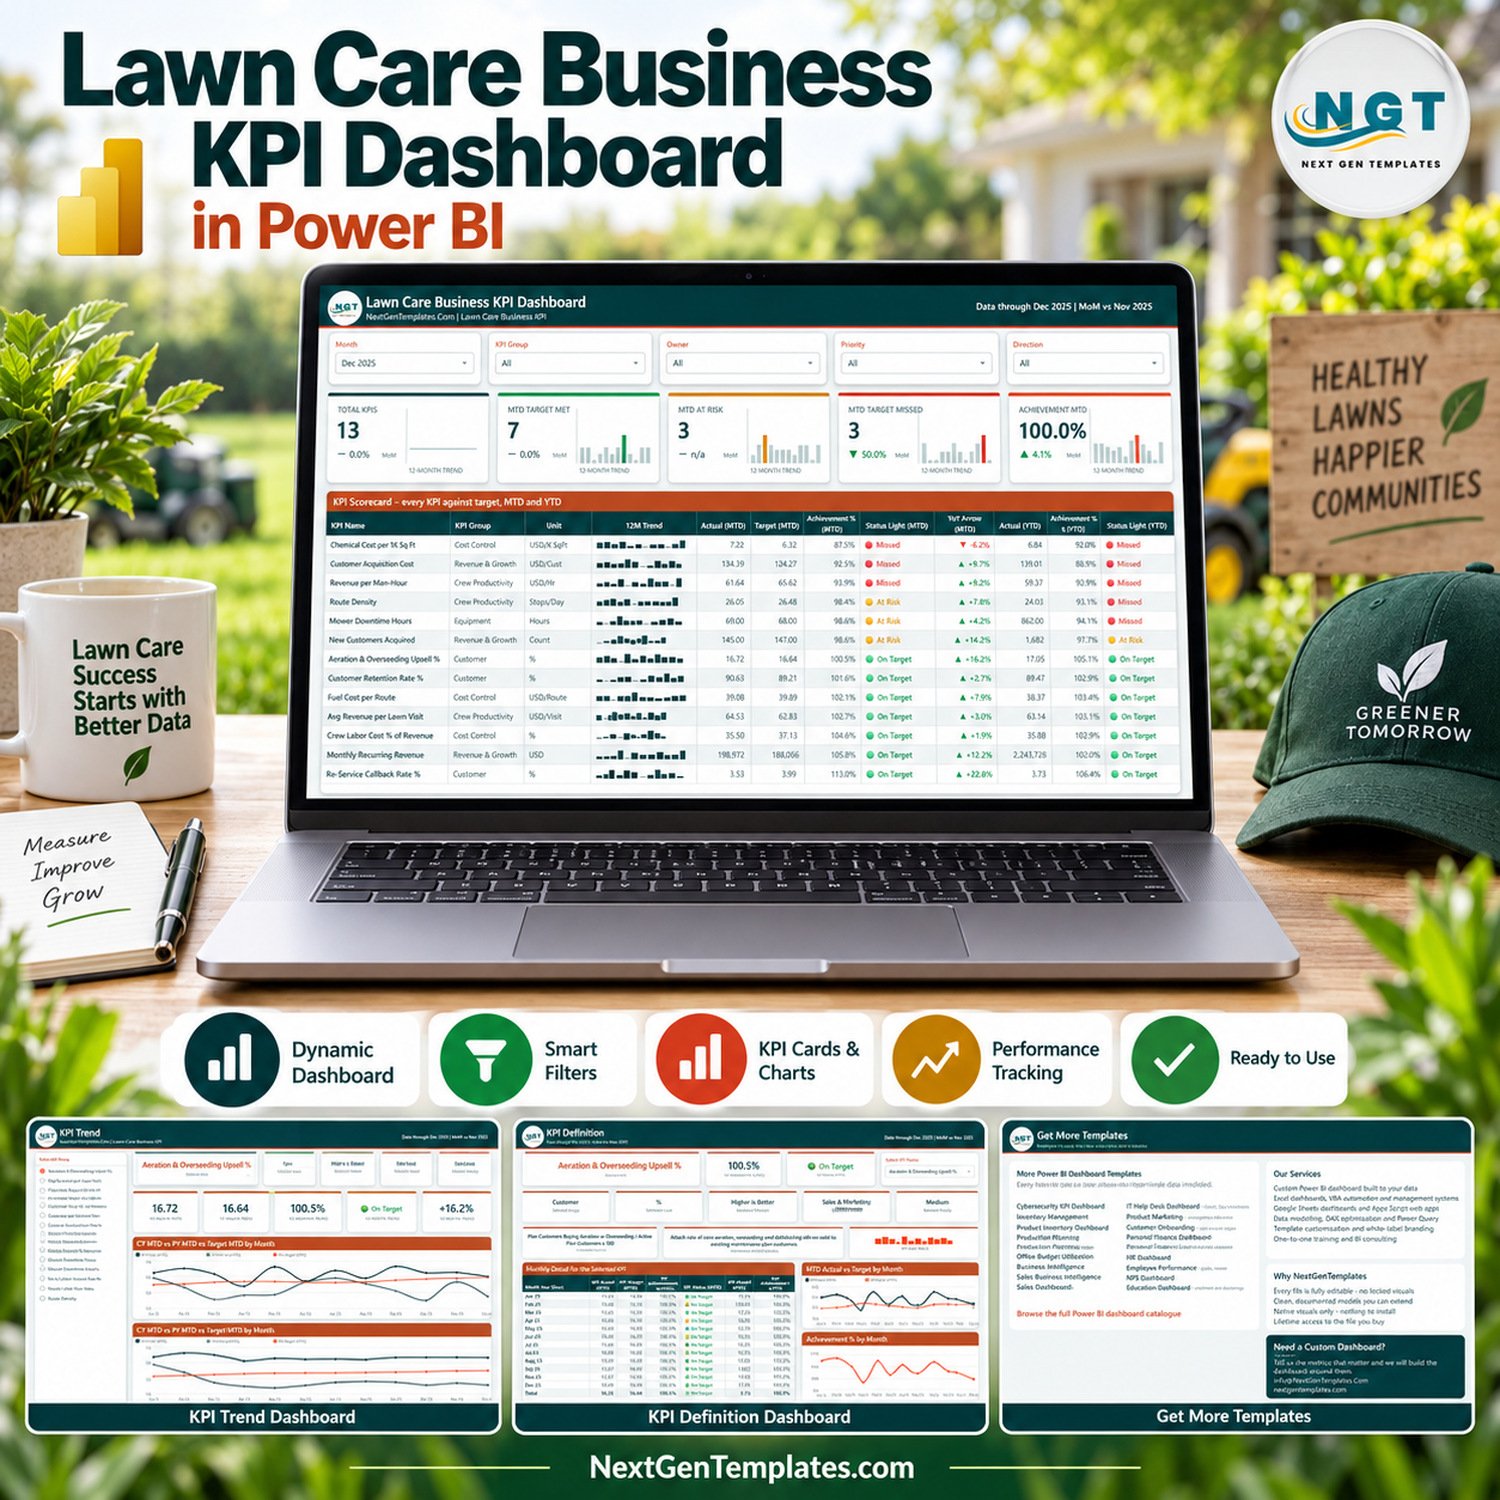
The Lawn Care Business KPI Dashboard in Power BI tracks 13 lawn care metrics across 4 report pages, grouped into 5 KPI groups — Cost Control, Revenue & Growth, Crew Productivity, Equipment and Customer. Five slicers (Month, KPI Group, Owner, Priority, Direction) drive every visual, and the sample month shipped in the file closes December 2025 with 7 KPIs on target, 3 at risk and 3 missed.
🌍 Join 8,400+ teams in 40+ countries using NextGenTemplates to replace paid SaaS tools with one-time-purchase Excel, Google Sheets, Power BI and HTML templates.
✅ Instant download · One-time payment · No subscription · No per-user fees · Lifetime access
This is the KPI-scorecard edition of our lawn care reporting line, not the analytical Landscaping dashboards. It answers one question every month: which numbers hit target, which slipped, and by how much against last year. It ships with fictional sample data so you can see every visual working before you point it at your own figures.
🔑 Key Features of the Lawn Care Business KPI Dashboard in Power BI
🎯 13 KPIs on one scorecard. Chemical Cost per 1K Sq Ft, Customer Acquisition Cost, Revenue per Man-Hour, Route Density, Mower Downtime Hours, New Customers Acquired, Aeration & Overseeding Upsell %, Customer Retention Rate %, Fuel Cost per Route, Avg Revenue per Lawn Visit, Crew Labor Cost % of Revenue, Monthly Recurring Revenue and Re-Service Callback Rate %. Each carries its own unit, owner, priority and direction.
🚦 Traffic lights on both MTD and YTD. Every row shows a Status Light (MTD) and a Status Light (YTD) — On Target, At Risk or Missed — so a KPI that looks fine this month but is drifting over the year cannot hide.
↕️ Direction-aware scoring. KPIs are tagged Higher is Better or Lower is Better, and the achievement maths flips accordingly. Lower-is-better metrics such as Chemical Cost per 1K Sq Ft and Fuel Cost per Route score above 100% when they beat target, so you never have to mentally invert a column.
📉 Year-on-year arrows. A YoY Arrow (MTD) column puts the current month beside the same month last year, with the percentage change and a coloured arrow on every one of the 13 rows.
📈 Twelve-month sparklines everywhere. The five header cards and the 12M Trend column each carry a full-year sparkline that stays on the whole year even when you filter the scorecard to a single month.
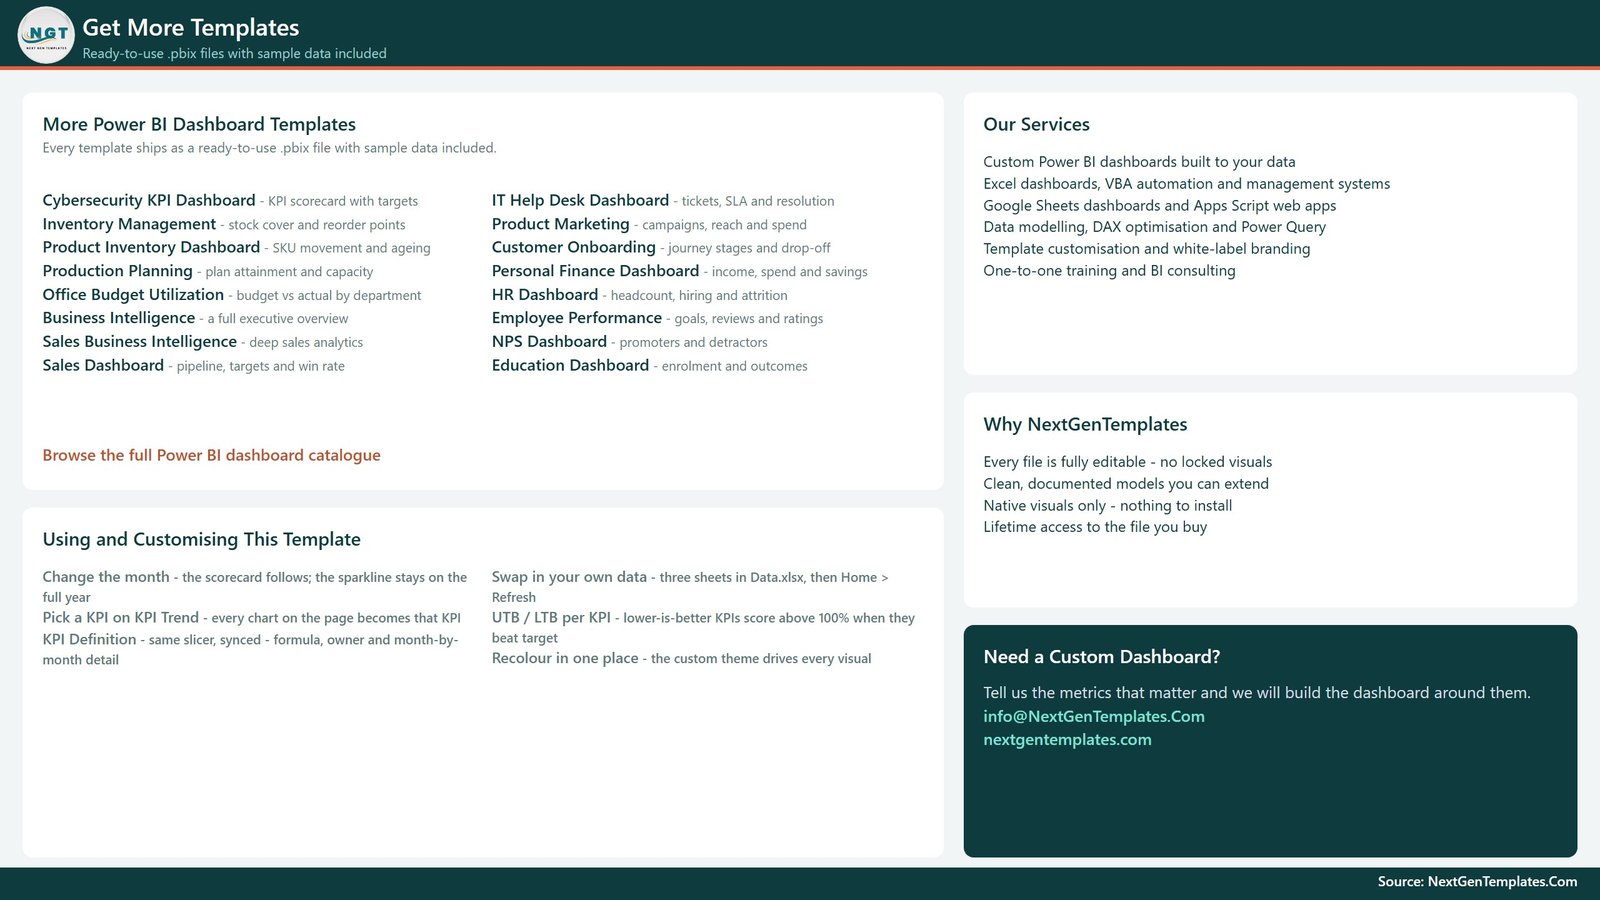
🎨 One theme file drives every visual. Recolour the custom Power BI theme once and all four pages follow. Native visuals only — nothing to install, nothing locked, no custom visual licence to renew.
📦 What’s Inside the Lawn Care Business KPI Scorecard
The download is a ZIP holding three files: the .pbix report, the Data.xlsx workbook that feeds it (three sheets), and a Power BI Dashboard – User Manual.pdf. Four report pages ship inside the .pbix:
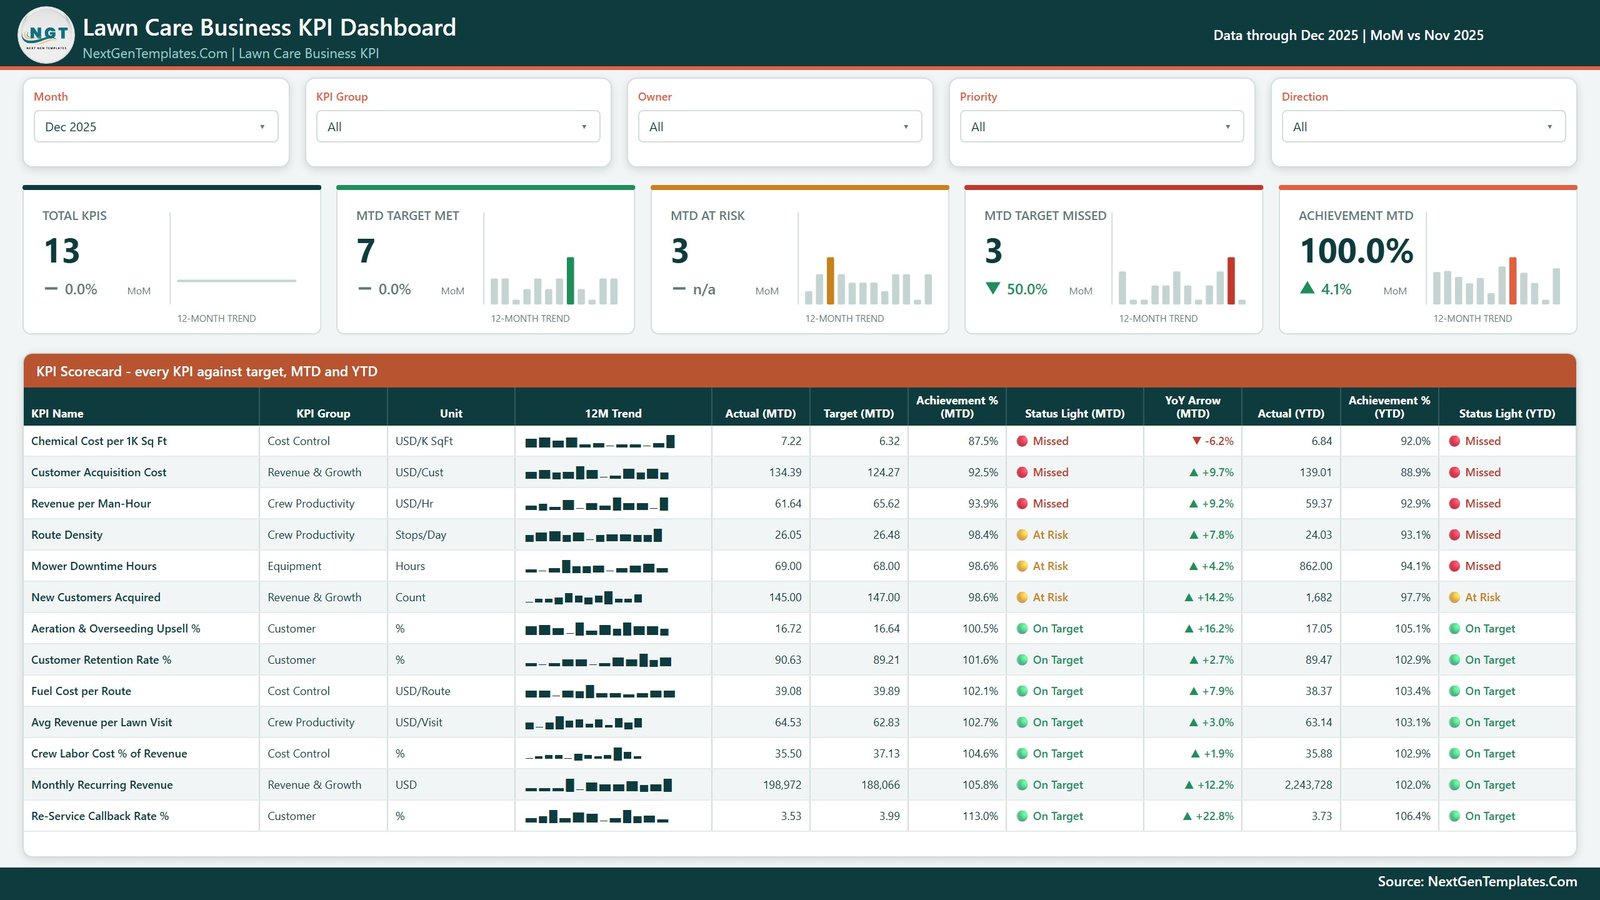
Page 1: Lawn Care Business KPI Dashboard
The monthly scorecard. Five slicers across the top — Month, KPI Group, Owner, Priority and Direction — then five header cards: Total KPIs, MTD Target Met, MTD At Risk, MTD Target Missed and Achievement MTD, each with a MoM change and a 12-month trend sparkline. Below them the KPI Scorecard table lists all 13 KPIs with KPI Group, Unit, 12M Trend, Actual (MTD), Target (MTD), Achievement % (MTD), Status Light (MTD), YoY Arrow (MTD), Actual (YTD), Achievement % (YTD) and Status Light (YTD).
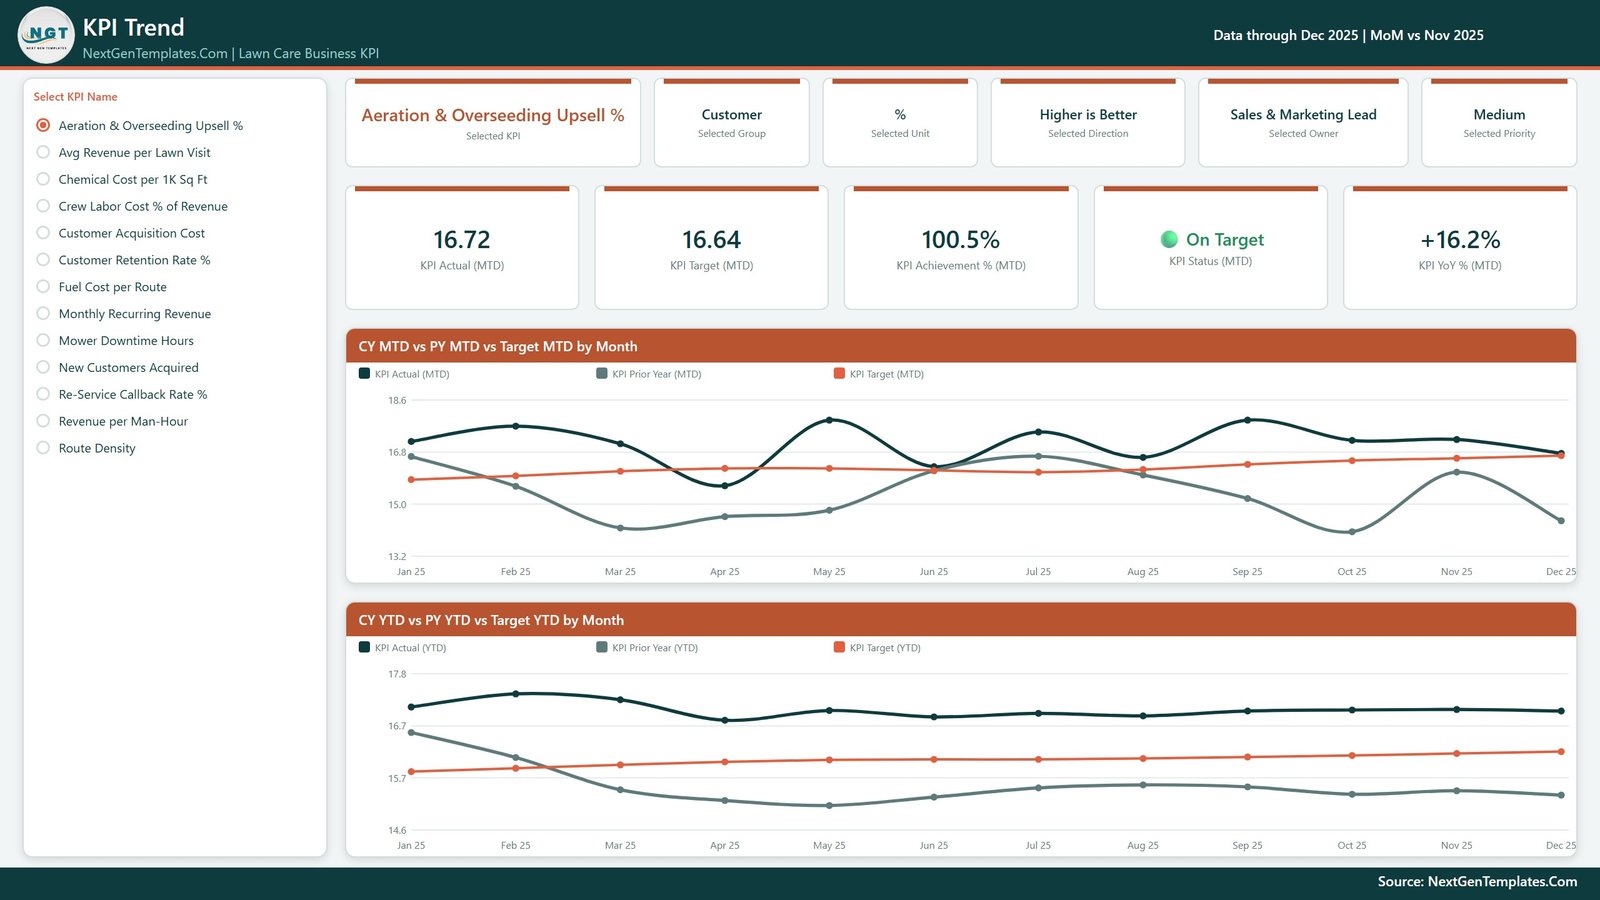
Page 2: KPI Trend
Pick one KPI from the radio list on the left and the whole page becomes that KPI. Six context cards show Selected KPI, Selected Group, Selected Unit, Selected Direction, Selected Owner and Selected Priority; five value cards show KPI Actual (MTD), KPI Target (MTD), KPI Achievement % (MTD), KPI Status (MTD) and KPI YoY % (MTD). Two line charts sit underneath: CY MTD vs PY MTD vs Target MTD by Month, and CY YTD vs PY YTD vs Target YTD by Month.
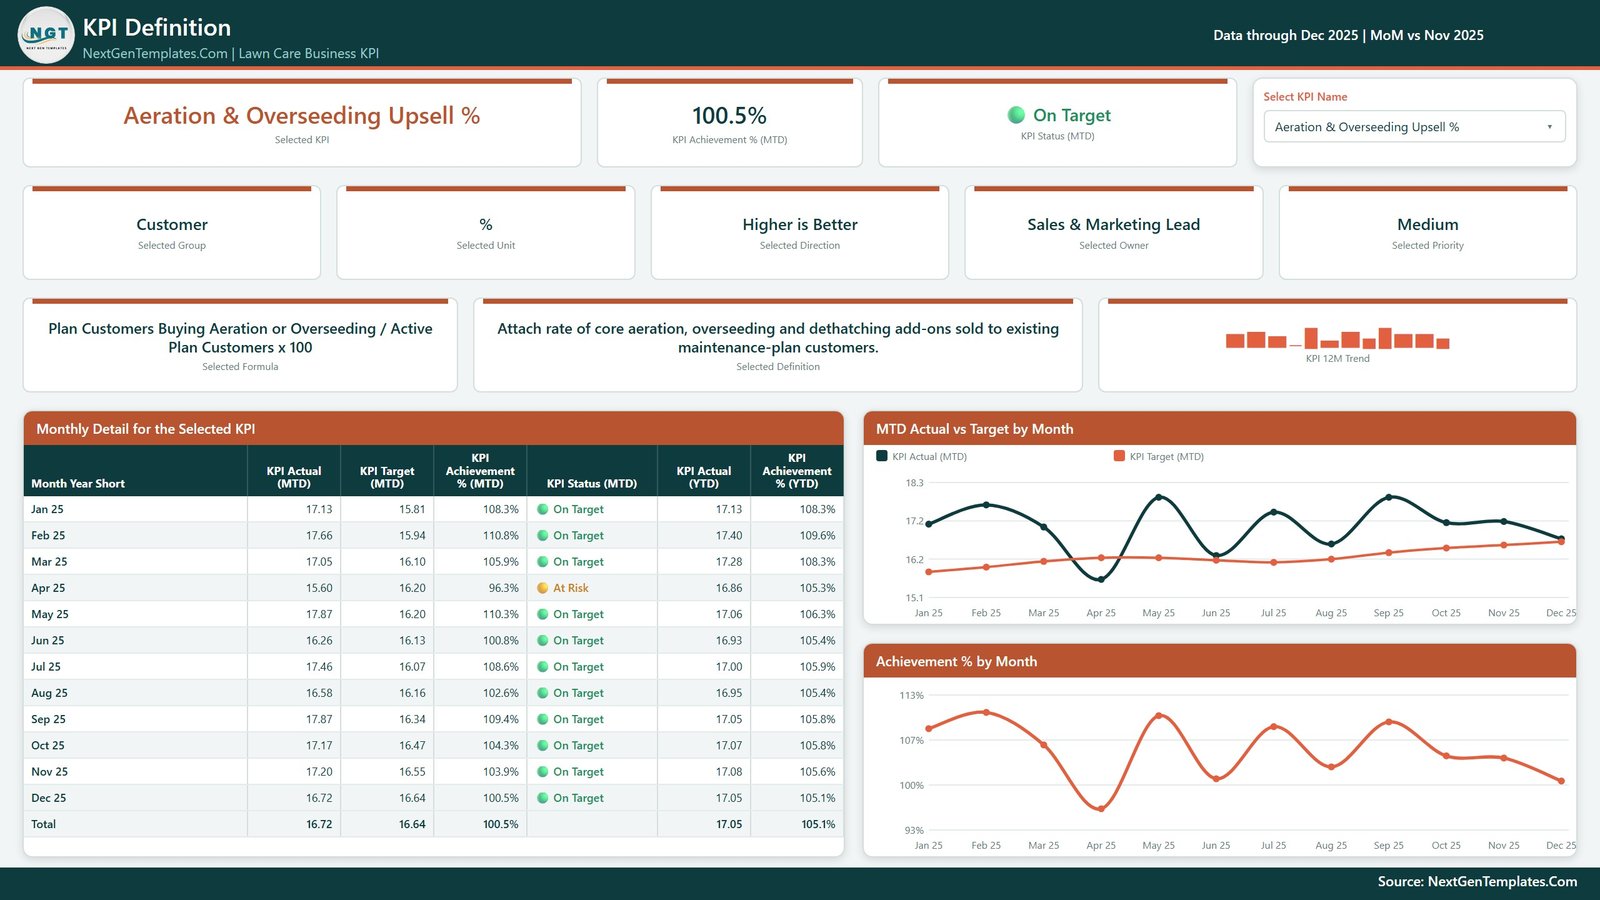
Page 3: KPI Definition
The documentation page, synced to the same KPI selection. It shows the Selected Formula and Selected Definition in plain English — for Aeration & Overseeding Upsell % that is “Plan Customers Buying Aeration or Overseeding / Active Plan Customers x 100” — plus a 12M trend, a Monthly Detail table with Actual, Target, Achievement % and Status for all twelve months on both MTD and YTD, and two charts: MTD Actual vs Target by Month and Achievement % by Month.
Page 4: Get More Templates
A reference page listing the wider Power BI catalogue, our services, and a short “Using and Customising This Template” guide covering how to change the month, swap in your own data through the three sheets in Data.xlsx and refresh, how UTB/LTB scoring works per KPI, and where to recolour the theme.
📊 Power BI Scorecard vs. Tableau / Qlik vs. Paid Field-Service SaaS — Where This Fits
| Feature | This Power BI Scorecard | Tableau / Qlik build | Jobber / ServiceTitan reporting |
|---|---|---|---|
| Cost | $19.99 one-time | $70–$115 / user / month | $49–$400 / month per company |
| Platform | Power BI Desktop (free) | Tableau Desktop / Qlik Sense licence | Vendor web app only |
| Setup time | Under 15 minutes — swap Data.xlsx, refresh | Days of modelling | Full platform migration |
| KPIs pre-built | ✅ 13, with targets and definitions | ❌ Build every measure yourself | Fixed vendor metric set |
| Owner / priority per KPI | ✅ Built in | ❌ Custom work | Rarely exposed |
| Lower-is-better handling | ✅ Automatic UTB/LTB | ❌ Hand-coded | ❌ Not configurable |
| Editable model | ✅ Fully open .pbix | ✅ But licence-bound | ❌ Closed |
| Works with your existing data | ✅ Any source Power Query reads | ✅ | ❌ Only data already in the platform |
| Year-1 cost at 5 users | $19.99 | $4,200–$6,900 | $1,200–$4,800 |
For lawn care operators who want a board-ready monthly scorecard without a BI licence or a platform migration, the Lawn Care Business KPI Dashboard in Power BI sits in the sweet spot.
👥 Who This Template Is For — and Who It’s Not For
✅ Built for:
- Owner-operators and general managers of lawn care and landscape maintenance firms running 2–40 crews
- Franchise and multi-branch operators who already export monthly figures and want one consistent scorecard across branches
- Operations or finance leads who present a monthly KPI pack to owners or investors
- Power BI users who want a working model to learn UTB/LTB scoring, sparklines and synced slicers from
❌ Not for you if:
- You want live scheduling, dispatch or route optimisation — this file connects to no field-service system such as Jobber, ServiceTitan or Yardbook, and does no routing
- You need invoicing, payments or payroll — it does not invoice and holds no customer records
- You want weather or radar integration to move jobs — there is none
- You need real-time data — this is a monthly management scorecard refreshed from a workbook, not a live feed
- You want chemical-application compliance records for state reporting — Chemical Cost per 1K Sq Ft is a cost metric, not an application log
⚙️ How to Use It
- Unzip the download and open the .pbix in Power BI Desktop, free from Microsoft.
- Read the included Power BI Dashboard – User Manual.pdf — it walks through the model and the pages.
- Open Data.xlsx and replace the sample rows in its three sheets with your own months, actuals and targets.
- Back in Power BI Desktop, click Home > Refresh. All four pages update.
- Rename or re-target KPIs in the data, and set each one’s direction to Higher is Better or Lower is Better so scoring flips correctly.
- Use the Month slicer to publish a monthly pack; the sparklines stay on the full year.
- Recolour once in the custom theme if you want the dashboard in your own brand colours.
💼 Real-World Use Cases
Marcus runs a 6-crew lawn care company in Georgia. Each month he drops his figures into Data.xlsx, hits refresh, and prints the scorecard page. Last quarter the YoY arrows showed Customer Acquisition Cost up 9.7% while New Customers Acquired sat below target — a combination his spreadsheet had never surfaced side by side, and which sent him back to his lead sources.
Priya is operations director for a landscape group with four branches. She keeps one file per branch and uses the Owner slicer to filter the scorecard to each branch manager before their monthly review, so every manager sees only the KPIs they actually own.
Dan is a Power BI analyst at a franchise head office. He bought the file to lift the UTB/LTB achievement pattern and the synced KPI-selection design straight into a larger model, rather than writing the direction-aware DAX from scratch.
❓ Frequently Asked Questions
What KPIs does this lawn care KPI dashboard track?
It tracks 13 KPIs in five groups: Chemical Cost per 1K Sq Ft, Fuel Cost per Route and Crew Labor Cost % of Revenue (Cost Control); Customer Acquisition Cost, New Customers Acquired and Monthly Recurring Revenue (Revenue & Growth); Revenue per Man-Hour, Route Density and Avg Revenue per Lawn Visit (Crew Productivity); Mower Downtime Hours (Equipment); and Aeration & Overseeding Upsell %, Customer Retention Rate % and Re-Service Callback Rate % (Customer).
Do I need a paid Power BI licence?
No. Power BI Desktop is free from Microsoft and opens the .pbix, refreshes it and lets you edit every visual. A Power BI Pro licence is only needed if you want to publish the report to the Power BI Service and share it online with colleagues.
How long does setup take?
Under 15 minutes for most users. Open Data.xlsx, paste your months, actuals and targets over the sample rows in the three sheets, keep the column headers, then click Home > Refresh in Power BI Desktop. All four pages repopulate from your numbers.
Does it connect to Jobber, ServiceTitan or Yardbook?
No. There is no integration with any field-service, scheduling or invoicing platform. It reads the bundled Data.xlsx, so you export your monthly figures from whatever system you use and paste them in. Because it is a plain Power Query source, an analyst can repoint it at a database or API later.
How is this different from the Landscaping dashboards you sell?
The Landscaping Dashboard in Power BI is an analytical dashboard — it slices jobs, revenue and customers to explore what happened. The Lawn Care Business KPI Dashboard in Power BI is a scorecard instead: fixed KPIs, fixed targets, traffic lights and a monthly verdict. Many operators run both.
Can I add or remove KPIs?
Yes. The 13 KPIs live as rows in Data.xlsx, not as hard-coded visuals, so adding a row adds a KPI everywhere — the scorecard, the KPI Trend selector and the KPI Definition page. Give each new KPI a group, unit, owner, priority, direction, formula and definition and the whole power bi kpi dashboard template picks it up on refresh.
Is the data in the file real?
No. The .pbix ships with fictional sample data through December 2025 so every card, chart and traffic light renders before you connect your own figures. Nothing in it reflects a real lawn care company.
👤 About the Author
Built by PK — Microsoft Certified Professional with 15+ years of Excel, Google Sheets and Power BI experience. Founder of NextGenTemplates, reaching 300K+ subscribers across YouTube channels (@PKAnExcelExpert, @NextGenTemplates). Every template is hand-built and tested before release. Power BI Desktop itself is documented by Microsoft at Microsoft Learn.
🔗 Explore Related Templates
Also available as: the same monthly scorecard is published for Google Sheets as the Lawn Care Business KPI Dashboard in Google Sheets, and a sister build ships as the Lawn Care Business KPI Scorecard in Google Sheets. Excel editions of both are in preparation (product IDs 95408 and 95917) and will be linked here once live.
🌳 Tree Care Services KPI Dashboard in Power BI — the same scorecard design as the Lawn Care Business KPI Dashboard in Power BI, rebuilt for arborist and tree-care crews.
🏡 Landscaping Services Dashboard in Power BI — job-level analytics rather than a monthly scorecard.
📂 Browse the full range of Power BI Dashboard Templates.
📖 Click here to read the detailed blog post
🎥 Visit our YouTube channel for step-by-step video tutorials
👉 YouTube.com/@NextGenTemplates
📅 Last updated: September 2026






























Reviews
There are no reviews yet.