

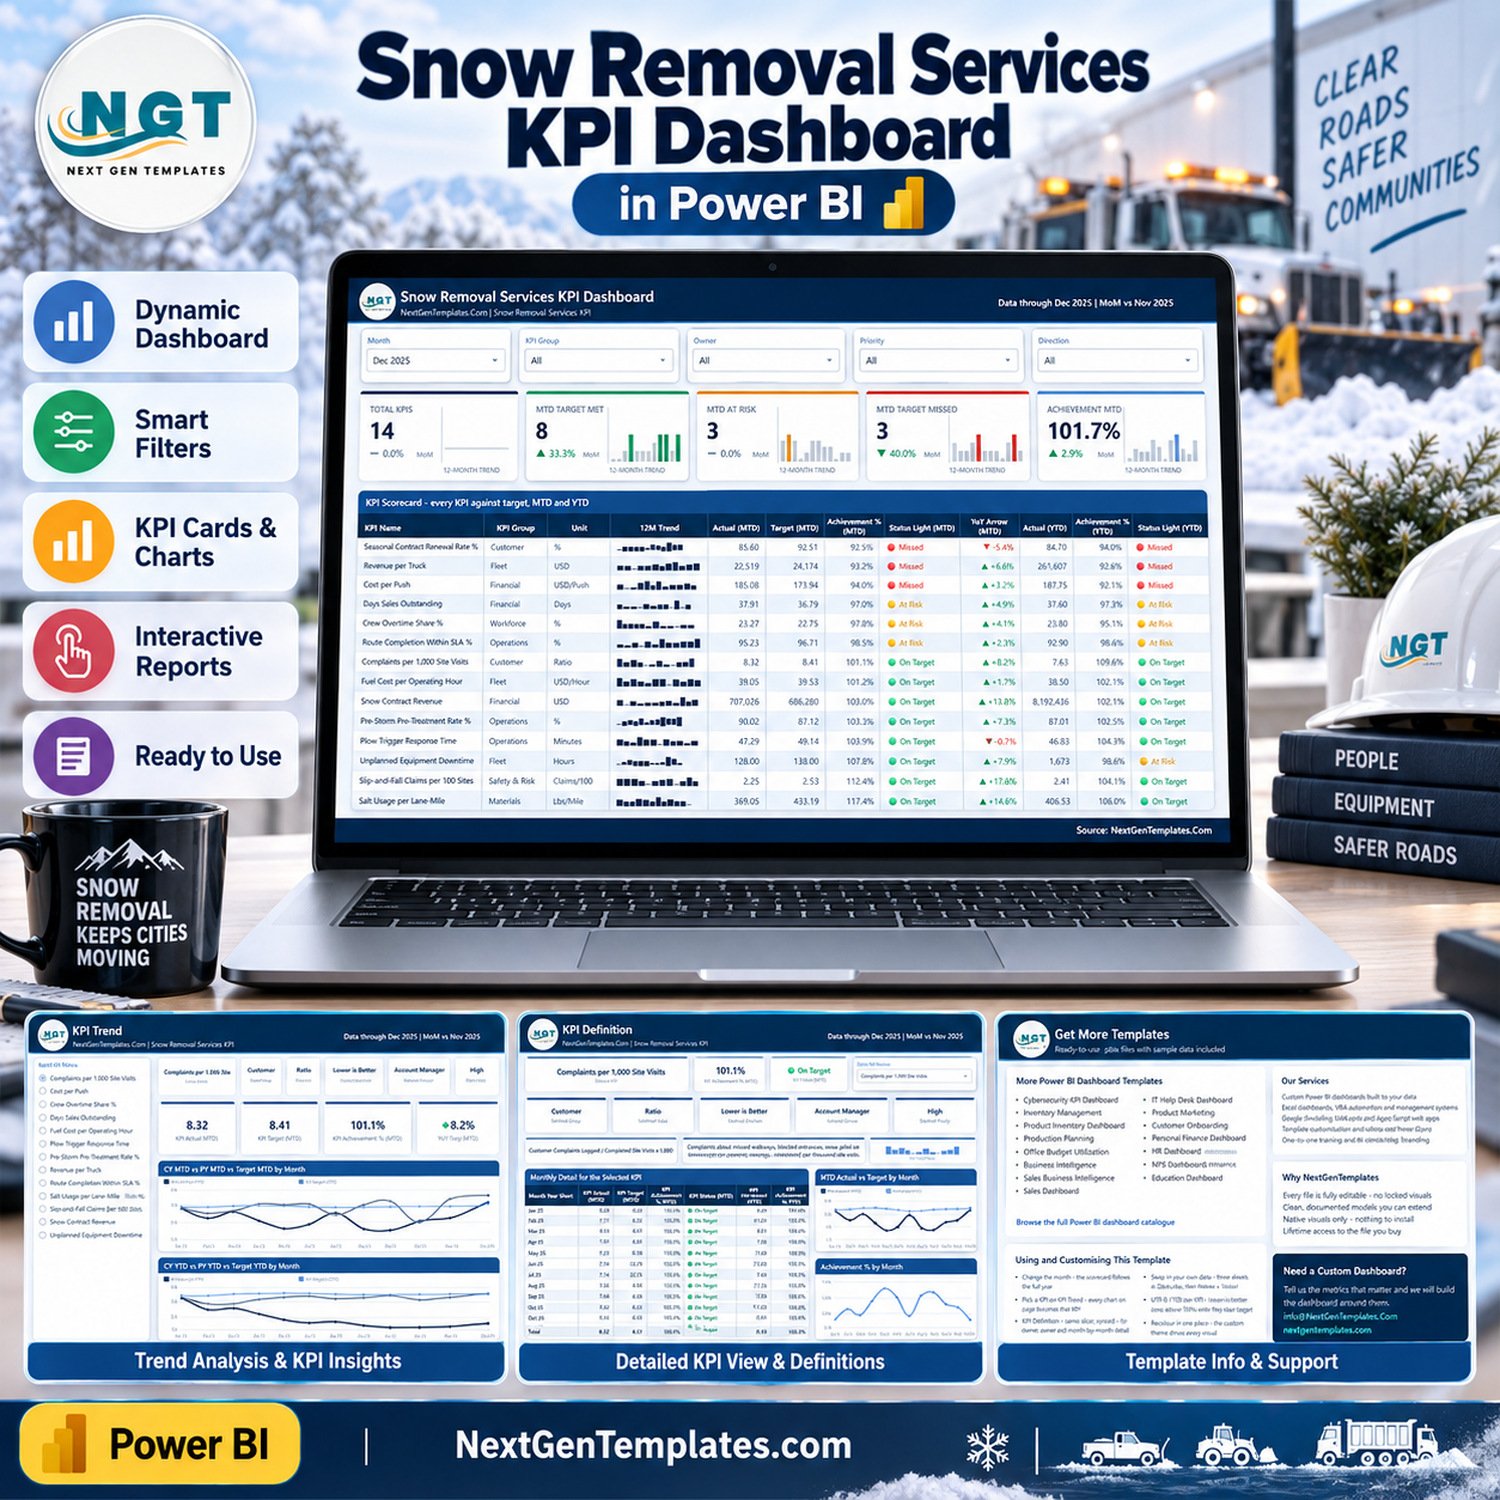
Snow Removal Services KPI Dashboard in Power BI turns 14 operational, financial, fleet, customer, workforce, safety, and materials measures into one decision-ready KPI view. Five slicers let managers focus on month, KPI group, owner, priority, and direction, while 12-month sparklines, MTD/YTD achievement, prior-year change, and traffic-light status expose exceptions quickly. The download includes the editable PBIX file, its Excel data source, and a user manual. It is a reporting template—not dispatch software, a weather feed, or a safety/compliance guarantee—so you can review the actual pages before deciding whether it fits your operation.
This snow removal kpi dashboard is built for teams that want repeatable monthly performance reviews without starting a Power BI model from a blank canvas. It can also serve as a power bi kpi dashboard template, a focused snow removal performance dashboard, or a structured winter operations kpi dashboard when the supplied sample data is replaced with your own.
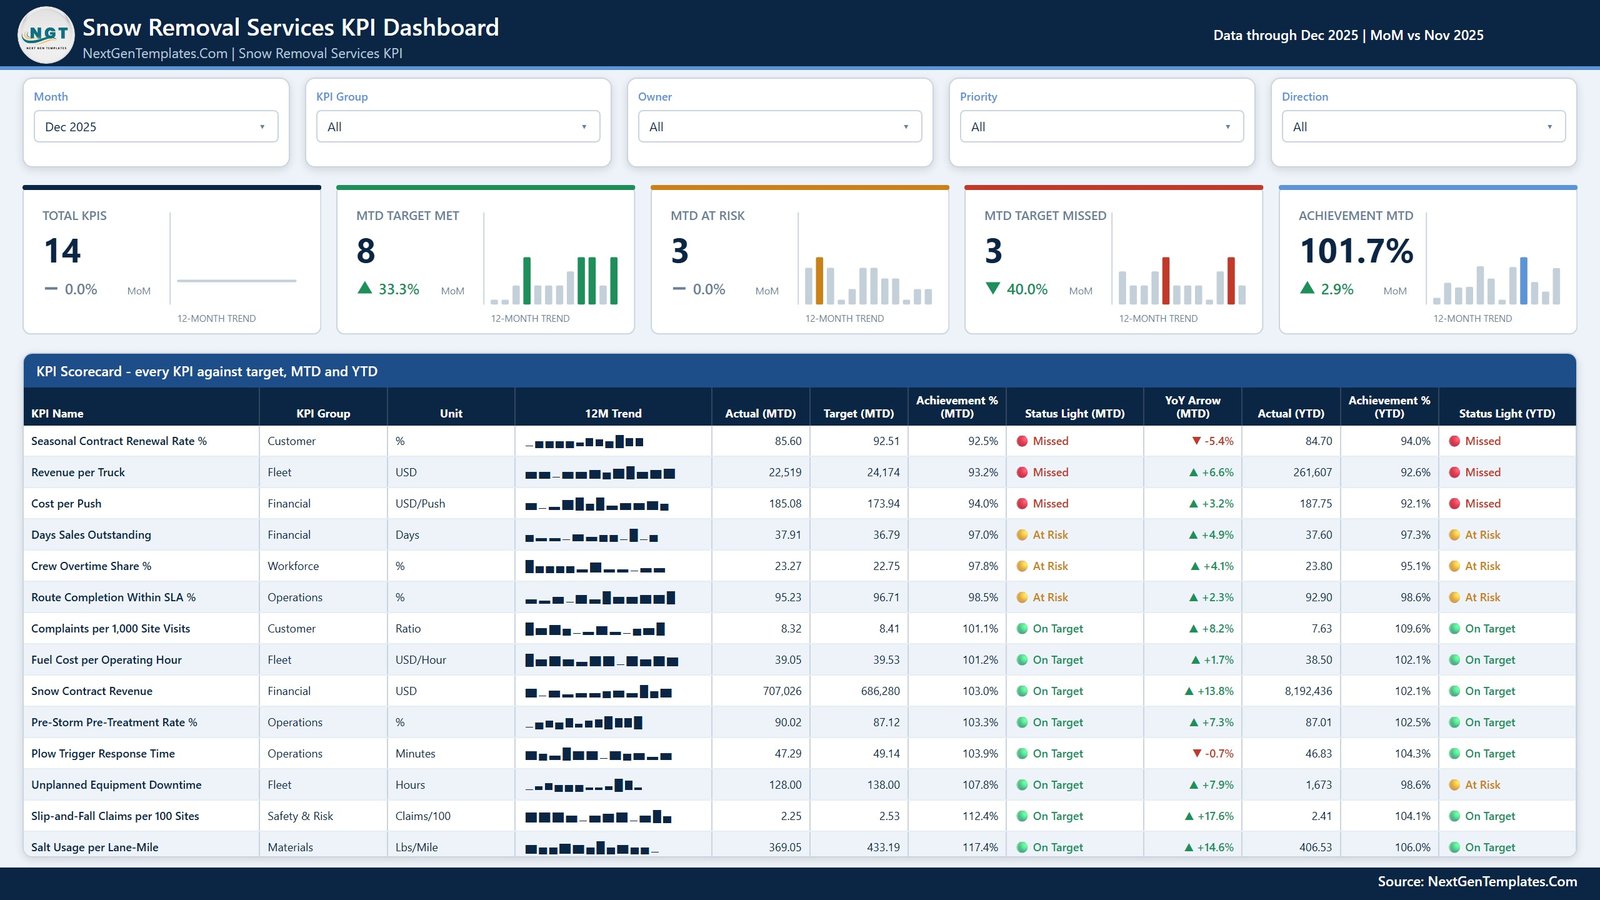
Main KPI scorecard with MTD and YTD performance
Key Features of Snow Removal Services KPI Dashboard in Power BI
- 14 snow-removal KPIs: measures include seasonal contract renewal rate, revenue per truck, cost per push, days sales outstanding, crew overtime share, route completion within SLA, complaints per 1,000 site visits, fuel cost per operating hour, snow contract revenue, pre-storm pre-treatment rate, plow trigger response time, unplanned equipment downtime, slip-and-fall claims per 100 sites, and salt usage per lane-mile.
- MTD and YTD scorecard: compare actuals with targets, view achievement percentages, and see On Target, At Risk, or Missed status lights.
- Five interactive filters: narrow results by month, KPI group, owner, priority, or direction.
- 12-month context: compact trends on the scorecard and full MTD/YTD time-series views on the KPI Trend page.
- Selected-KPI detail: view formula, definition, group, unit, direction, owner, priority, monthly detail, and charts for one chosen measure.
- Editable source: update the supplied Data.xlsx tables, refresh in Power BI Desktop, and adapt the theme or visuals for internal reporting.
What’s Inside the Snow Removal Services KPI Dashboard in Power BI
1. KPI Scorecard
The opening page presents all 14 KPIs in one table with 12-month trends, MTD actual and target, MTD achievement, status, year-over-year direction, YTD actual, YTD achievement, and YTD status. Summary cards count total KPIs and the current On Target, At Risk, and Missed split.
2. KPI Trend
Select any KPI to see its metadata and five headline values, then compare current-year actual, prior-year actual, and target month by month for both MTD and YTD perspectives.
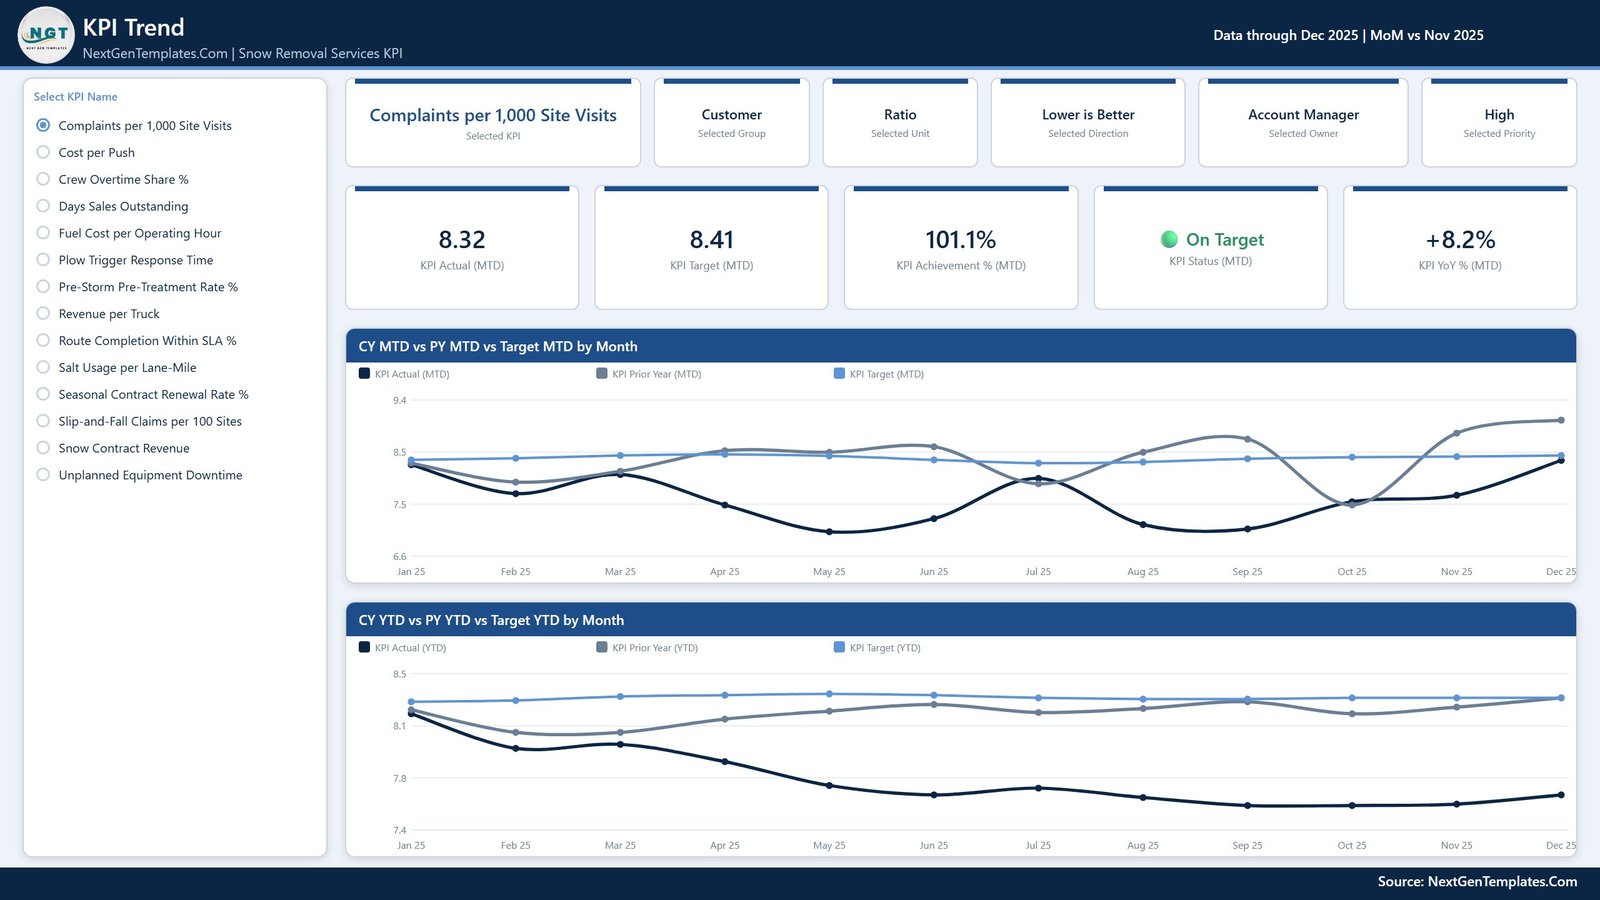
KPI Trend page with MTD and YTD comparisons
3. KPI Definition
The detail page explains the selected KPI’s formula and definition, identifies its owner and priority, and combines a monthly table with actual-versus-target and achievement charts. This supports more disciplined review conversations than a headline status alone.
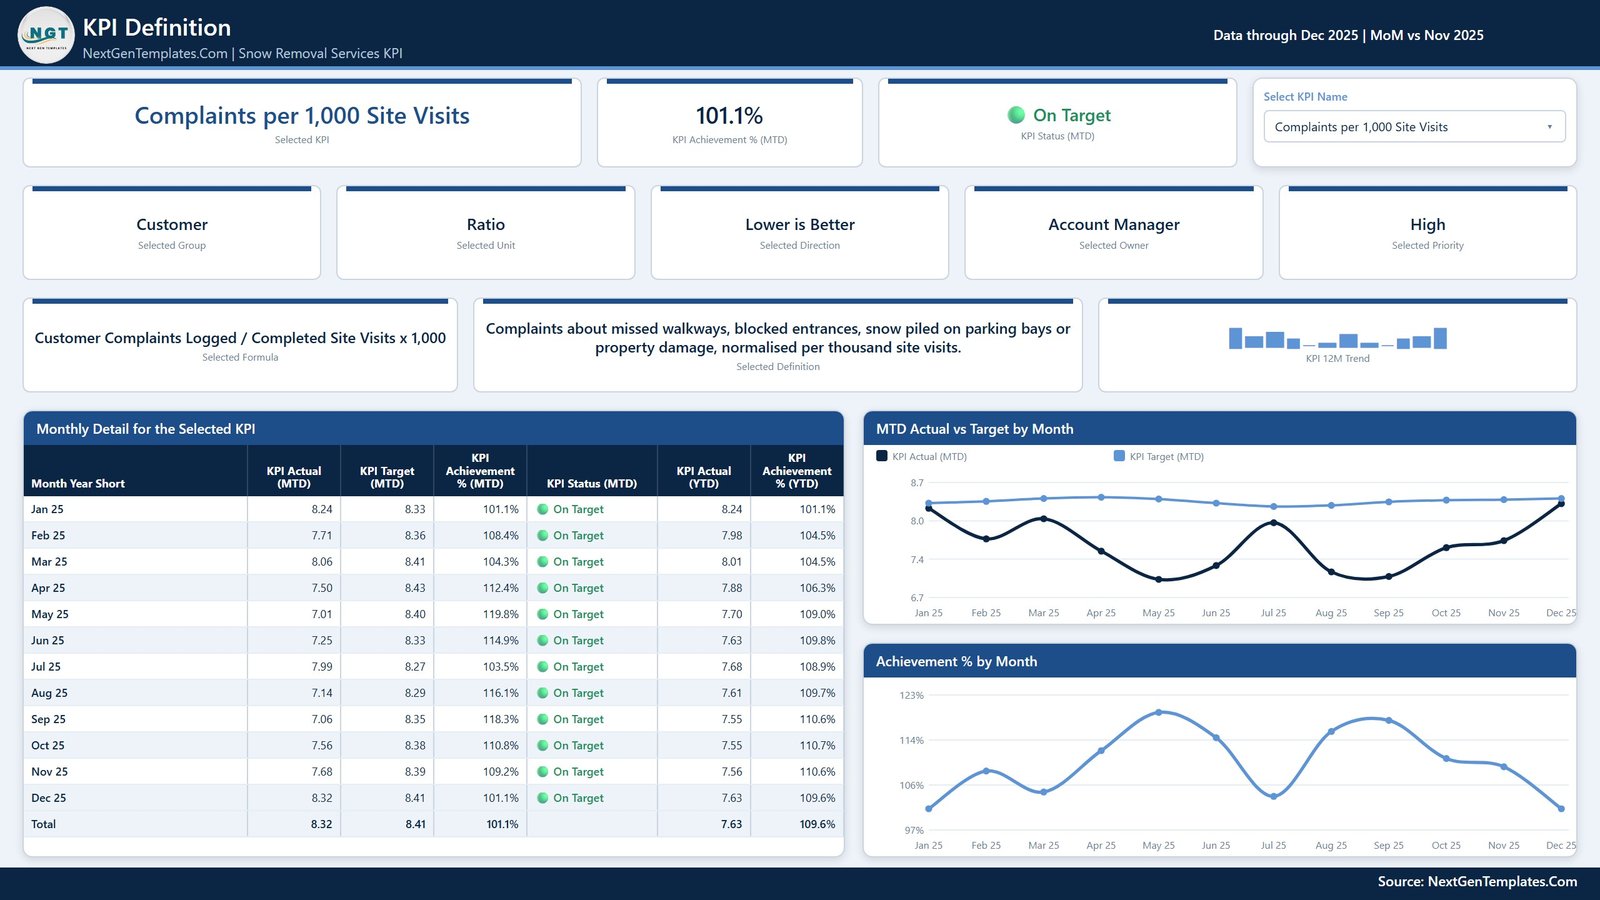
Selected-KPI definition and monthly detail
4. Template Information and Support
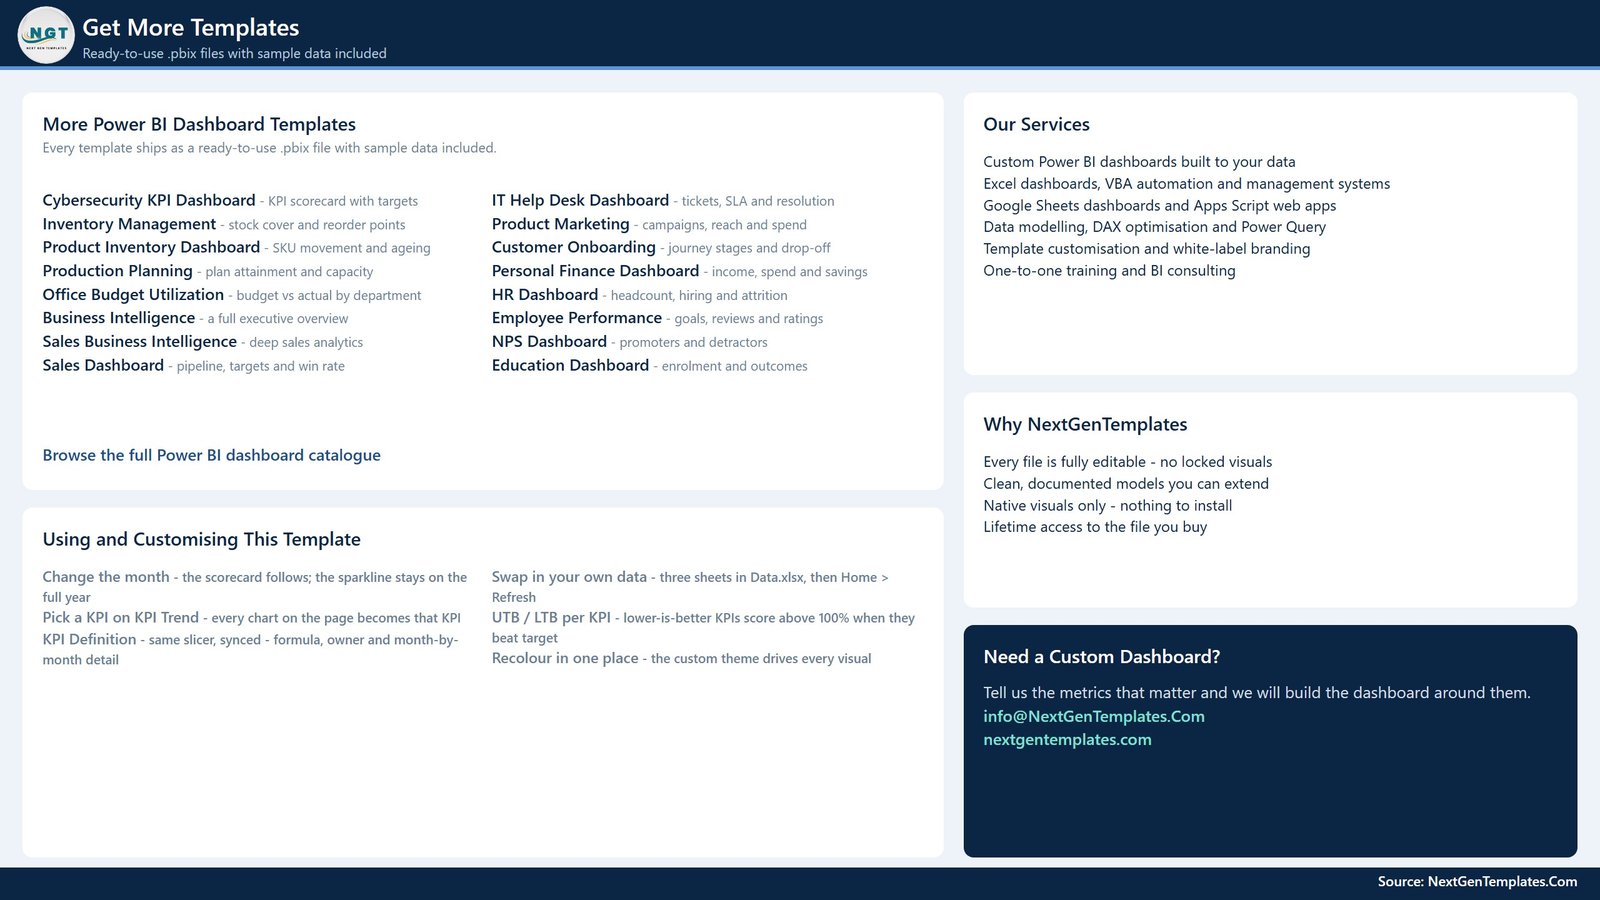
The final page explains how to change the month, select a KPI, replace the data through the three Data.xlsx tables, interpret upper-the-better and lower-the-better directions, refresh the report, and adjust the custom theme.
Snow Removal Services KPI Dashboard in Power BI vs. Excel vs. Paid SaaS – Where This Fits
| Consideration | This Power BI template | Excel alternative | Paid field-service SaaS |
|---|---|---|---|
| Cost model | One-time template purchase | One-time workbook purchase | Usually recurring subscription |
| Core use | Interactive KPI review and trend analysis | Spreadsheet-based KPI tracking | Broader dispatch, work orders, billing, and operations |
| Setup | Replace sample data and refresh | Replace sample data in Excel | Configuration, user setup, and process adoption |
| Collaboration | Power BI sharing depends on your Microsoft setup | File or cloud-workbook sharing | Usually built-in multi-user workflows |
| Customisation | Editable model, measures, visuals, and theme | Editable formulas, tables, and charts | Varies by plan and vendor |
| Field operations | Reporting only | Reporting only | May include dispatch and mobile field tools |
Who This Template Is For – and Who It’s Not For
Use it if you manage snow-removal contracts, fleet performance, route completion, service quality, or winter operations and already have monthly actual, target, and prior-year figures. Operations managers, fleet managers, finance leads, and account managers can each filter the same model to their own KPIs.
It is not a live GPS tracker, route optimiser, weather alert service, payroll system, invoice system, or regulatory compliance tool. It does not create source data automatically. Power BI Desktop skills are helpful when you want to change the model beyond replacing data and refreshing.
How to Use the Snow Removal Services KPI Dashboard in Power BI
- Unzip the download and keep the PBIX and Data.xlsx files together.
- Open Data.xlsx and replace the sample records in the supplied tables while retaining the expected column structure.
- Open the PBIX file in Power BI Desktop and refresh the data model.
- Use Month, KPI Group, Owner, Priority, and Direction filters to focus the review.
- Select a KPI on the Trend or Definition page to investigate its monthly pattern, target gap, formula, and ownership.
- Save a working copy before changing measures, relationships, or visual layouts.
Real-World Use Cases
Operations manager: monthly service review
Review route completion, response time, pre-treatment rate, customer complaints, and status exceptions before a contract-performance meeting.
Fleet manager: equipment and operating-cost review
Track revenue per truck, unplanned equipment downtime, fuel cost per operating hour, and cost per push while retaining 12-month context.
Finance or account lead: commercial performance
Monitor snow contract revenue, days sales outstanding, and seasonal renewal rate alongside customer and operational measures.
Frequently Asked Questions
What files are included?
The download contains the editable Power BI PBIX file, Data.xlsx source file, and a Power BI dashboard user manual.
Does it work without Power BI Desktop?
You need Power BI Desktop to open, refresh, and edit the PBIX. Microsoft provides Power BI Desktop separately.
Does the dashboard connect to live weather or GPS data?
No. It uses the supplied Excel source structure and does not include a weather, GPS, dispatch, or route-optimisation integration.
Can I change the KPIs?
Yes, but replacing or adding KPIs may require edits to the source tables, model, measures, and visuals. The included report is fully editable.
Are the displayed figures real business results?
No. The figures are sample data for demonstrating the report. Replace them with your own reviewed operational data.
Is this the same as the KPI scorecard or Google Sheets edition?
No. This is the Power BI KPI dashboard with scorecard, Trend, Definition, and information pages. Other platform and scorecard editions are separate products.
About the Author
Built by PK – Microsoft Certified Professional with 15+ years of Excel, Google Sheets, and Power BI experience. Founder of NextGenTemplates, reaching 300K+ subscribers across YouTube channels. Every template is hand-built and tested before release.
Explore Related Templates
- Crane Rental KPI Dashboard in Power BI
- Scaffolding Services KPI Dashboard in Power BI
- Crane Rental KPI Dashboard in Excel
- Snow Removal Services KPI Scorecard in Google Sheets
Browse more Power BI KPI dashboard templates or the wider Power BI collection.
Download the Snow Removal Services KPI Dashboard in Power BI to give monthly winter-operations reviews a consistent scorecard, trend, and definition layer. Review the screenshots, confirm that the 14 supplied KPIs suit your process, then replace the sample data with your own.
Last updated: September 18, 2026.
































Reviews
There are no reviews yet.