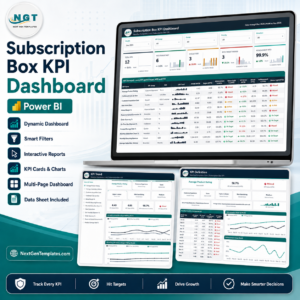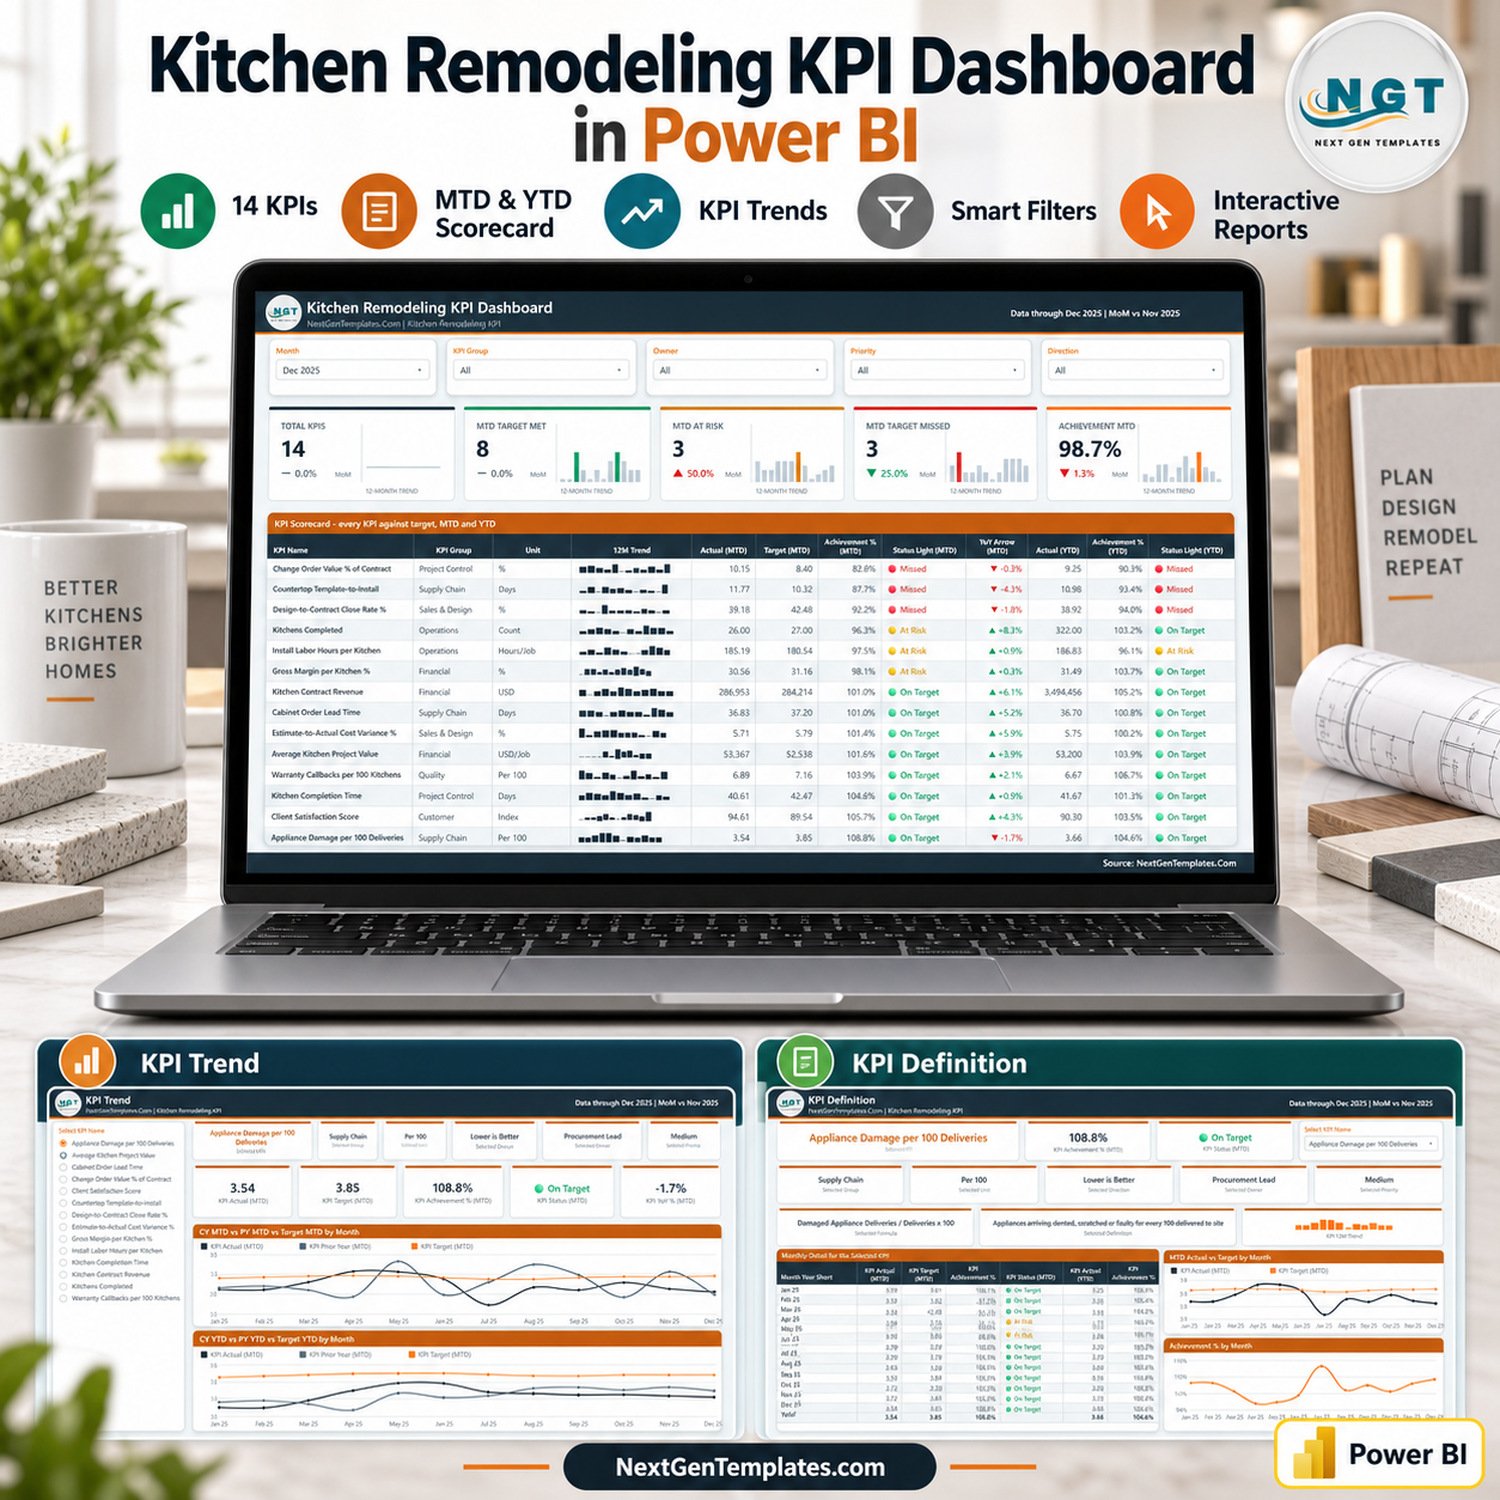
The Kitchen Remodeling KPI Dashboard in Power BI scores 14 kitchen remodel KPIs across 7 KPI groups on four report pages, with five slicers, five headline cards and a 12-column scorecard that rates every metric against target for both MTD and YTD. A full 2025 sample year and a 2024 prior year ship inside the data pack, so the report opens populated. Setup takes under 10 minutes: keep Data.xlsx next to the .pbix, replace the sample rows with your own and press Refresh.
🌍 Join 8,400+ teams in 40+ countries using NextGenTemplates to replace paid SaaS tools with one-time-purchase Excel, Google Sheets, Power BI and HTML templates.
✅ Instant download · One-time payment · No subscription · No per-user fees · Lifetime access
This listing belongs to our Power BI KPI dashboard family: a month-picker scorecard with red, amber and green status lights, a KPI Trend page and a KPI Definition page. It is not our analytical Power BI Dashboard line, which slices transaction-level data across overview and analysis pages. If you want to know whether each remodel metric hit target this month, this is the right file.

🔑 Key Features of the Kitchen Remodeling KPI Dashboard in Power BI
🎯 14 remodel-specific KPIs, each with its own direction. Six are higher-is-better (Kitchen Contract Revenue, Kitchens Completed, Average Kitchen Project Value, Gross Margin per Kitchen %, Design-to-Contract Close Rate % and Client Satisfaction Score) and eight are lower-is-better (Estimate-to-Actual Cost Variance %, Change Order Value % of Contract, Cabinet Order Lead Time, Countertop Template-to-Install, Kitchen Completion Time, Install Labor Hours per Kitchen, Appliance Damage per 100 Deliveries and Warranty Callbacks per 100 Kitchens).
🚦 Direction-aware achievement. Higher-is-better KPIs score Actual divided by Target; lower-is-better KPIs score Target divided by Actual, so finishing a kitchen faster than the target scores above 100%. The bands are fixed and documented: On Target at 100% or more, At Risk from 95% to 100%, Missed below 95%.
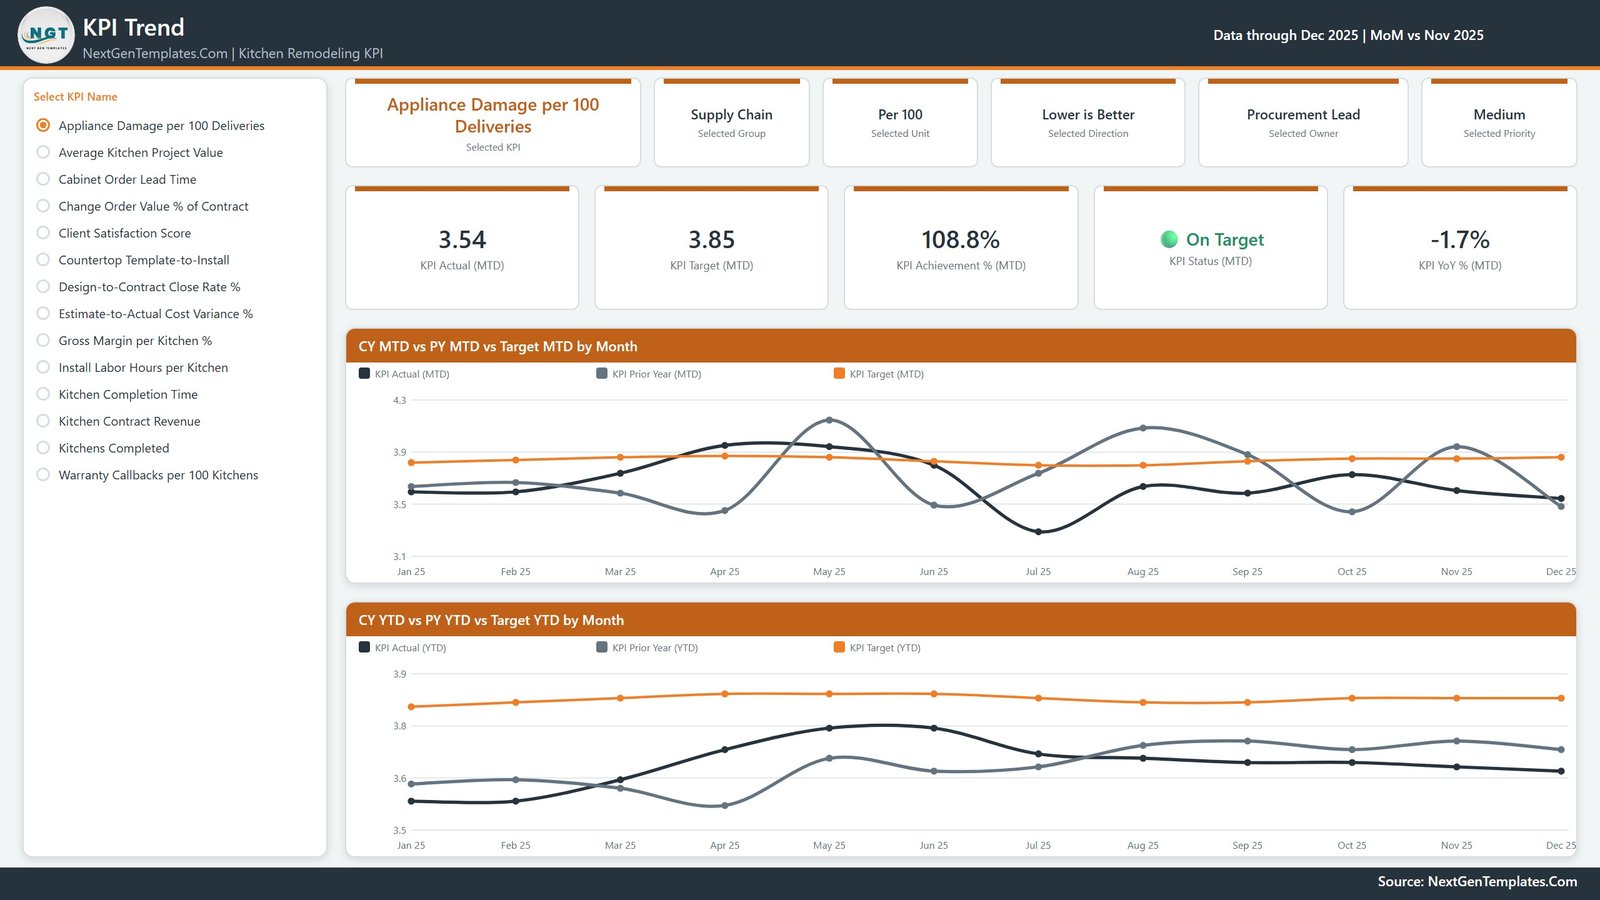
↕️ A YoY figure that reads the right way round. YoY % is expressed as improvement, so a fall in a lower-is-better KPI shows as a green up-arrow. In the December 2025 sample, Cabinet Order Lead Time dropped from 38.85 to 36.83 days and shows +5.2% in green, while Appliance Damage per 100 Deliveries rose from 3.48 to 3.54 and shows -1.7% in red.
🎛️ Five slicers on the scorecard page: Month, KPI Group, Owner, Priority and Direction. The KPI Trend and KPI Definition pages share a synced KPI Name slicer, so the KPI you pick on one page stays selected on the other.
📈 A 12-month sparkline on every row and every card. Total KPIs, MTD Target Met, MTD At Risk, MTD Target Missed and Achievement MTD each carry a month-over-month change and a 12-month trend bar, and every KPI row repeats its own sparkline.
🧾 Nothing is hard-coded. Every card, chart and table is driven by the rows in the data pack. Rename a KPI, add one or delete one, press Refresh, and the counts, the scorecard, the KPI picker and every chart follow.
📦 What is Inside This Power BI KPI Dashboard
The download is a ZIP holding three files: the .pbix report, Data.xlsx (the data pack) and a Power BI dashboard user manual PDF. The report has four visible pages plus two hidden tooltip pages, KPI Detail and Trend Detail, that appear when you hover a visual. There are no drillthrough pages.
Page 1: KPI Scorecard
The month view. Five slicers sit above five header cards, and a 14-row table gives each KPI its group, unit, 12-month sparkline, MTD actual, target, achievement %, status light and YoY arrow, then YTD actual, achievement % and status light. In the shipped December 2025 sample, 8 KPIs are On Target, 3 At Risk and 3 Missed, at 98.7% Achievement MTD. The three misses are Change Order Value % of Contract (82.8%), Countertop Template-to-Install (87.7%) and Design-to-Contract Close Rate % (92.2%).
Page 2: KPI Trend
Pick one KPI from the list on the left and the page becomes that KPI: six context cards (KPI, group, unit, direction, owner and priority), five value cards (MTD actual, target, achievement %, status and YoY %), then CY MTD vs PY MTD vs Target MTD by Month and CY YTD vs PY YTD vs Target YTD by Month. For Appliance Damage per 100 Deliveries it reads 3.54 against a 3.85 target, 108.8% and On Target.
Page 3: KPI Definition
The same KPI, explained. Cards show the formula (for example Damaged Appliance Deliveries / Deliveries x 100), the plain-English definition, group, unit, direction, owner, priority and a 12-month trend. Below sit a Monthly Detail for the Selected KPI table covering January to December with a total, plus MTD Actual vs Target by Month and Achievement % by Month charts. In the sample, April and May 2025 are the two At Risk months at 98.0%.

Page 4: Get More Templates
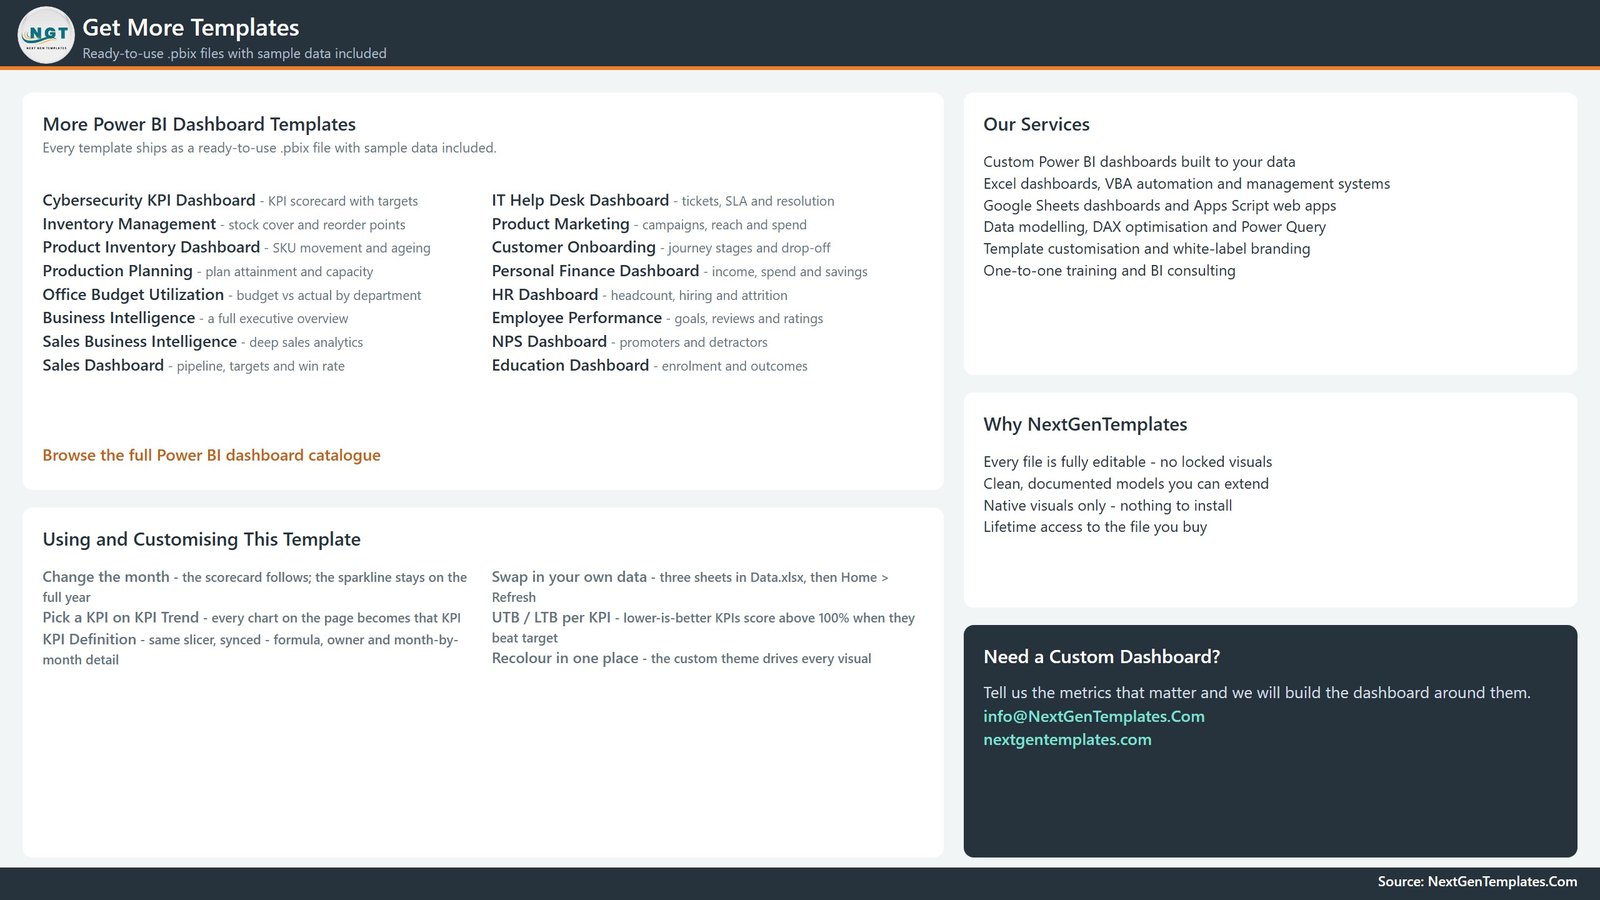
A catalogue and help page rather than a data page. It lists other Power BI dashboards, our services, and a Using and Customising This Template panel covering the month picker, the synced KPI slicer, swapping in your own data and recolouring the theme in one place.
The data pack
Data.xlsx carries four sheets: a Read Me; Input_ Target with 168 rows (14 KPIs x 12 months); Input_ Actual with 336 rows covering 2025 and the 2024 prior year; and KPI Definition, which holds each KPI’s group, unit, formula, definition, UTB or LTB type, owner and priority. The shipped KPIs are owned by 11 named roles, from General Manager to Fabrication Coordinator, at three priority levels: 5 Critical, 7 High and 2 Medium.
📊 Power BI vs. Tableau or Qlik vs. Remodeling Software – Where This Fits
| Feature | This Power BI KPI Dashboard | Tableau / Qlik | Buildertrend / JobTread |
|---|---|---|---|
| Cost | $12.99 one-time ✅ | $70-115 / user / month | Monthly company subscription |
| Platform | Power BI Desktop (free) ✅ | Paid desktop plus server | Vendor cloud only |
| Setup time | Under 10 minutes ✅ | Days of modelling | Weeks of onboarding |
| KPI targets and RAG bands built in | Yes, 14 KPIs pre-scored ✅ | Build it yourself | Reports fixed to their schema |
| Lower-is-better metrics scored correctly | Yes, per-KPI UTB/LTB flag ✅ | Manual DAX or calc field | Varies |
| Add or rename a KPI | Edit a spreadsheet row ✅ | Edit the workbook | Vendor-controlled fields |
| Scheduling, estimating and client portal | No, reporting only | No | Yes ✅ |
| Mobile access | Power BI mobile app | Yes ✅ | Yes ✅ |
| Year-1 cost at 5 users | $12.99 ✅ | $4,200-6,900 | Recurring, several thousand dollars |
For a remodeling firm that wants a scored, target-driven monthly KPI pack without a per-seat BI bill or a software migration, this Power BI KPI dashboard sits in the sweet spot.
👥 Who This Template Is For – and Who It Is Not For
✅ This template is built for:
- Owners and general managers of kitchen remodeling and renovation firms running one to several install crews
- Project and production managers who already track completion time, change orders and warranty callbacks in spreadsheets and want them scored monthly
- Sales and design leads reporting close rate and average project value to an owner or partner
- Power BI users who want a finished, well-modelled KPI report to adapt rather than a blank canvas
❌ This template is NOT for:
- Anyone needing scheduling, estimating, job costing, purchase orders or a client portal; this is a reporting layer, not an operating system for jobs
- Teams wanting a live connection to Buildertrend, JobTread or QuickBooks; the source is an Excel workbook you maintain
- Firms looking for compliance tracking; it does not check building codes, permits, contractor licensing or warranty obligations
- Anyone who needs industry benchmarks; every target in the file is one you set yourself, and the sample figures are invented
⚙️ How to Use This Power BI KPI Dashboard
- Unzip the download and keep the .pbix and Data.xlsx in the same folder.
- Open the .pbix in Power BI Desktop (free from Microsoft). The sample year loads immediately.
- If you moved the files, re-point the source once: Home > Transform data > Data source settings > Change Source.
- Edit the KPI Definition sheet: names, groups, units, formulas, owners, priorities and the UTB or LTB flag that decides how each KPI is scored.
- Fill Input_ Target and Input_ Actual, one row per KPI per month, and load last year into Input_ Actual so every PY and YoY figure has something to read.
- Enter YTD as a running total for money and counts, and as the average of the months so far for %, Days, Index and per-100 rates.
- Press Home > Refresh, then use the Month slicer and the KPI Name slicer to review the month.
💼 Real-World Use Cases
Maria owns a kitchen remodeling company with four install crews. On the first Monday of each month she filters Priority to Critical and sees Design-to-Contract Close Rate % Missed at 92.2% while Kitchen Contract Revenue is still On Target. That tells her the pipeline is thinning before the revenue line shows it, and she books a design-team review.
James is a project manager. He selects his name in the Owner slicer before the weekly production meeting, so his view shows only Change Order Value % of Contract and Kitchen Completion Time. Change orders sit at 10.15% of contract against an 8.40% target, which gives him a specific number to take to the design stage.
Aisha runs procurement. She lives on the KPI Trend page, flipping between Cabinet Order Lead Time and Appliance Damage per 100 Deliveries. The CY vs PY chart shows cabinet lead time is better than last year, while appliance damage has crept above its prior-year line even though it still beats target.
❓ Frequently Asked Questions
What KPIs does the Kitchen Remodeling KPI Dashboard in Power BI track?
It tracks 14 KPIs in 7 groups: Financial, Operations, Sales & Design, Project Control, Supply Chain, Quality and Customer. They run from Kitchen Contract Revenue and Gross Margin per Kitchen % to Countertop Template-to-Install, Warranty Callbacks per 100 Kitchens and Client Satisfaction Score, each with a formula and definition.
How long does setup take?
Under 10 minutes if your monthly actuals and targets already exist somewhere. Unzip, open the .pbix in Power BI Desktop, replace the rows in Data.xlsx with your own and press Refresh. Deciding your targets takes longer than configuring the file.
Does it handle metrics where lower is better?
Yes. Eight of the fourteen shipped KPIs carry an LTB flag and score Target divided by Actual, so cutting completion time or change-order value pushes achievement above 100%. The YoY % follows the same rule, so green always means better than last year and red always means worse.
How does this compare to Buildertrend or JobTread?
Those are construction management platforms, sold as monthly subscriptions, that schedule jobs, estimate and run client communication. This template is a $12.99 one-time reporting layer that scores the numbers you already have. It reports; it does not schedule, estimate or invoice.
Do I need a paid Power BI licence?
No. Power BI Desktop is free from Microsoft and opens, refreshes, filters and prints the report. A Power BI Pro licence is only needed if you want to publish the report to the Power BI Service and share it with colleagues online.
Is there an Excel or Google Sheets version?
Excel and Google Sheets editions of this kitchen remodeling KPI dashboard are in preparation. Available now is the Kitchen Remodeling KPI Scorecard in Google Sheets, which is our scorecard line rather than this dashboard line: a single monthly card instead of a multi-page report.
Does it track permits, licensing or building-code compliance?
No. Warranty Callbacks per 100 Kitchens is a performance count, not a warranty record, and nothing in the file checks permits, inspections, contractor licensing or code requirements. Keep those in the systems your jurisdiction and insurer expect.
👤 About the Author
Built by PK – Microsoft Certified Professional with 15+ years of Excel, Google Sheets and Power BI experience. Founder of NextGenTemplates, reaching 300K+ subscribers across YouTube channels (@PK-AnExcelExpert, @NextGenTemplates, @NeoTechNavigators). Every template is hand-built and tested before release.
🔗 Explore Related Templates
Same trade, different format: the Kitchen Remodeling KPI Scorecard in Google Sheets is a lighter monthly scorecard, and the Bathroom Remodeling KPI Scorecard in Google Sheets, Home Renovation Contractor KPI Scorecard in Google Sheets and Interior Fit-Out KPI Scorecard in Google Sheets cover neighbouring trades. A Bathroom Remodeling KPI Dashboard in Power BI is in preparation.
More KPI dashboards on this platform: Concrete Contractor KPI Dashboard in Power BI, Drywall Contractor KPI Dashboard in Power BI and Paving Contractor KPI Dashboard in Power BI. Browse the full range of Power BI Dashboards.
Run the jobs, not just the numbers: the Home Renovation Project Management Web App and the Home Renovation Budget and Project Tracker in Google Sheets handle the day-to-day side.
📖 Click here to read the Detailed Blog Post
🎥 Visit our YouTube channel for step-by-step video tutorials
👉 YouTube.com/@NextGenTemplates
📅 Last updated: September 2026