

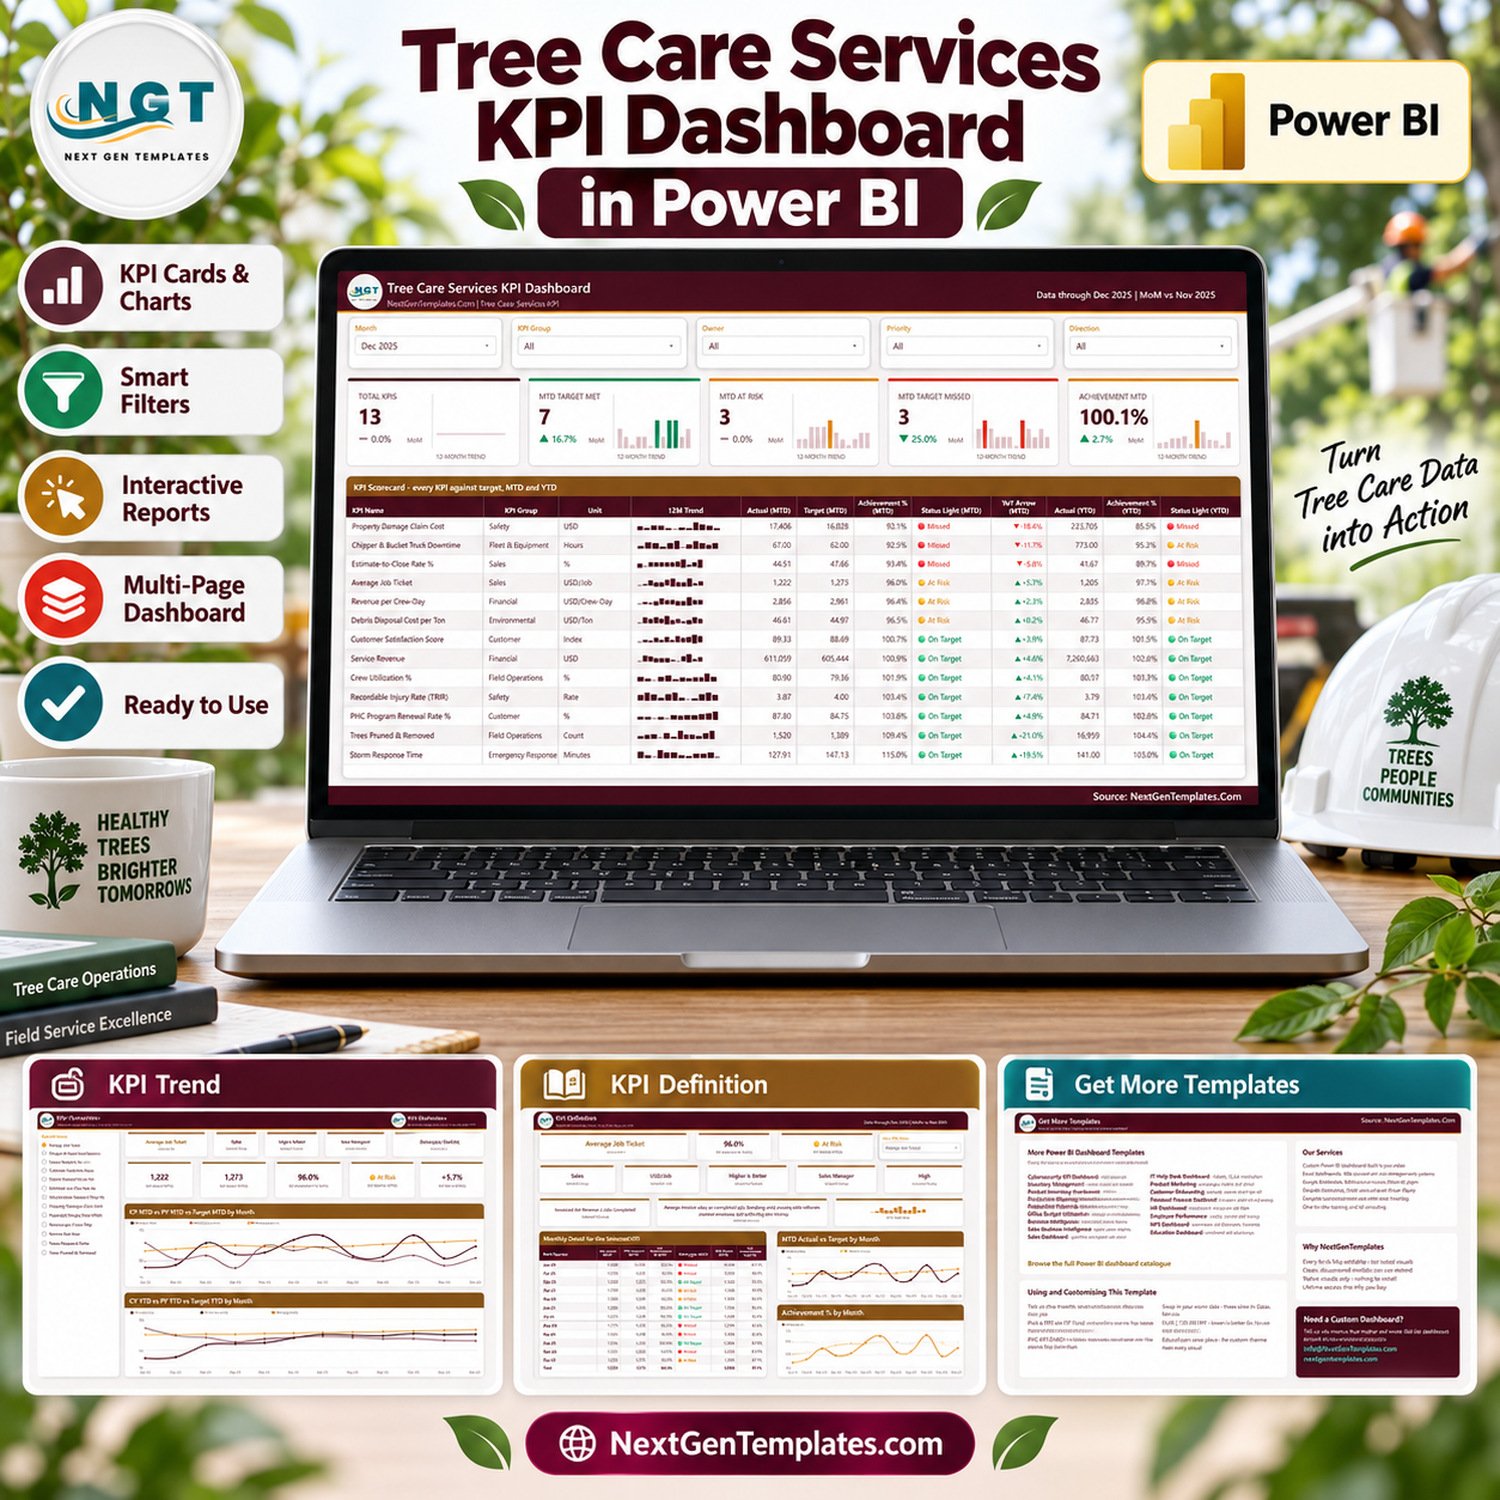
Track 13 tree-care KPIs across 12 months from one interactive Power BI report. The Tree Care Services KPI Dashboard in Power BI brings financial, field-operations, safety, fleet, customer, sales, environmental and emergency-response measures into one consistent scorecard. It includes a ready-to-use PBIX file, sample data and a structured Data.xlsx source. Buy once, edit the data for your operation and keep the report under your control—without a recurring dashboard subscription.
This tree care KPI dashboard combines operational numbers with target, prior-year and status context. It is built for internal performance monitoring; it does not replace safety, accounting, regulatory or professional advice. If you are looking for a focused power bi tree care dashboard, an arborist KPI dashboard, or a practical field service KPI dashboard, this template provides a clear starting point.
Key Features of Tree Care Services KPI Dashboard in Power BI
- 13 industry-relevant KPIs: view safety, fleet, sales, finance, environmental, customer, field operations and emergency-response measures together.
- Five report slicers: filter by Month, KPI Group, Owner, Priority and Direction.
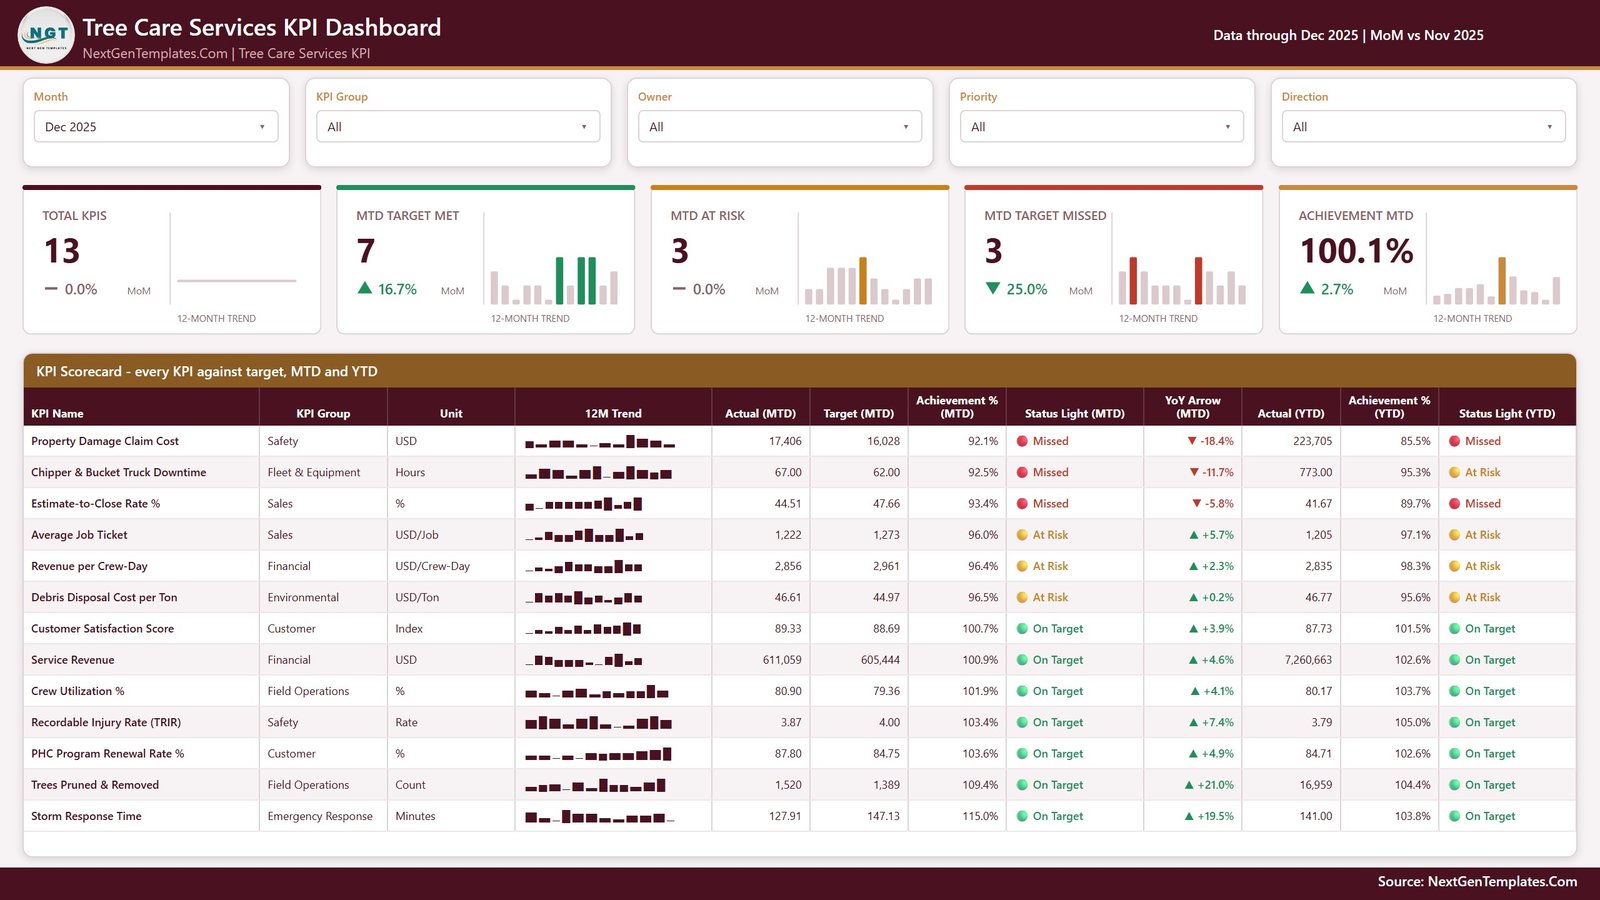
- MTD and YTD context: compare actuals with targets, achievement percentages, status lights and prior-year movement.
- 12-month trends: follow each KPI through a full year instead of relying on one isolated result.
- Three performance states: distinguish On Target, At Risk and Missed KPIs quickly.
- Editable Power BI file: work with the included PBIX and replace the sample records through the supplied Data.xlsx source.
- Native report experience: interact with filters, charts and page navigation in Power BI Desktop.
What’s Inside the Power BI Tree Care Dashboard
KPI Scorecard page: The opening report page shows Total KPIs, MTD Target Met, MTD At Risk, MTD Target Missed and Achievement MTD cards. The scorecard lists Property Damage Claim Cost, Chipper & Bucket Truck Downtime, Estimate-to-Close Rate %, Average Job Ticket, Revenue per Crew-Day, Debris Disposal Cost per Ton, Customer Satisfaction Score, Service Revenue, Crew Utilization %, Recordable Injury Rate (TRIR), PHC Program Renewal Rate %, Trees Pruned & Removed, and Storm Response Time.
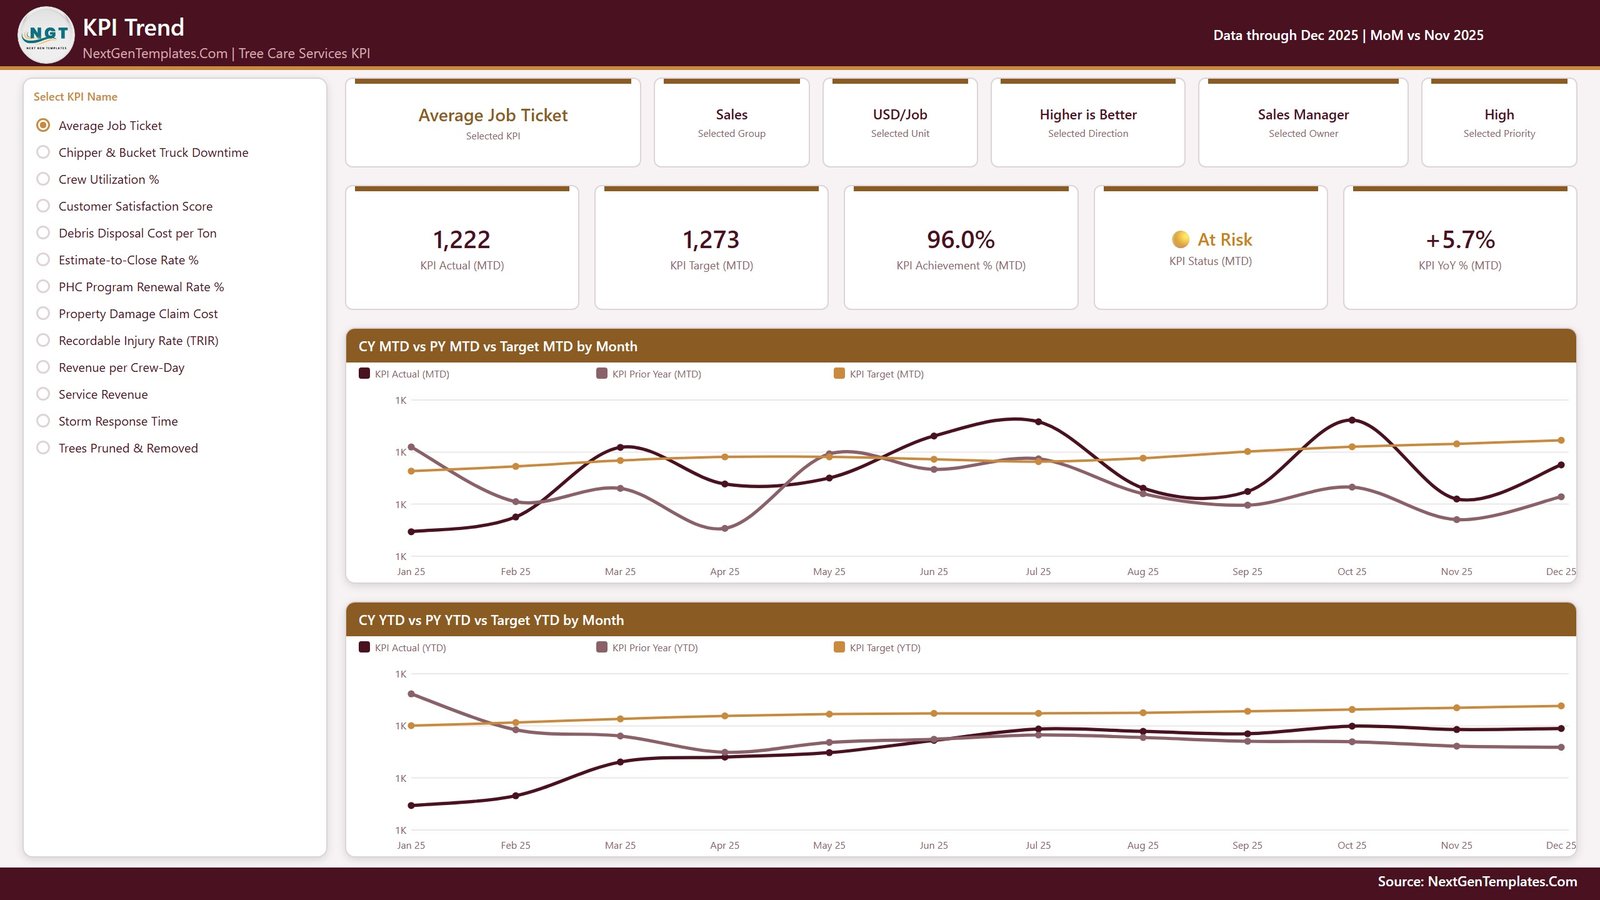
KPI Trend page: Select one KPI to review its group, unit, direction, owner and priority. Cards show actual, target, achievement, status and year-over-year movement, while separate charts compare current-year, prior-year and target values for MTD and YTD.
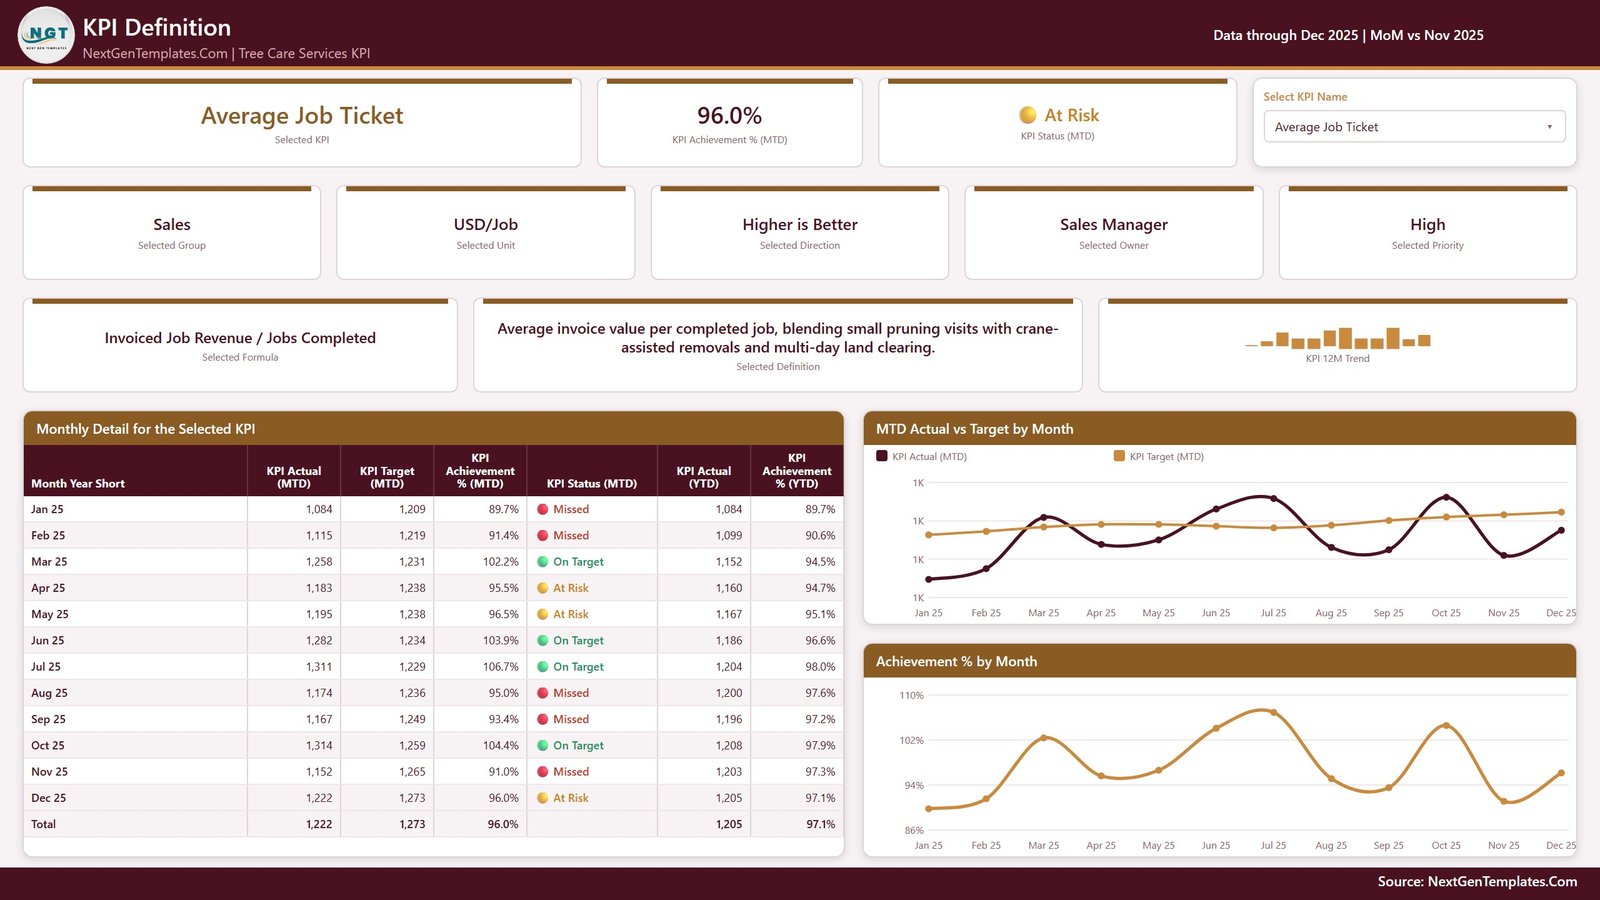
KPI Definition page: Inspect the selected KPI’s formula, business definition, group, unit, direction, owner and priority. A monthly detail table and two supporting charts connect the definition to actual results.
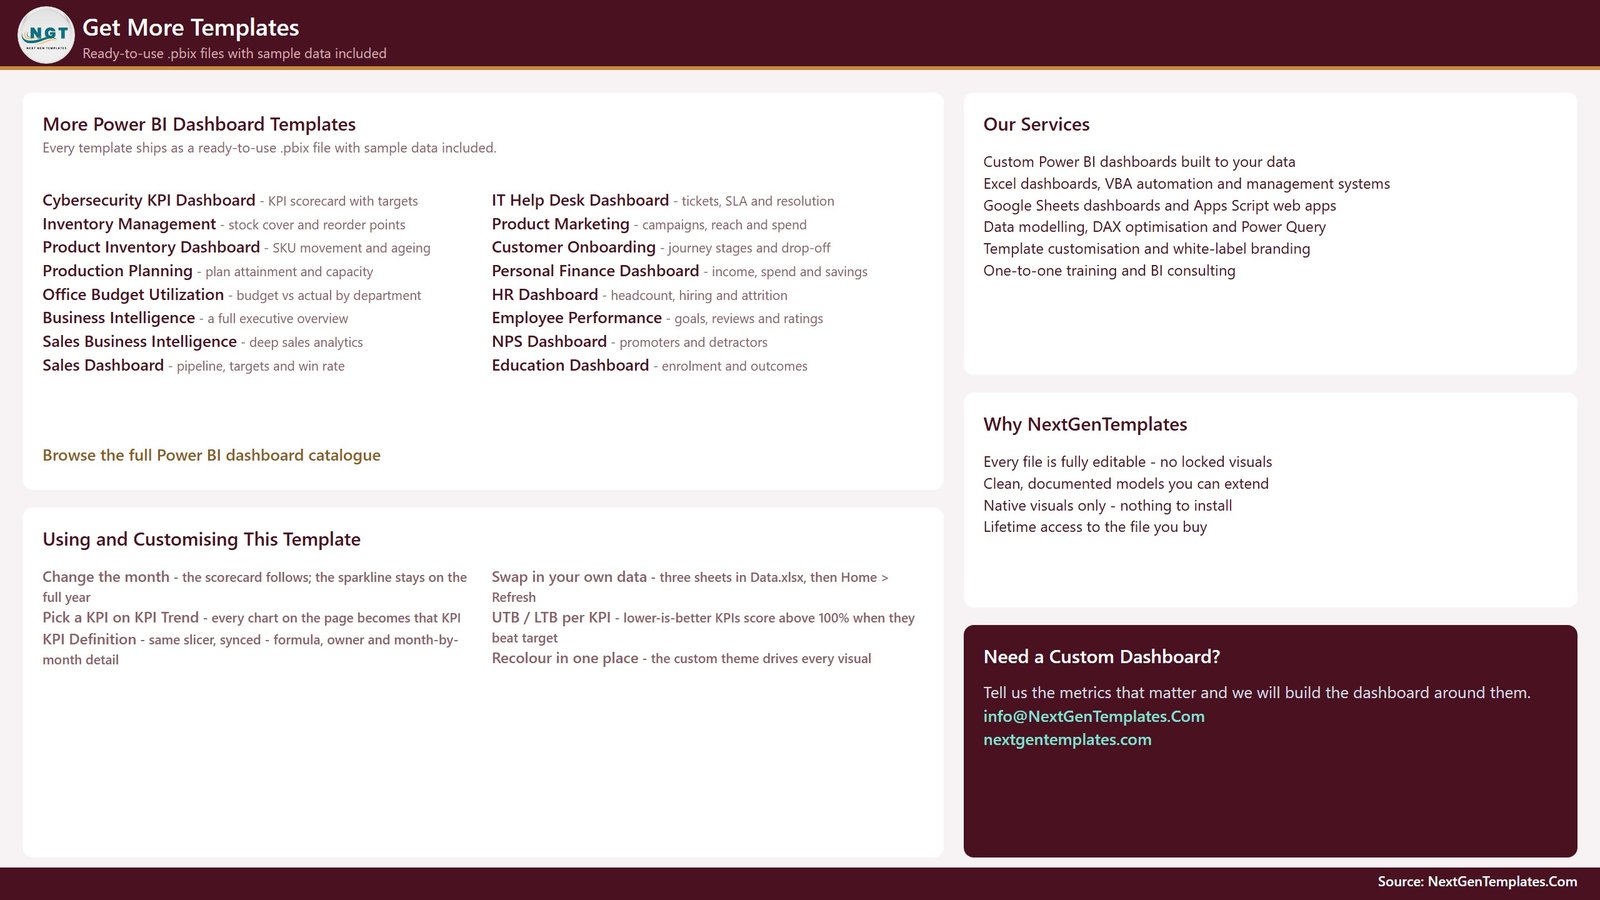
Resources page: The final page provides practical notes on changing the month, selecting a KPI, replacing source data, refreshing the report and adjusting the visual theme.
Power BI Tree Care Dashboard vs. Excel vs. Paid Field-Service SaaS – Where This Fits
| Consideration | This Power BI template | Excel alternative | Paid field-service SaaS |
|---|---|---|---|
| Cost model | One-time template purchase | One-time workbook purchase | Usually recurring subscription |
| Visual analysis | Interactive report pages and slicers | Workbook sheets and charts | Vendor-defined screens |
| Setup | Replace the included source data and refresh | Replace table data in Excel | Account setup and configuration |
| Customisation | Edit the PBIX, measures and visuals | Edit workbook formulas and charts | Depends on the plan |
| Team access | Desktop use; sharing may require Power BI Service licensing | File-based sharing | Typically browser and mobile access |
| Tree-care KPI scope | 13 prebuilt KPIs with MTD/YTD tracking | Best for spreadsheet-led workflows | May include scheduling, dispatch and CRM features |
Who This Template Is For – and Who It’s Not For
It is designed for tree-service owners, operations managers, sales managers, fleet coordinators and analysts who already collect monthly KPI data and want a repeatable review format. It suits arborist businesses, pruning and removal contractors, plant-health-care teams and storm-response operations.
It is not a dispatch system, CRM, estimating tool, accounting ledger, OSHA reporting application or mobile field app. TRIR and other safety measures are buyer-supplied data; the dashboard visualises them but does not determine compliance. It also does not automatically connect to your operational software without separate data preparation.
How to Use This Tree Care KPI Dashboard
- Download and unzip the package.
- Open Data.xlsx and review the supplied structure and sample records.
- Replace the examples with your own monthly actual, target and prior-year figures while preserving the expected columns.
- Open the PBIX file in Microsoft Power BI Desktop and refresh the data.
- Use the Month, KPI Group, Owner, Priority and Direction slicers to focus each review.
- Open KPI Trend and KPI Definition when a result needs deeper context.
Real-World Use Cases
Operations manager preparing a monthly review
Review crew utilisation, trees pruned and removed, revenue per crew-day, debris disposal cost and storm response time in one meeting-ready view.
Safety lead monitoring operational indicators
Track property damage claim cost and buyer-entered recordable injury rate alongside target and year-over-year context.
Owner balancing growth and service quality
Compare service revenue, average job ticket and estimate-to-close rate with customer satisfaction and PHC program renewal rate.
Frequently Asked Questions
What files are included?
The download includes the editable Power BI PBIX, Data.xlsx and the user manual inside one ZIP file.
Do I need Microsoft Power BI?
Yes. Open and edit the PBIX in Power BI Desktop. Sharing through Power BI Service may require separate Microsoft licensing.
Can I change the KPIs?
Yes, the file is editable, but changing definitions, fields or measures may require Power BI modelling knowledge.
Does it connect automatically to my tree-service software?
No. The supplied workflow uses Data.xlsx; other integrations require separate setup.
Is this a compliance or safety-reporting system?
No. It visualises the data you provide and does not replace official safety records, regulatory submissions or professional guidance.
Is sample data included?
Yes. The sample data demonstrates the report structure and should be replaced with your own information.
About the Author
Built by PK – Microsoft Certified Professional with 15+ years of Excel, Google Sheets, and Power BI experience. Founder of NextGenTemplates, reaching 300K+ subscribers across YouTube channels. Every template is hand-built and tested before release.
Explore Related Templates
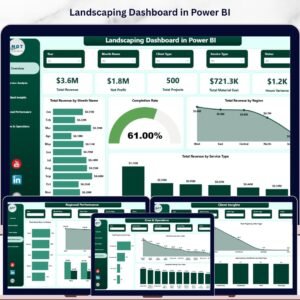
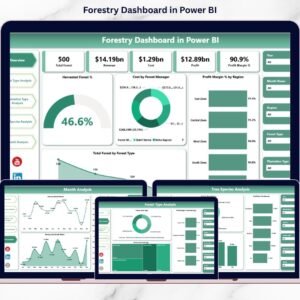
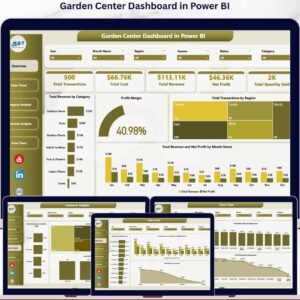
Compare the Forestry Dashboard in Power BI, Landscaping Dashboard in Power BI, Garden Center Dashboard in Power BI, and Swimming Pool Service KPI Dashboard in Power BI. Browse more Power BI KPI dashboards or the complete Power BI template collection.
Install Microsoft Power BI Desktop, then download this tree care dashboard today and turn monthly performance data into a focused, repeatable operations review.
Last updated: September 2026.






























Reviews
There are no reviews yet.