

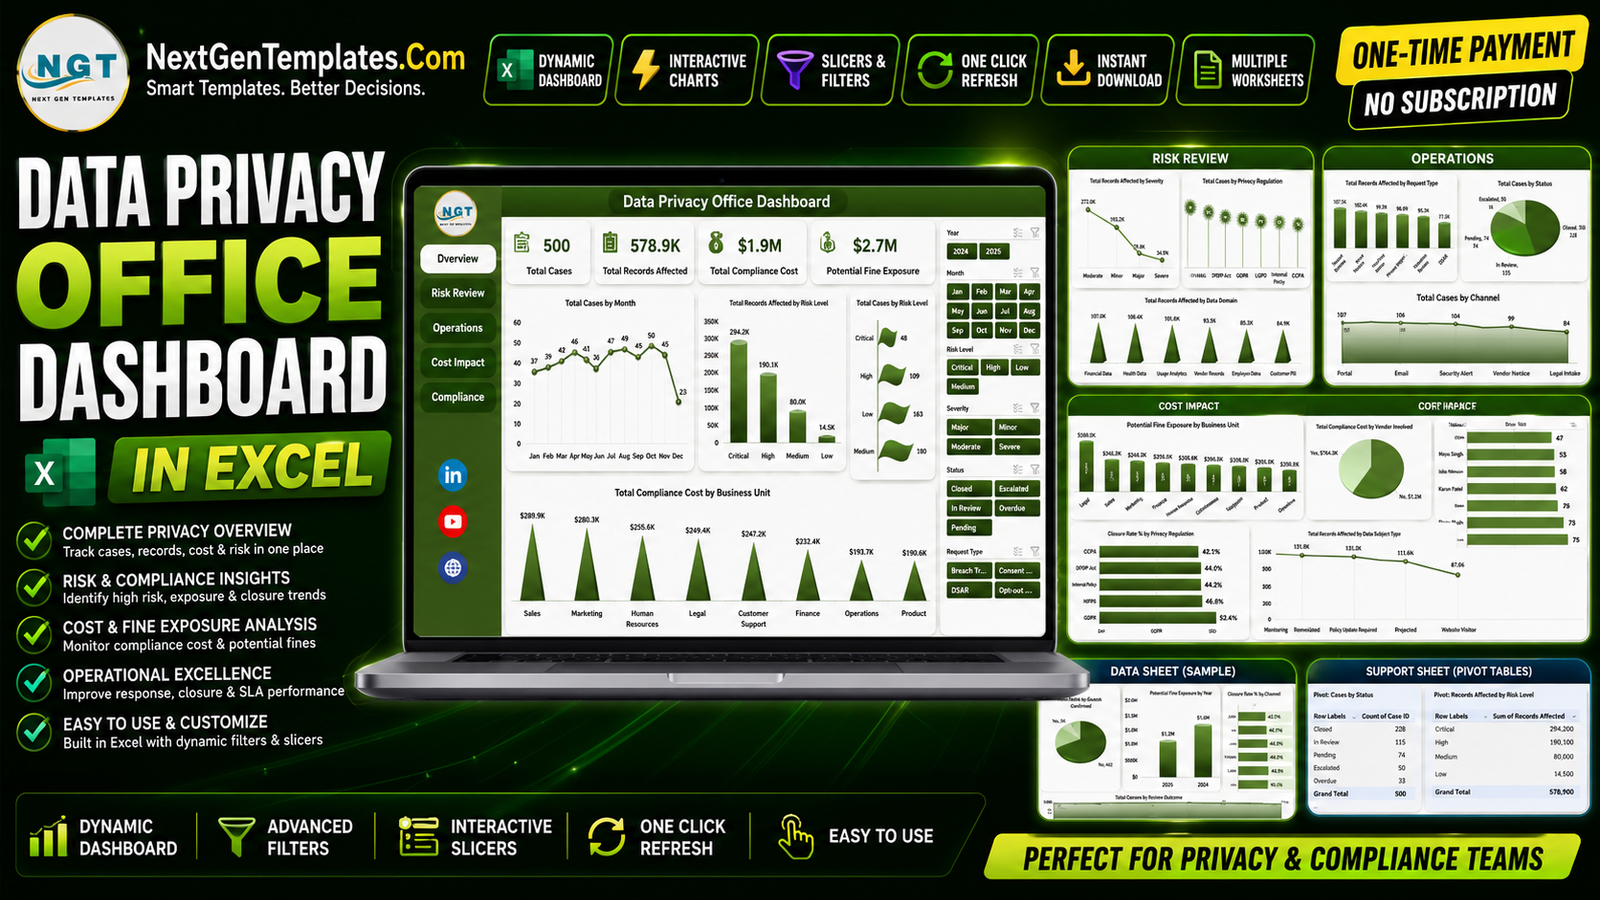

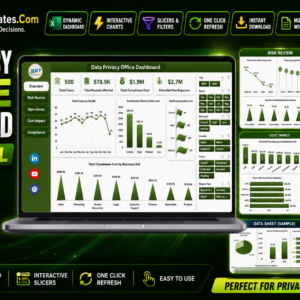
The Data Privacy Office Dashboard in Excel tracks 5 headline KPIs across 5 interactive pages, with 20+ pre-built charts and slicer-driven filters spanning risk level, privacy regulation, request type, business unit, and region. Setup takes under 10 minutes — replace the sample data on the Data sheet, click Refresh All, and every chart, KPI card, and pivot table updates automatically.
🌍 Join 8,400+ teams in 40+ countries using NextGenTemplates to replace expensive privacy and GRC SaaS subscriptions with one-time-purchase Excel dashboard templates, Google Sheets, and Power BI tools.
Data Privacy Office Dashboard in Excel
✅ Instant download · One-time payment · No subscription · No per-user fees · Lifetime access
🔑 Key Features of the Data Privacy Office Dashboard in Excel
Built for the Data Protection Officer (DPO) and privacy team, this dashboard turns a messy case log into one connected view of every privacy incident, data subject request, and breach in the organisation.
🔹 5 executive KPI cards – Total Cases, Total Records Affected, Total Compliance Cost, Potential Fine Exposure, and Closed Cases sit across the top of the Overview so leadership reads privacy posture in seconds.
🔹 20+ pre-built charts – the workbook ships with 20 charts across five pages, covering cases by month, risk level, regulation, owner, region, channel, vendor, and data domain.
🔹 Slicer-driven filtering – click any slicer (risk level, regulation, business unit, status) and the whole page filters instantly, with no formulas to touch.
🔹 Multi-regulation coverage – track case volume and closure rate for GDPR, CCPA, HIPAA, and other frameworks side by side.
🔹 Fine-exposure modelling – quantify Potential Fine Exposure by business unit and by year so regulatory risk is shown in currency, not guesswork.
🔹 Closure-rate analytics – monitor Closure Rate % by regulation and by channel to prove cases are resolved on time.
🔹 Pivot-powered engine – a hidden Support sheet holds every pivot table; update the Data sheet and Refresh All rebuilds the entire dashboard.
🔹 No-fuss compatibility – works in Microsoft Excel 2016, 2019, 2021, and Microsoft 365 with no macros, no add-ins, and no internet connection.
📦 What’s Inside the Data Privacy Office Dashboard in Excel
The workbook is organised into five report pages, a Data sheet for your records, and a hidden Support sheet that powers the visuals.
1. Overview Page
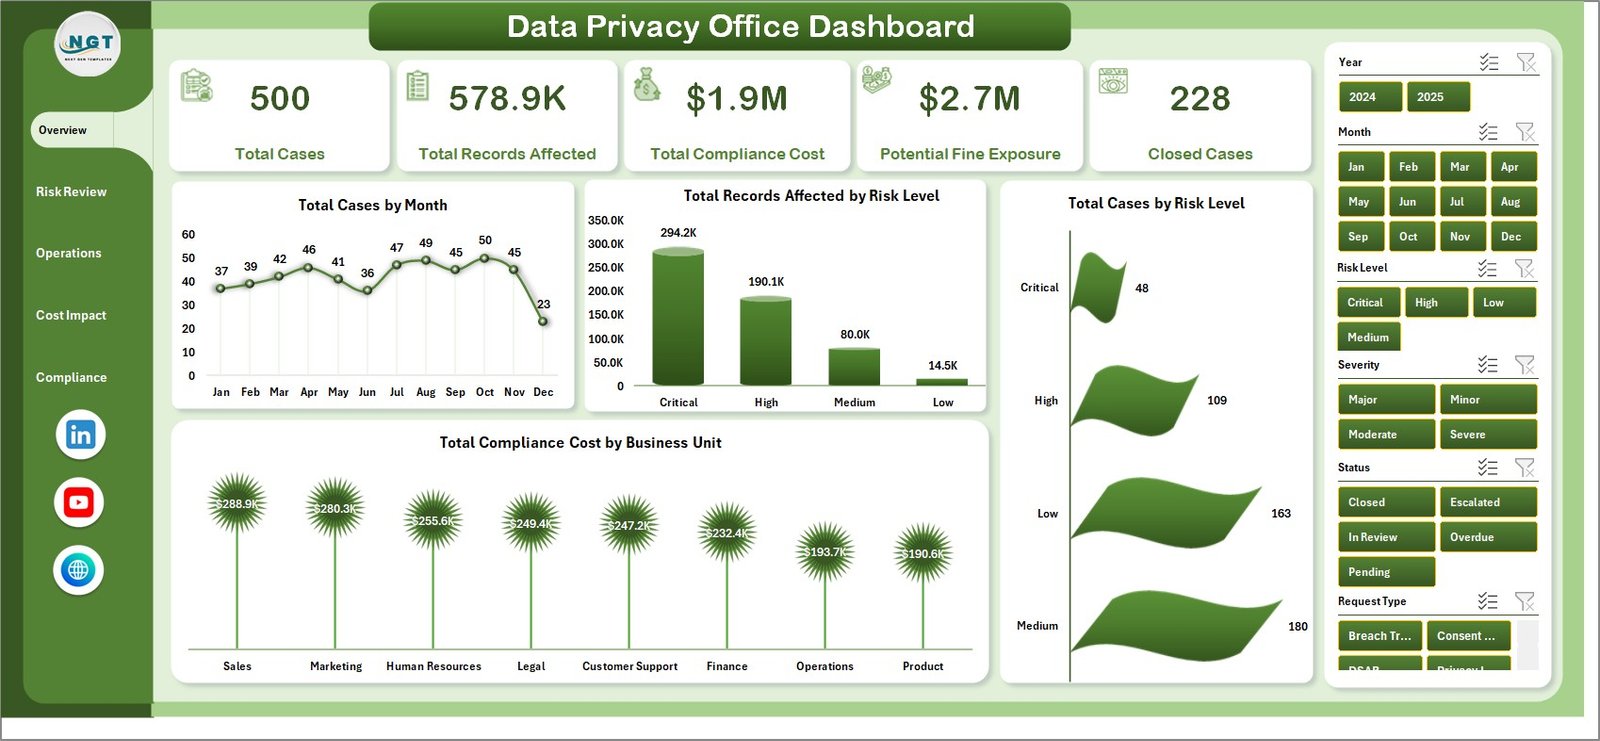
The Overview opens with five KPI cards — Total Cases, Total Records Affected, Total Compliance Cost, Potential Fine Exposure, and Closed Cases — followed by four charts and a row of slicers. Total Cases by Month plots case volume over time so you can spot spikes in breaches or data subject requests. Total Records Affected by Risk Level shows how much personal data sits behind low, medium, high, and critical cases. Total Cases by Risk Level reveals how much of the workload is high-risk, while Total Compliance Cost by Business Unit highlights which units drive the most privacy spend.
2. Risk Review
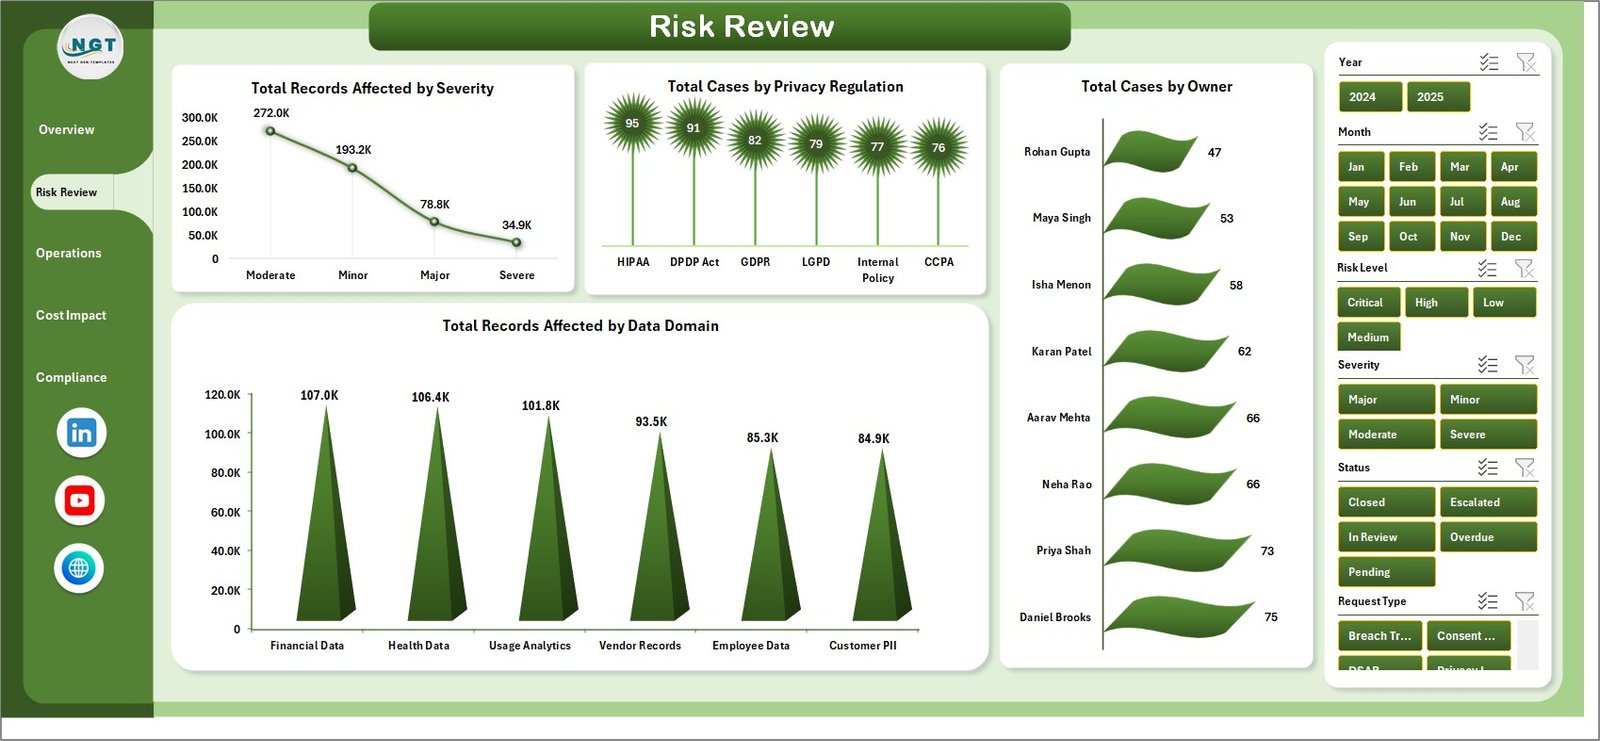
The Risk Review page profiles where privacy risk concentrates. It includes Total Records Affected by Severity, Total Cases by Privacy Regulation, Total Cases by Owner, and Total Records Affected by Data Domain — so you can see which regulations, owners, and data domains carry the heaviest exposure.
3. Operations
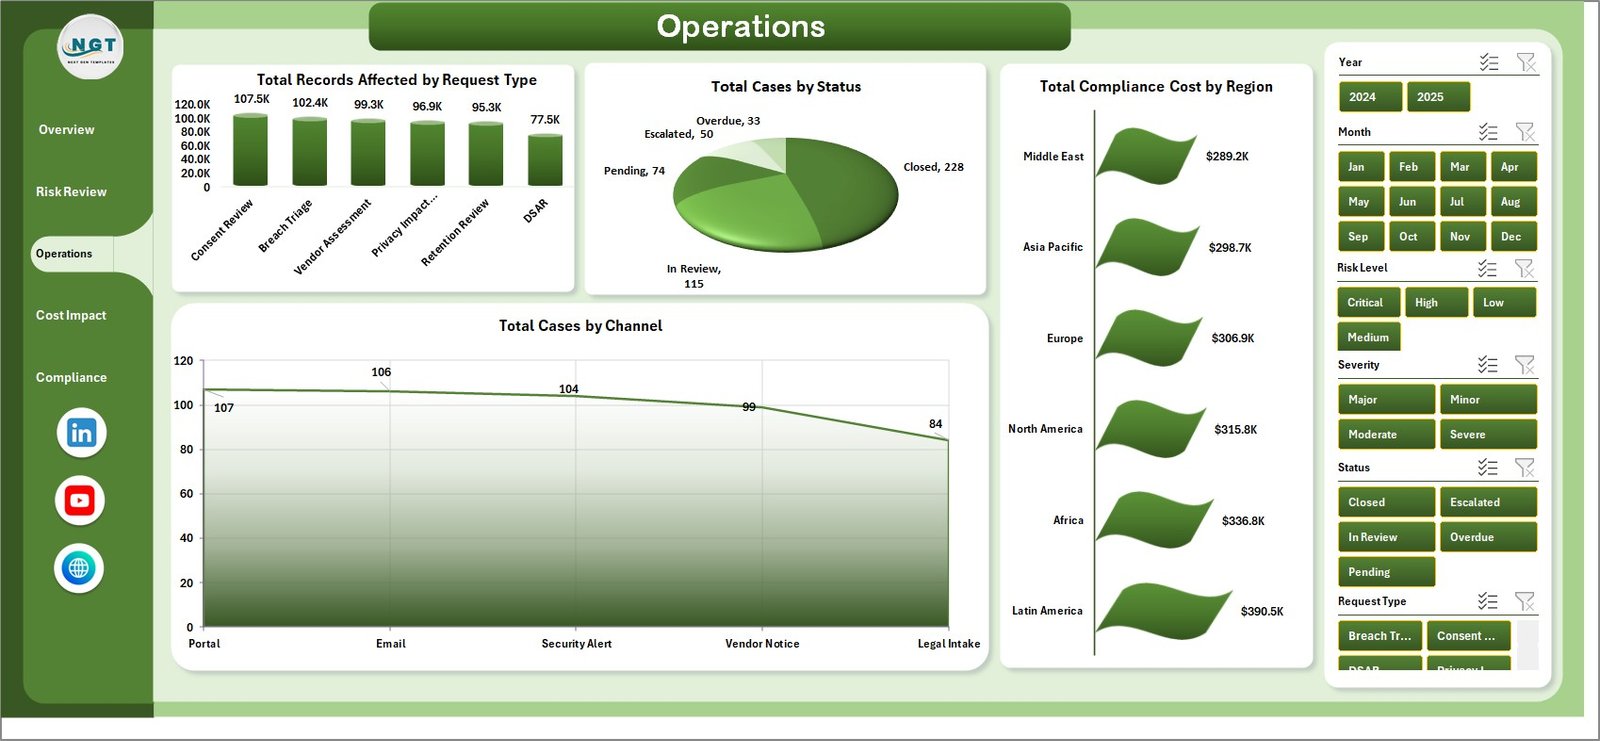
The Operations page tracks day-to-day case handling with Total Records Affected by Request Type, Total Cases by Status, Total Compliance Cost by Region, and Total Cases by Channel — making it easy to see request mix, open versus closed status, regional spend, and how cases arrive.
4. Cost Impact
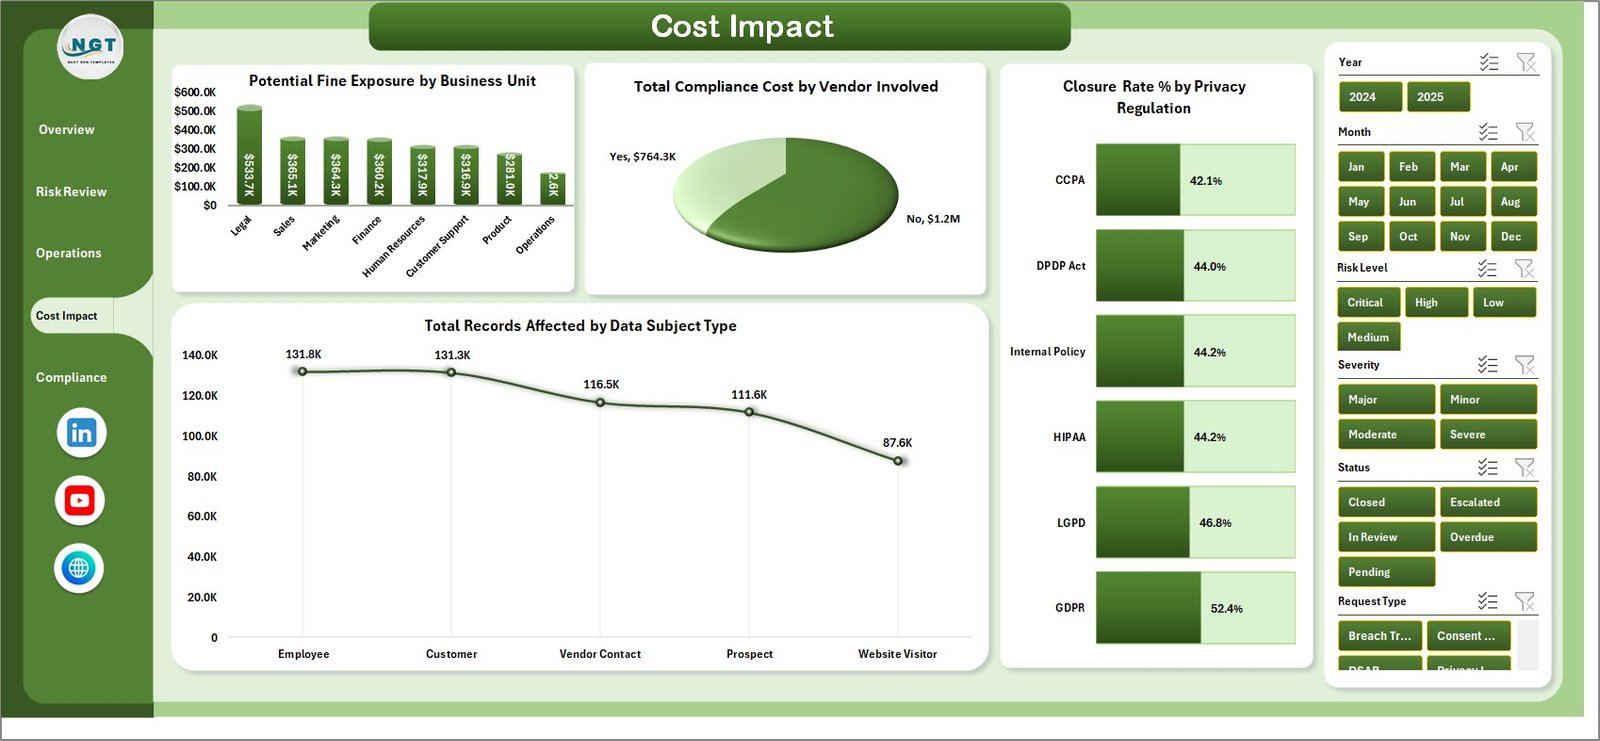
The Cost Impact page connects privacy work to money. It shows Potential Fine Exposure by Business Unit, Total Compliance Cost by Vendor Involved, Closure Rate % by Privacy Regulation, and Total Records Affected by Data Subject Type — so finance and legal can weigh fine risk against spend and resolution speed.
5. Compliance
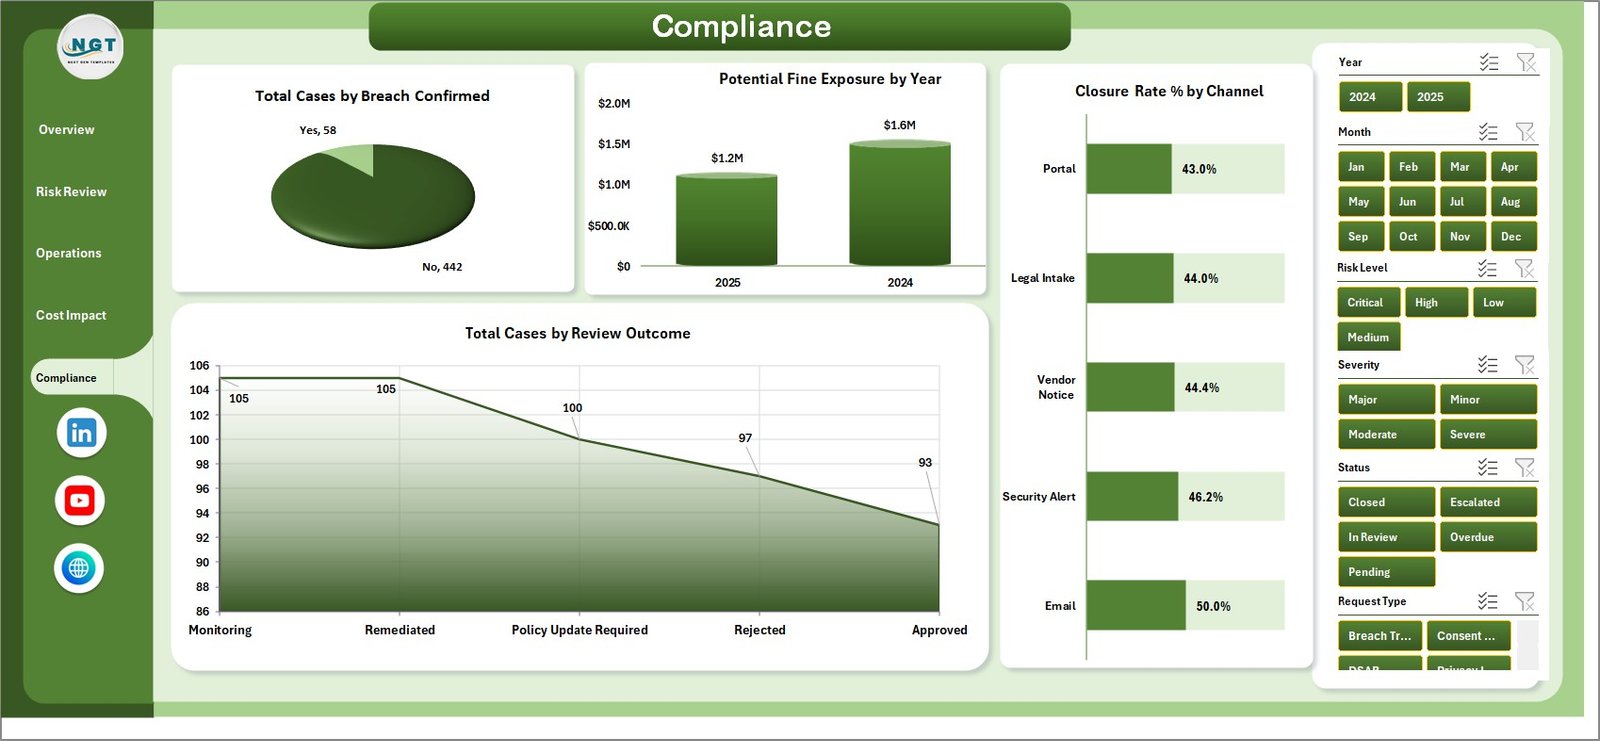
The Compliance page summarises regulatory standing with Total Cases by Breach Confirmed, Potential Fine Exposure by Year, Closure Rate % by Channel, and Total Cases by Review Outcome — a board-ready view of confirmed breaches, multi-year fine exposure, and review results.
6. Data Sheet
The Data sheet is where your records live. Keep the column structure as supplied, paste your own privacy cases into the same format, and the dashboard picks them up on the next refresh.

7. Support Sheet
The Support sheet holds the pivot tables that build every chart and KPI. After updating the Data sheet, open the Data tab in the Excel ribbon and click Refresh All to rebuild the pivots and visuals. You can keep this sheet hidden in daily use.

📊 Data Privacy Office Dashboard vs. Google Sheets vs. Paid Privacy SaaS — Where This Fits
Here is how this Excel template compares to a Google Sheets build and to enterprise privacy platforms such as OneTrust or TrustArc:
| Feature | Data Privacy Office Dashboard (Excel) | Google Sheets Version | OneTrust / TrustArc |
|---|---|---|---|
| Cost | $17.99 one-time | $9.99 one-time | $15,000+ / year |
| Platform | Microsoft Excel (offline) | Google Sheets (cloud) | Web SaaS |
| Setup time | Under 10 minutes | Under 10 minutes | Weeks of onboarding |
| DSAR & breach tracking | Built in | Built in | Yes |
| Fine-exposure modelling | By unit & year | Yes | Yes |
| Real-time team collaboration | Via shared drive / OneDrive | Native | Native |
| Mobile access | Excel mobile app | Browser | App |
| Customizable fields | Fully editable | Fully editable | Limited / paid |
| Year-1 cost at 5 users | $17.99 total | $9.99 total | $15,000+ |
For privacy teams that want DSAR, breach, and fine-exposure tracking without a five-figure GRC contract, the Data Privacy Office Dashboard in Excel sits in the sweet spot.
👥 Who This Template Is For — and Who It’s Not For
✅ This template is built for:
- Data Protection Officers and privacy managers at small and mid-sized companies (10–1,000 staff) who need a clear privacy overview without enterprise software.
- Compliance, legal, and InfoSec teams tracking GDPR, CCPA, or HIPAA cases in spreadsheets today.
- Consultants and DPO-as-a-service providers who report privacy posture to multiple clients.
❌ This template is NOT for:
- Enterprises that need automated data discovery, consent management, or SOC 2 / SSO-grade tooling — a platform like OneTrust fits better.
- Teams wanting a fully cloud-native, multi-user workflow with audit logging — consider the Data Privacy KPI Scorecard or a Google Sheets build instead.
- Users who need real-time API integrations with ticketing or DSAR-intake systems.
⚙️ How to Use the Data Privacy Office Dashboard in Excel
1. Download and unzip the file, then open it in Microsoft Excel (2016 or later).
2. Go to the Data sheet and replace the sample rows with your own privacy cases, keeping the same column headings.
3. Open the Data tab in the Excel ribbon and click Refresh All to rebuild every pivot table.
4. Use the slicers on each page to filter by risk level, regulation, business unit, or status.
5. Review the Overview, Risk Review, Operations, Cost Impact, and Compliance pages for reporting.
💼 Real-World Use Cases
Priya is a DPO at a 250-person fintech. She logs every data subject request and breach in the Data sheet, then uses the Compliance page to show her board confirmed breaches and Potential Fine Exposure by Year — without paying for OneTrust.
Marcus runs InfoSec at a healthcare provider. He filters the Risk Review page by HIPAA to see records affected by severity and data domain, helping him prioritise the highest-risk cases first.
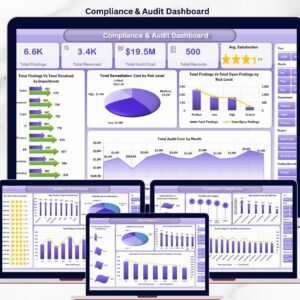
Lena is an independent privacy consultant. She keeps one workbook per client, updates the Data sheet monthly, and hits Refresh All to produce a polished privacy report in minutes. She also cross-checks audit items with the Compliance and Audit Dashboard.
❓ Frequently Asked Questions
What KPIs does the Data Privacy Office Dashboard in Excel track?
The Data Privacy Office Dashboard tracks 5 headline KPIs — Total Cases, Total Records Affected, Total Compliance Cost, Potential Fine Exposure, and Closed Cases — plus 20+ supporting charts across risk, operations, cost, and compliance views.
Which privacy regulations does it support?
The dashboard breaks down cases and closure rate by privacy regulation, so you can monitor GDPR, CCPA, HIPAA, and other frameworks side by side. You can rename or add regulations on the Data sheet to match your own program.
How long does setup take?
Setup takes under 10 minutes. Paste your records into the Data sheet using the existing columns, click Refresh All on the Data tab, and the Data Privacy Office Dashboard rebuilds every chart and KPI automatically.
How does this compare to OneTrust or TrustArc?
OneTrust and TrustArc are powerful enterprise GRC platforms that start around $15,000 per year. The Data Privacy Office Dashboard in Excel is a $17.99 one-time purchase that covers DSAR, breach, and fine-exposure tracking for small and mid-sized teams.
Do I need macros or an internet connection?
No. The Data Privacy Office Dashboard runs on standard Excel pivot tables and charts with no macros or add-ins, and it works fully offline in Excel 2016, 2019, 2021, and Microsoft 365.
Can I customise the fields and charts?
Yes. Every column, chart, and slicer is fully editable. Add your own data domains, business units, or regulations on the Data sheet and refresh to update the visuals.
👤 About the Author
Built by PK — Microsoft Certified Professional with 15+ years of Excel, Google Sheets, and Power BI experience. Founder of NextGenTemplates, reaching 300K+ subscribers across YouTube channels (@PK-AnExcelExpert, @NextGenTemplates, @NeoTechNavigators). Every template is hand-built and tested before release. Data Privacy Office Dashboard in Excel
🔗 Explore Related Templates
🔹 Data Privacy KPI Scorecard in Excel — a compact scorecard view of your privacy metrics.
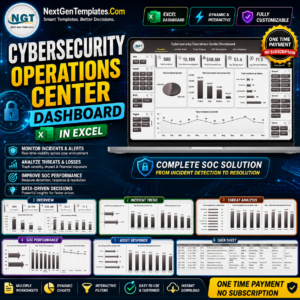
🔹 Cybersecurity Operations Center Dashboard in Excel — monitor security incidents alongside privacy cases.
🔹 IT Security Auditing KPI Dashboard in Excel — track audit findings and remediation.
🔹 Browse all Excel Dashboard Templates.
📖 Click here to read the detailed blog post
🎥 Visit our YouTube channel for step-by-step video tutorials
👉 YouTube.com/@NextGenTemplates
📅 Last updated: May 2026
































Reviews
There are no reviews yet.