

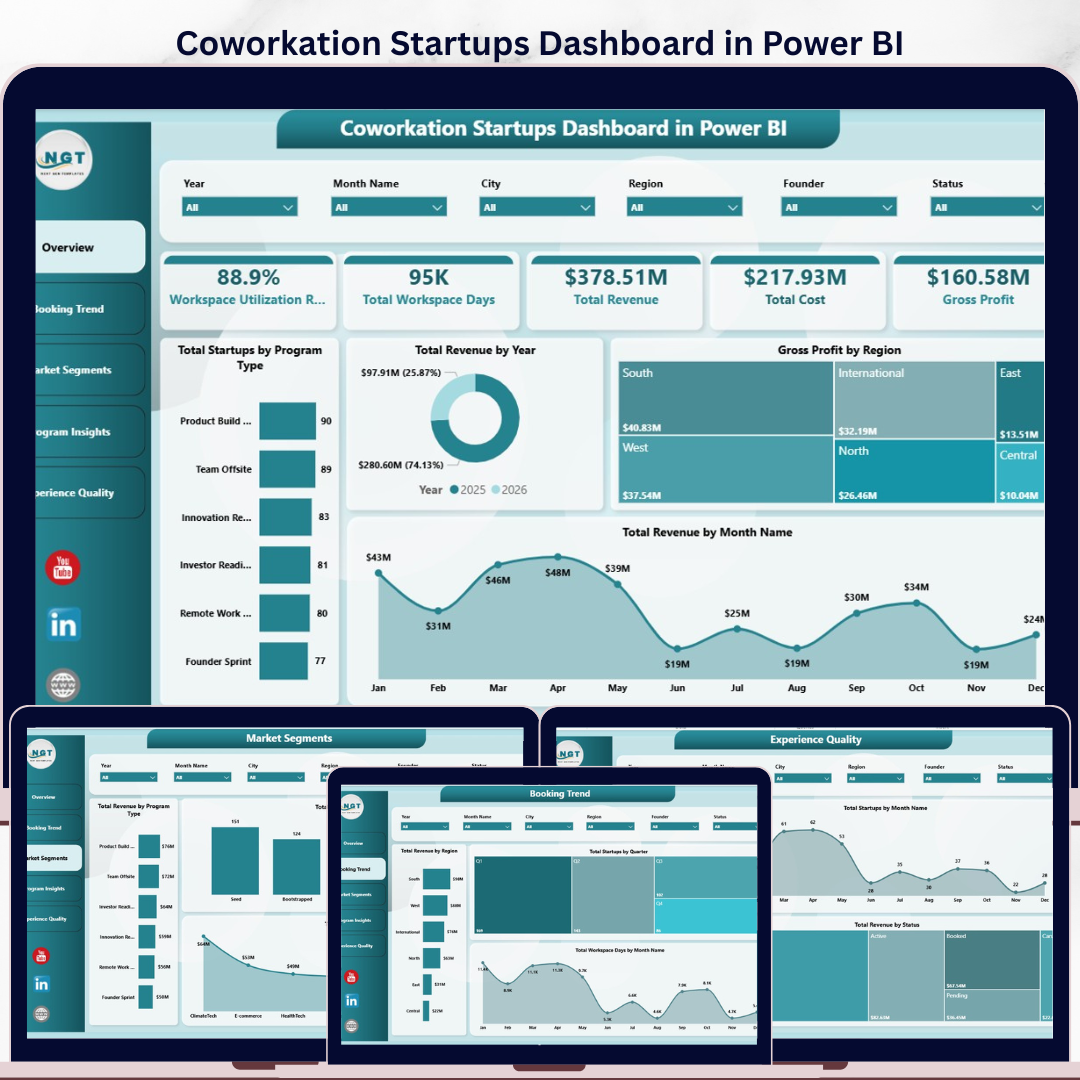

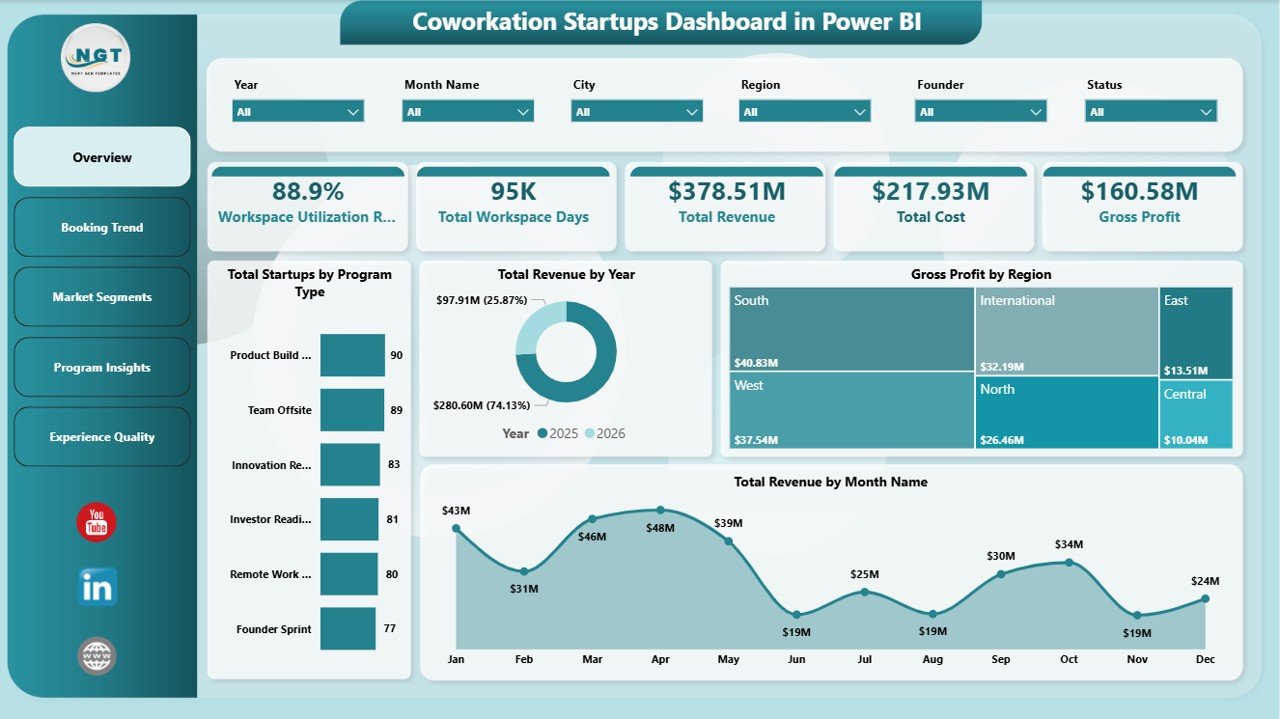
The Coworkation Startups Dashboard in Power BI gives coworkation hubs, startup programs, and accelerator operators a 5-page PBIX reporting system for revenue, cost, gross profit, workspace days, startup volume, utilization, and program experience quality. In one editable Power BI dashboard, you get 5 headline KPI cards, 5 report pages, 16+ chart views, and interactive slicers for quick filtering. Setup takes under 10 minutes in Power BI Desktop: open the PBIX file, replace the sample data or connect your source, refresh, and start presenting cleaner insights.
Join 10,000+ customers in 180+ countries using NextGenTemplates to replace recurring analytics subscriptions with one-time-purchase Excel, Google Sheets, Power BI, and HTML templates.
Instant download. One-time payment. No subscription. No per-user template fee. Lifetime access.
Key Features of Coworkation Startups Dashboard in Power BI
- 5 Power BI report pages covering Overview, Booking Trend, Market Segments, Program Insights, and Experience Quality.
- 5 KPI cards for Workspace Utilization Rate, Total Workspace Days, Total Revenue, Total Cost, and Gross Profit.
- 16+ analysis visuals covering startups, revenue, gross profit, region, month, quarter, program type, funding stage, industry, lead source, hub, status, and NPS.
- Interactive slicers to filter the dashboard by startup, program, region, hub, status, funding stage, or time period.
- Power BI Desktop compatible so users can edit visuals, DAX measures, colors, and data connections.
- Built for coworkation and startup ecosystem teams that need board-ready reporting without paying monthly SaaS fees.
What’s Inside the Coworkation Startups Dashboard in Power BI
1. Overview Page
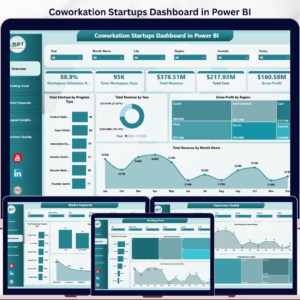
The Overview page gives leadership a fast read on the full coworkation operation. KPI cards show Workspace Utilization Rate, Total Workspace Days, Total Revenue, Total Cost, and Gross Profit.
Total Startups by Program Type: This chart shows which coworkation programs attract the most startups, making it easier to compare residencies, accelerators, retreats, and other program formats.
Total Revenue by Year: This yearly revenue view helps leadership understand long-term commercial movement and identify whether the coworkation model is scaling.
Gross Profit by Region: This chart compares profitability across regions so managers can see where revenue is translating into stronger margins.
Total Revenue by Month Name: The monthly revenue trend highlights seasonality, booking cycles, and months that need closer sales or partnership attention.
2. Booking Trend
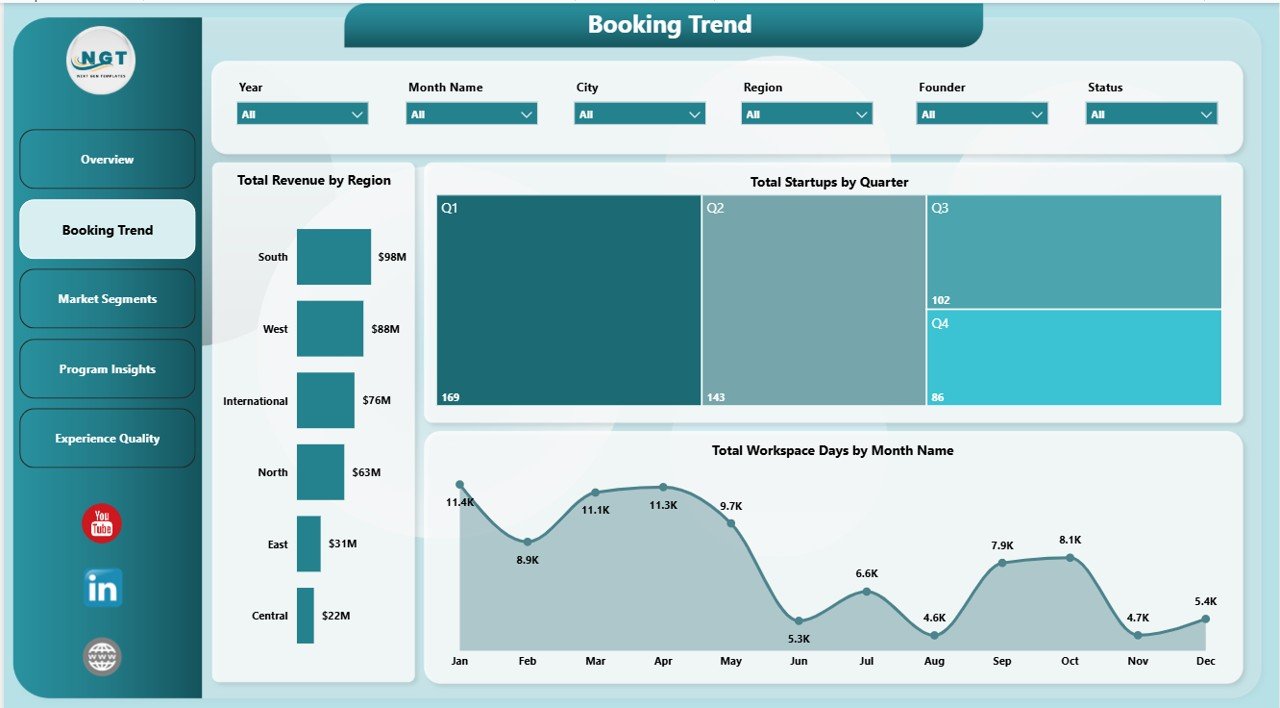
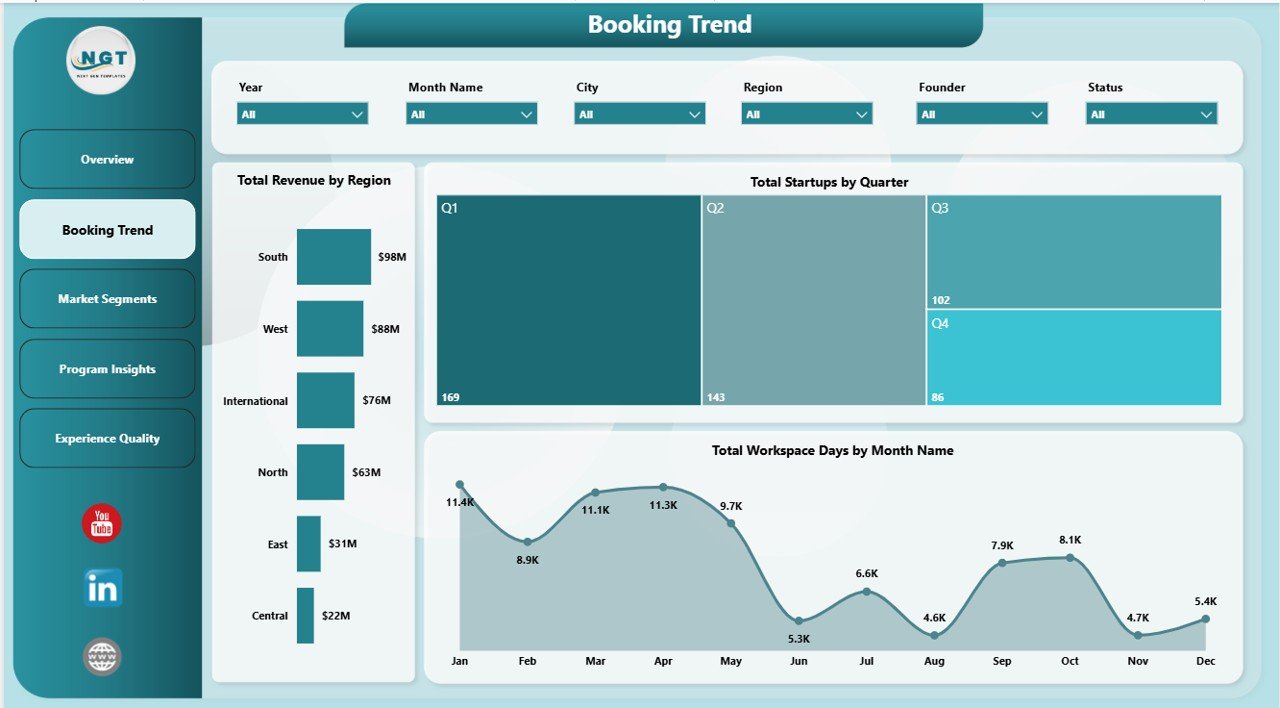
The Booking Trend page focuses on how revenue, startup count, and workspace usage move across regions and time. Total Revenue by Region highlights the strongest markets. Total Startups by Quarter shows booking momentum across the year. Total Workspace Days by Month Name reveals seasonality in workspace demand and helps teams plan hub capacity.
3. Market Segments
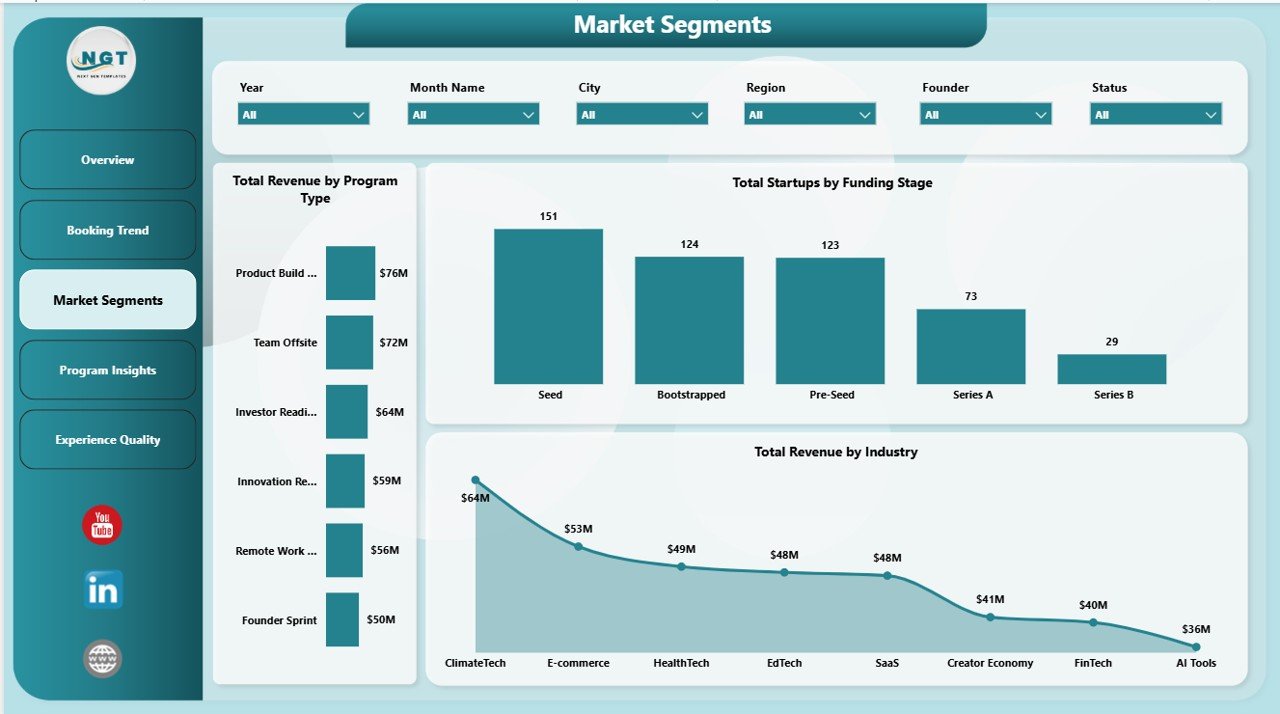
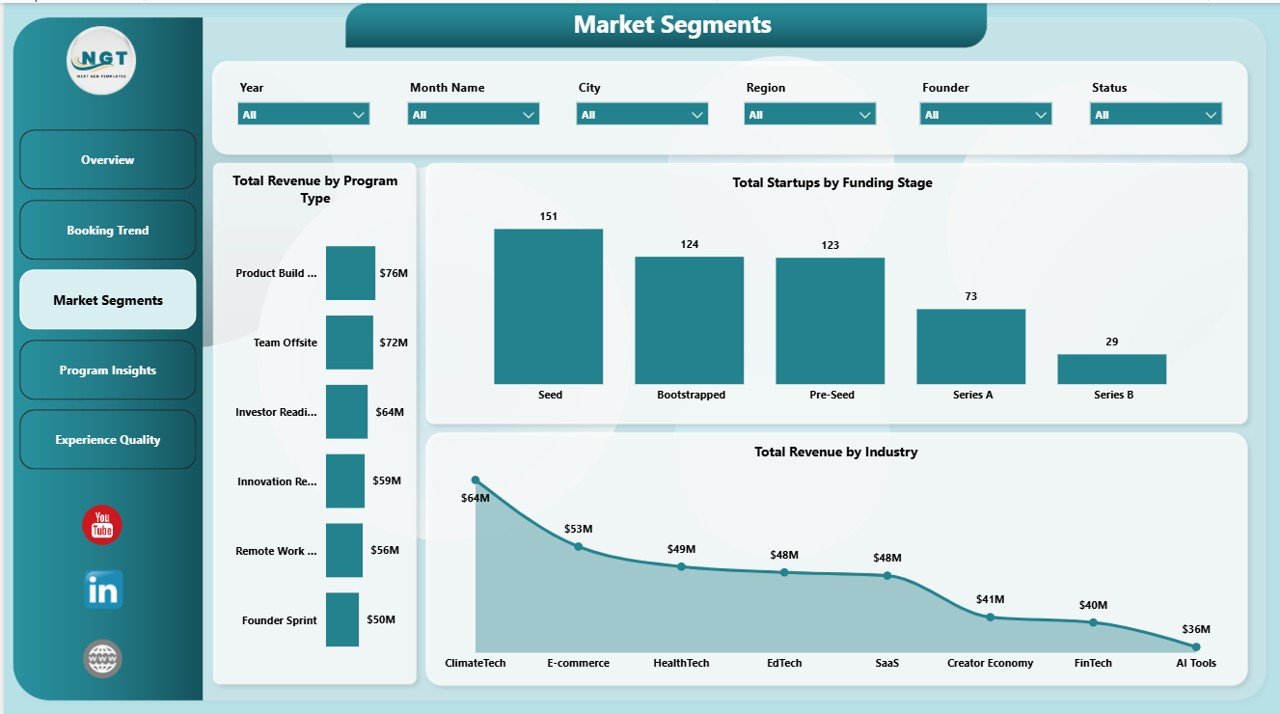
The Market Segments page shows which startup profiles, industries, and program types contribute most to revenue. Total Revenue by Program Type identifies high-value program formats. Total Startups by Funding Stage shows whether the hub serves early, growth, or later-stage companies. Total Revenue by Industry helps teams refine positioning, partnerships, and outreach.
4. Program Insights
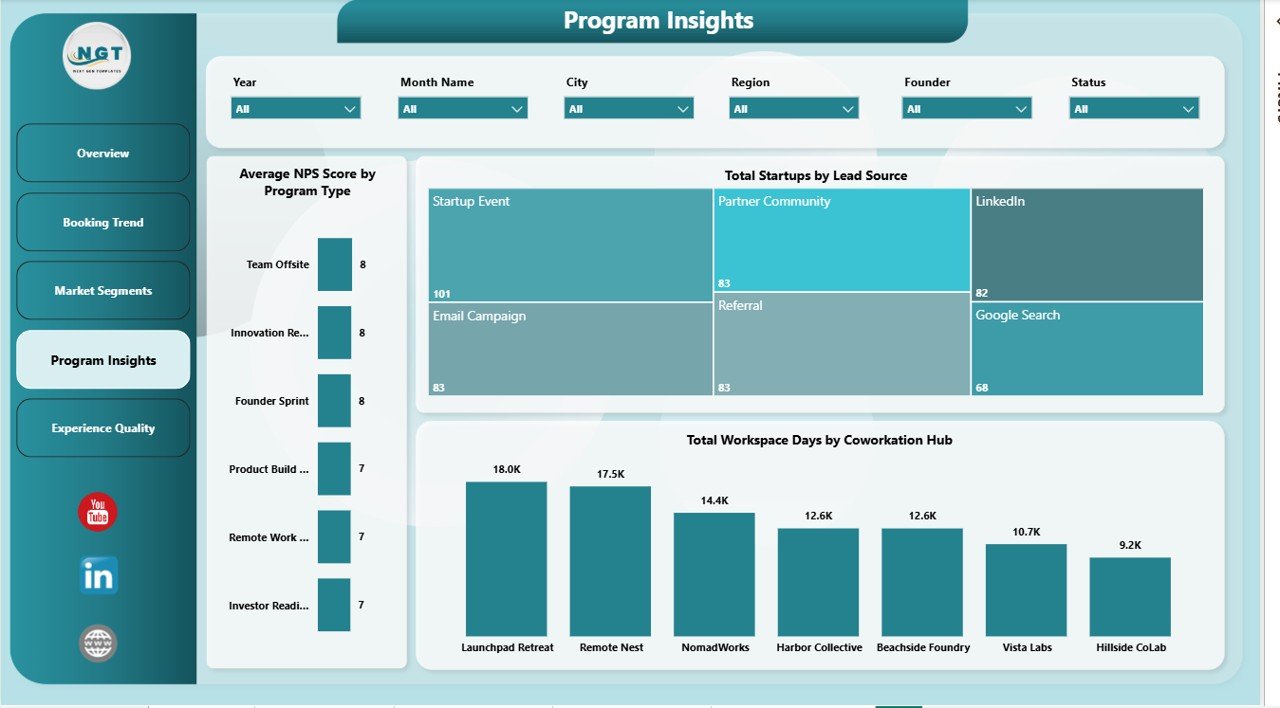
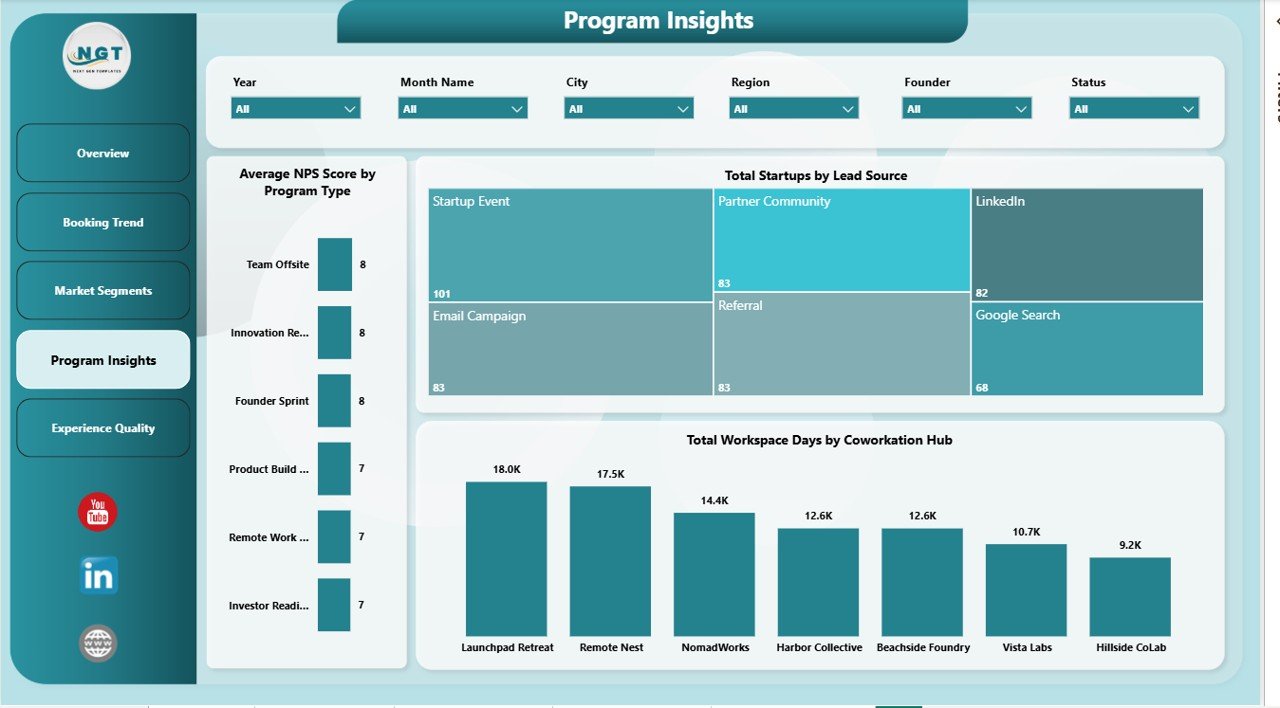
The Program Insights page connects participant experience, lead generation, and hub usage. Average NPS Score by Program Type shows which programs create stronger satisfaction. Total Startups by Lead Source reveals which acquisition channels bring the most startup participants. Total Workspace Days by Coworkation Hub compares hub-level usage for operational planning.
5. Experience Quality
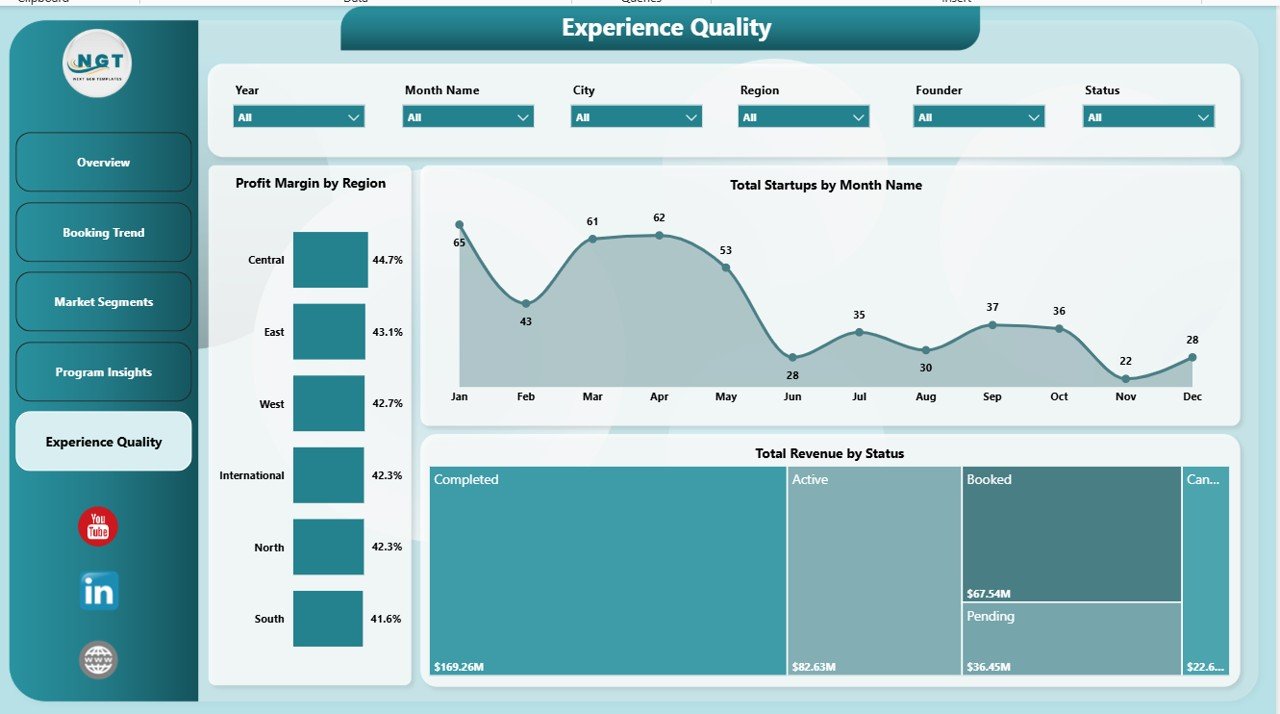
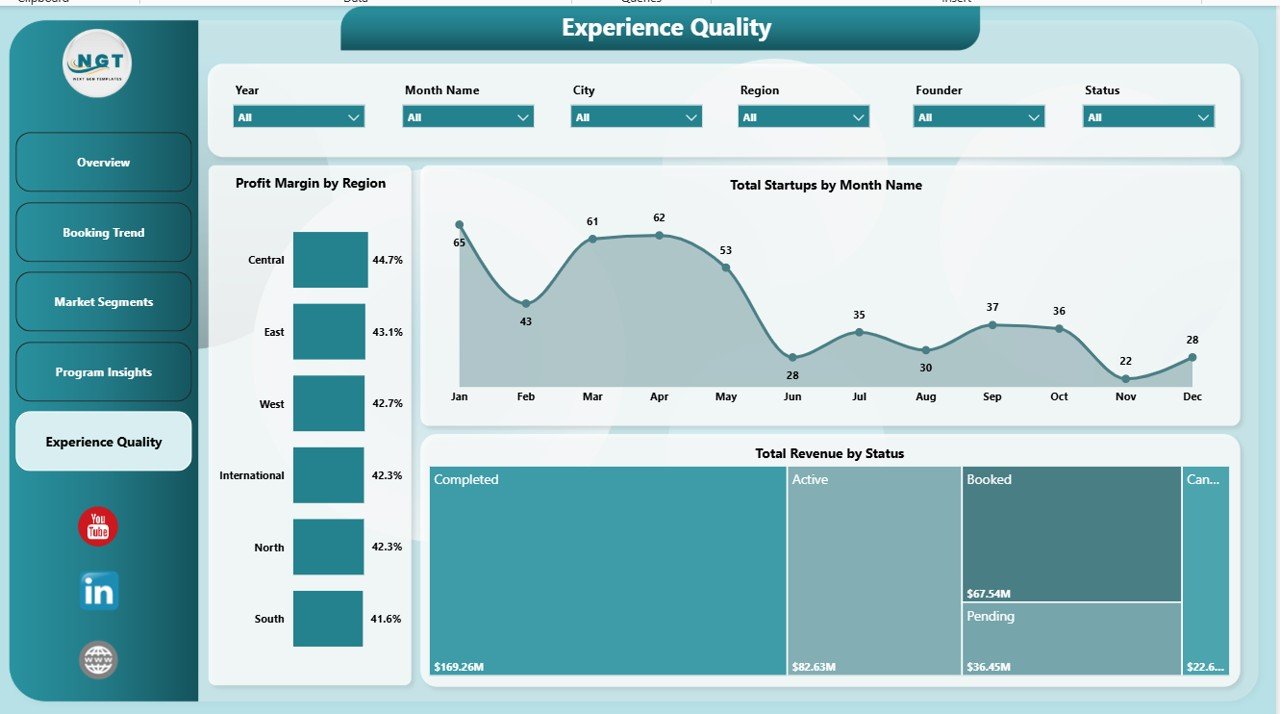
The Experience Quality page ties profitability, startup movement, and status tracking together. Profit Margin by Region shows where the operation creates the strongest return. Total Startups by Month Name highlights participation trends. Total Revenue by Status shows how much revenue is attached to active, completed, or other program states.
Coworkation Startups Dashboard in Power BI vs. Tableau vs. Paid Coworking SaaS – Where This Fits
| Feature | This Power BI Dashboard | Tableau Alternative | Paid SaaS Alternative |
|---|---|---|---|
| Cost | $17.99 one-time | License or build cost | $50-$200+ per month |
| Platform | Power BI Desktop and Service | Tableau Desktop or Cloud | Vendor web app |
| Setup time | Under 10 minutes after data mapping | Depends on workbook build | Days of onboarding |
| Visual interactivity | Cross-filtering, slicers, editable visuals | Strong visual analysis | Often fixed reports |
| Customizable fields | Editable PBIX model and measures | Editable with Tableau skills | Limited by vendor plan |
| Year-1 cost at 5 users | $17.99 plus existing Microsoft licensing | Can increase with licenses | $600-$2,400+ |
Who This Template Is For – and Who It’s Not For
This template is for coworkation hub managers, accelerator operators, startup program teams, coworking space analysts, venture studio operations teams, and founders who want a Power BI reporting layer for revenue, utilization, startup mix, program quality, and regional performance.
It is not a booking engine, CRM, billing platform, or live API connector package. If you need automatic member invoicing, access control, or real-time booking sync, use this dashboard as the analytics layer beside your operational system.
How to Use the Coworkation Startups Dashboard in Power BI
- Download and unzip the product file after purchase.
- Open the PBIX file in Power BI Desktop, available free from Microsoft.
- Review the sample data model, report pages, slicers, and measures.
- Replace the sample records or connect your own Excel, CSV, database, or SharePoint source.
- Refresh the report so KPI cards, charts, and filters update.
- Use the five pages for weekly operations reviews, investor updates, board reporting, or hub planning.
Real-World Use Cases
Riya, coworkation operations manager: She compares workspace utilization and gross profit by region before deciding where to add capacity for the next startup cohort.
Marco, accelerator director: He uses Market Segments and Program Insights to show investors which funding stages, industries, and lead sources create the best program outcomes.
Aisha, coworking founder: She reviews Experience Quality every month to connect NPS, revenue status, and profit margin before renewing hub partnerships.
Frequently Asked Questions
What KPIs are included?
The dashboard includes Workspace Utilization Rate, Total Workspace Days, Total Revenue, Total Cost, and Gross Profit as the top-level KPI cards.
Do I need Power BI Desktop?
Yes. Power BI Desktop is required to open and edit the PBIX file, and it is free from Microsoft.
Can I replace the sample data?
Yes. You can replace the sample records or connect your own data source through Power Query, then refresh the report.
Can I customize the visuals?
Yes. The PBIX file is editable, including visuals, colors, pages, fields, relationships, and DAX measures.
Does this include live booking software integration?
No. It is a Power BI dashboard template. You can connect Power BI to supported data sources if you have the right access and clean data structure.
Is there an Excel version?
Yes. You can also use the Coworkation Startups Dashboard in Excel if your team prefers pivot tables and workbook-based reporting.
About the Author
Built by PK – Microsoft Certified Professional with 15+ years of Excel, Google Sheets, and Power BI experience. Founder of NextGenTemplates, reaching 300K+ subscribers across YouTube channels. Every template is hand-built and tested before release.
Explore Related Templates
- Coworkation Startups Dashboard in Excel – spreadsheet version for teams that prefer Excel.
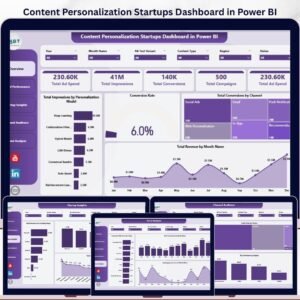
- Content Personalization Startups Dashboard in Power BI – marketing and personalization analytics for startup teams.
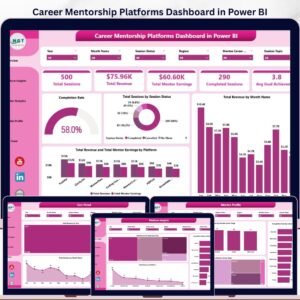
- Career Mentorship Platforms Dashboard in Power BI – mentoring platform performance analysis.
- Browse Power BI Dashboard templates.
Ready to track coworkation revenue, utilization, and startup program quality in Power BI? Download the Coworkation Startups Dashboard in Power BI and turn your program data into a clean reporting workflow.
Last updated: May 21, 2026
🔗 Click here to read the Detailed blog post
Watch the step-by-step video tutorial:
Compatibility and Requirements
- Works in Power BI Desktop, which is free from Microsoft. Download it from Get Power BI Desktop.
- You open the PBIX file, replace the sample records or connect your own Excel, CSV, database or SharePoint source, then refresh the report.
More Questions About This Template
How many report pages does the dashboard have?
Five pages: Overview, Booking Trend, Market Segments, Program Insights and Experience Quality.
Which program and startup details can I filter by?
Slicers let you filter by startup, program, region, hub, status, funding stage or time period.
Is this a booking system?
No. It is a Power BI reporting template. Use it beside your own booking, CRM or billing system and load that data into the PBIX file.
Is the Power BI version the same as the Excel one?
Both cover coworkation revenue, utilization and startup program reporting. The Power BI version is a PBIX file with slicers and cross-filtering. The Excel version is at Coworkation Startups Dashboard in Excel.



























Reviews
There are no reviews yet.