

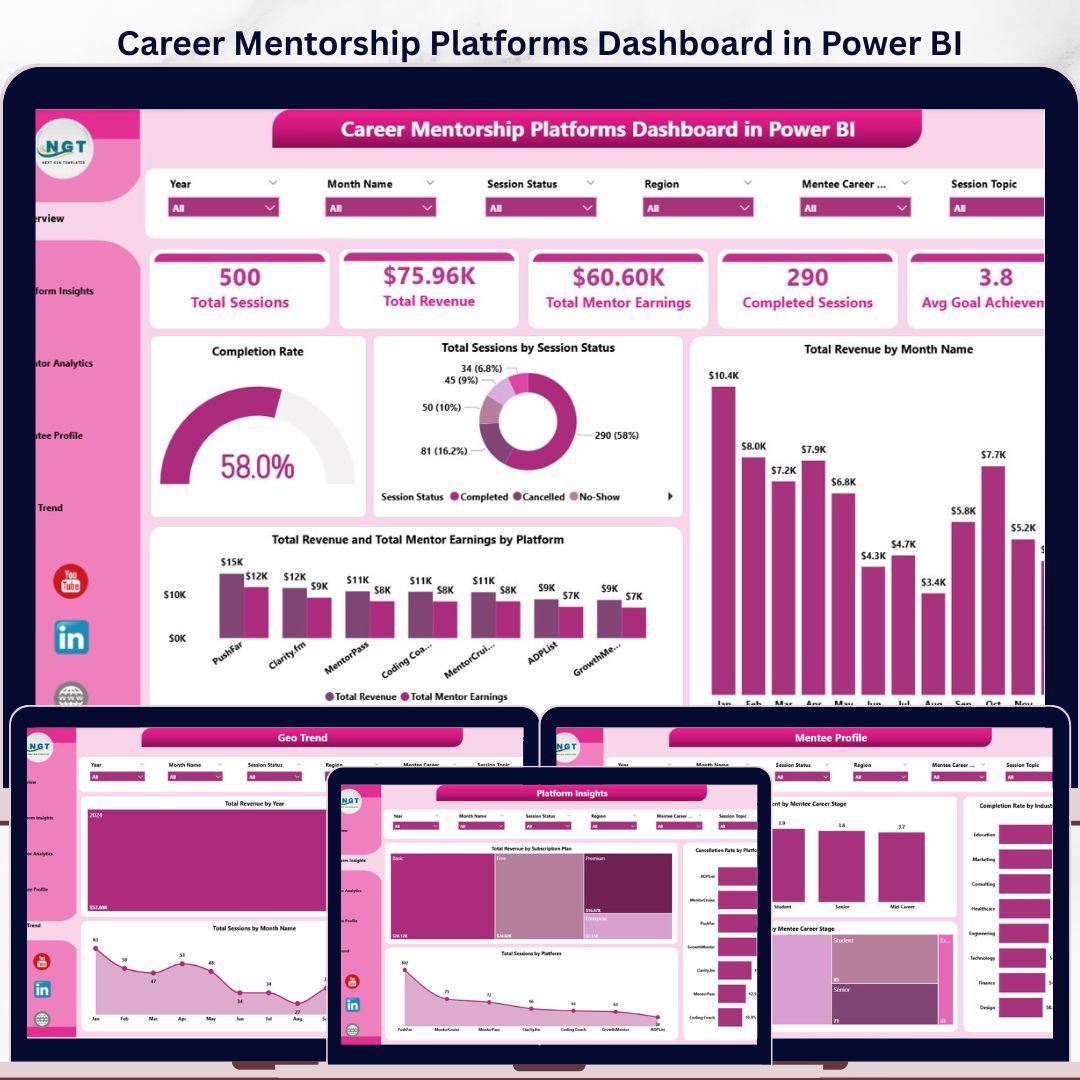

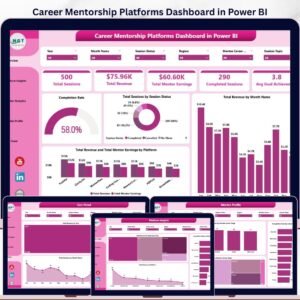
The Career Mentorship Platforms Dashboard in Power BI tracks 5 top-level KPIs and 12 analytical charts across 5 interactive report pages — covering platform performance, mentor earnings, mentee engagement, and geographic revenue trends. Whether you run a career coaching marketplace, an internal corporate mentoring program, or an EdTech platform, this. Career Mentorship Platforms Dashboard in Power BI pixy template gives you a structured, visual reporting layer without recurring SaaS fees. Setup takes under 10 minutes: connect your data source or paste sample records, and every visual updates through Power BI’s native query engine.
Join 8,400+ teams in 40+ countries using NextGenTemplates to replace paid analytics tools with one-time-purchase Power BI, Excel, Google Sheets, and HTML templates.
Instant download · One-time payment · No subscription · No per-user fees · Lifetime access
Key Features of Career Mentorship Platforms Dashboard in Power BI
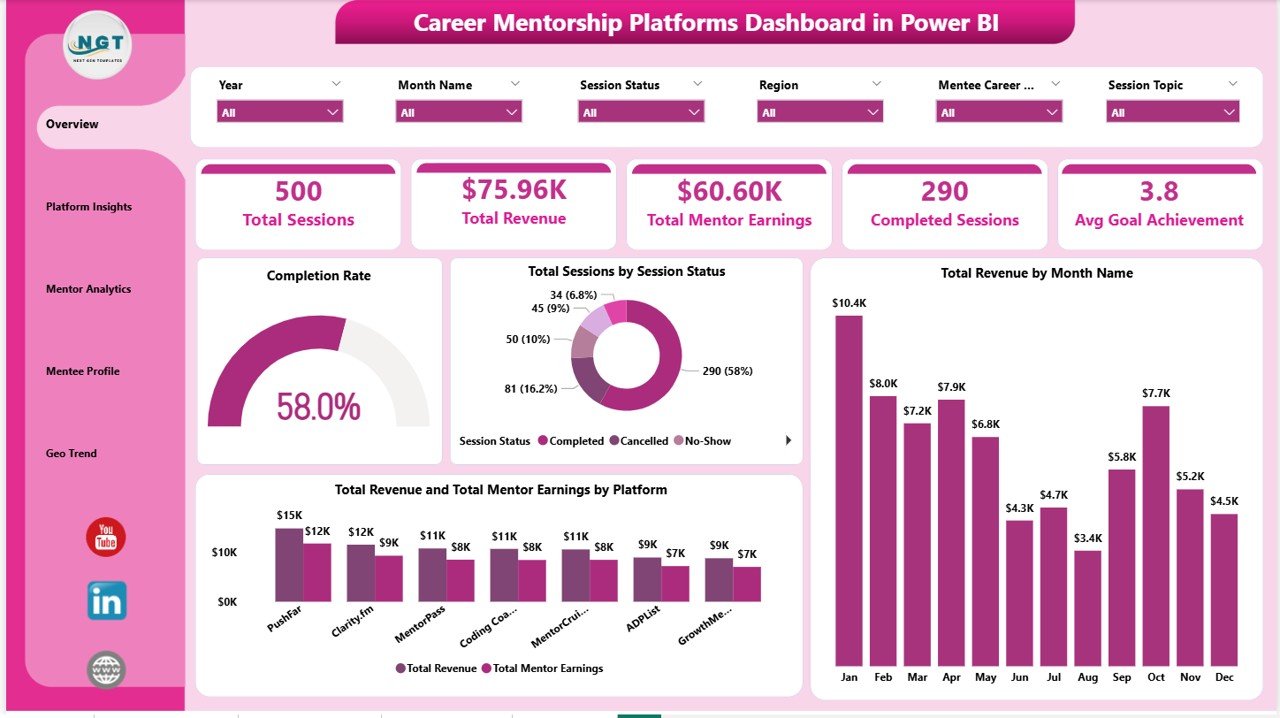
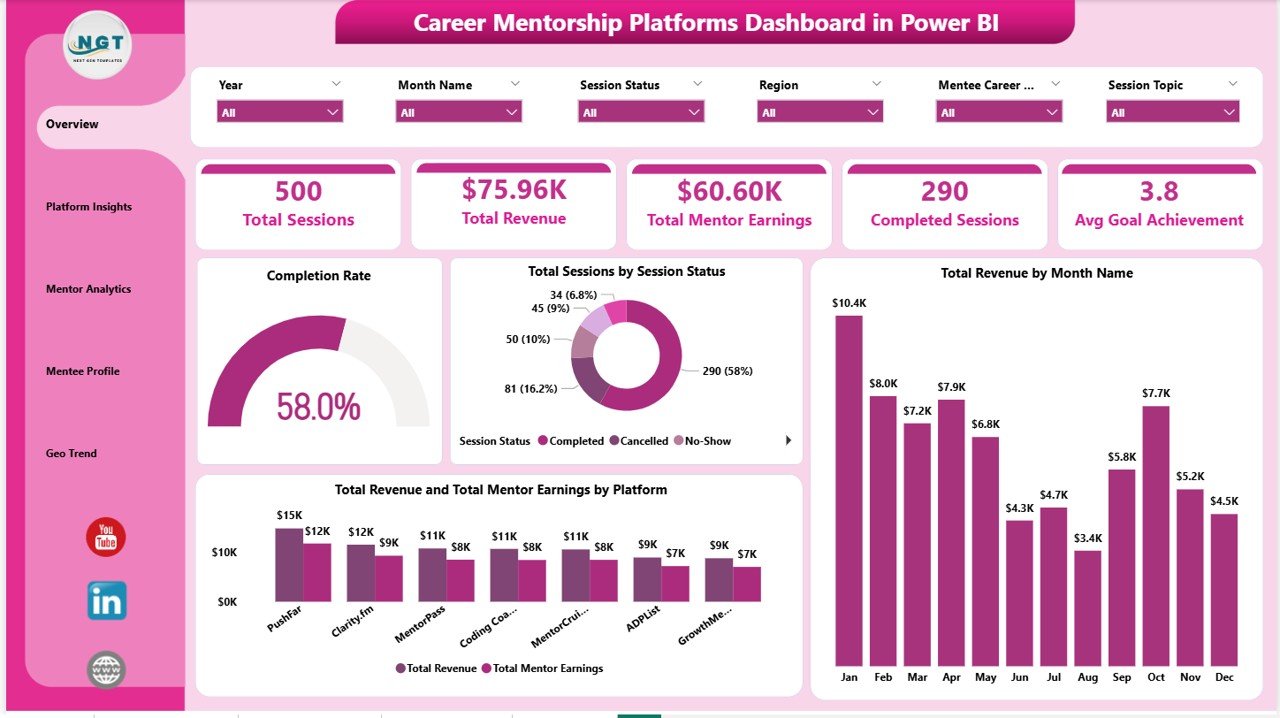
5 KPI Cards on the Overview Page — Track Total Sessions, Total Revenue, Total Mentor Earnings, Completed Sessions, and Avg Goal Achievement in one high-level snapshot that refreshes automatically when data changes.
5 Analytical Report Pages — The dashboard covers Overview, Platform Insights, Mentor Analytics, Mentee Profile, and Geo Trend — giving platform operators and HR teams a complete view of session performance from four distinct analytical angles.
12 Pre-Built Visuals — Charts include Completion Rate, Sessions by Session Status, Revenue by Month Name, Revenue and Mentor Earnings by Platform, Revenue by Subscription Plan, Cancellation Rate by Platform, Sessions by Platform, Avg Revenue Per Session by Mentor Level, Total Mentor Earnings by Mentor Level, Revenue by Session Type, Avg Goal Achievement by Mentee Career Stage, Sessions by Mentee Career Stage, Completion Rate by Industry, Revenue by Year, Revenue by Region, and Sessions by Month Name.
Interactive Slicers on Every Page — Apply filters by Platform, Session Type, Mentor Level, Subscription Plan, Region, Industry, and Career Stage without writing a single DAX expression.
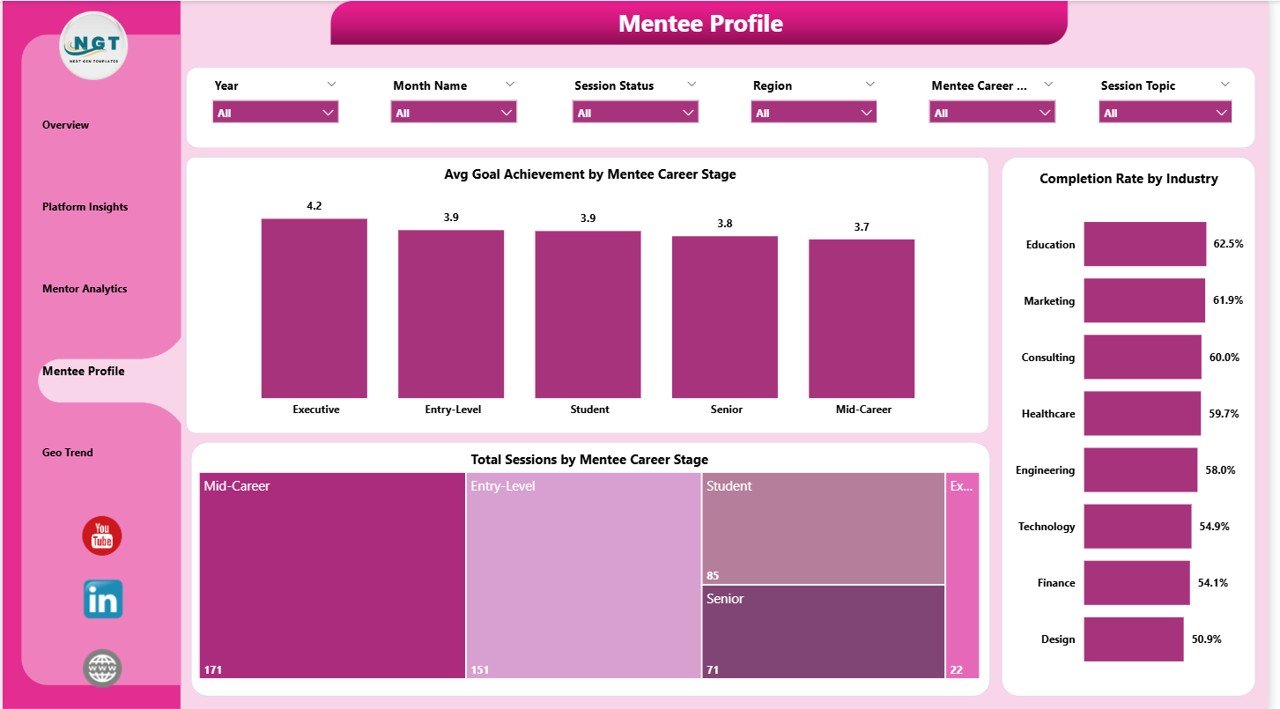
Mentee Goal and Career Stage Segmentation — The Mentee Profile page breaks down sessions and goal achievement scores by career stage and industry, helping platform analysts understand which segments drive the most value.
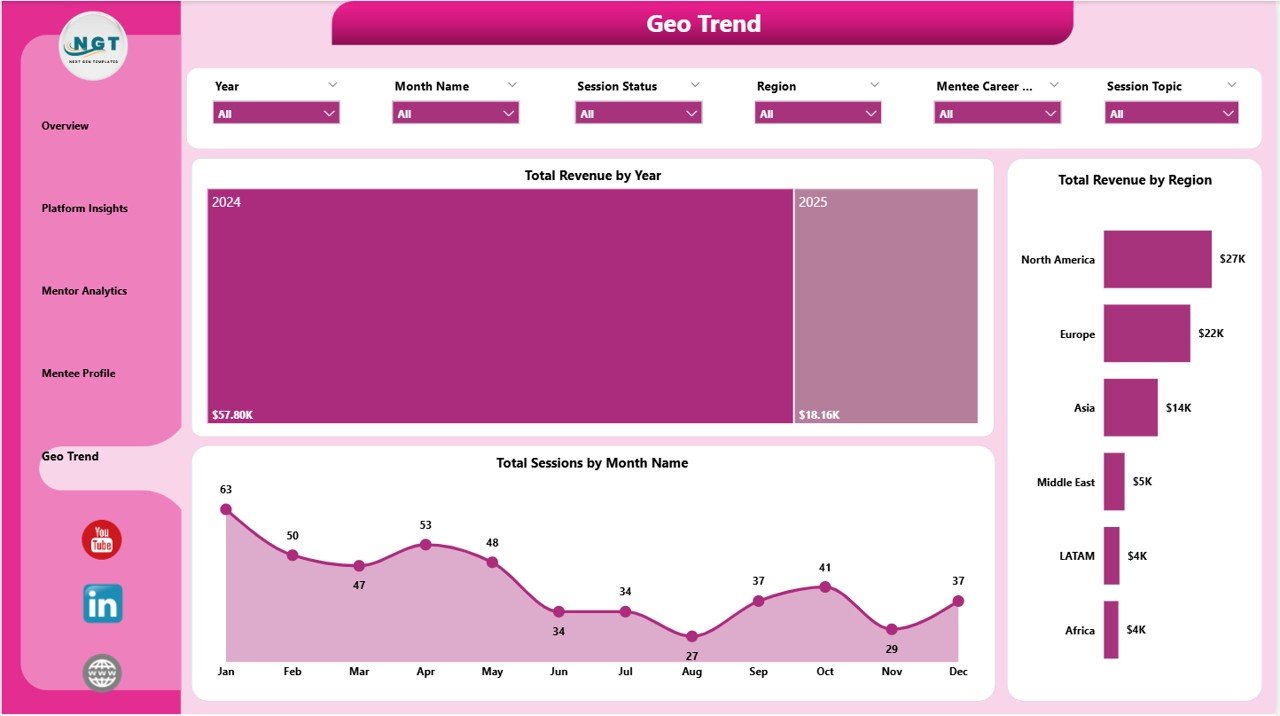
Geographic and Temporal Trend View — The Geo Trend page tracks revenue by year, region, and monthly session volume — useful for quarterly reviews, regional expansion planning, and investor reporting.
Free Power BI Desktop Compatible — The .pbix file works with Power BI Desktop, which is a free download from Microsoft. No Power BI Pro or Premium license is required to open and use the template.
What’s Inside the Career Mentorship Platforms Dashboard in Power BI
1. Overview Page
The Overview Page displays 5 KPI cards — Total Sessions, Total Revenue, Total Mentor Earnings, Completed Sessions, and Avg Goal Achievement — alongside 4 chart visuals. The Completion Rate gauge shows what percentage of booked sessions reached completion. The Total Sessions by Session Status chart breaks down sessions across statuses like Completed, Cancelled, and In Progress. Total Revenue by Month Name shows monthly revenue trend lines so operators can spot seasonal patterns. Total Revenue and Total Mentor Earnings by Platform compares platform-level revenue share and payout obligations side by side.
2. Platform Insights
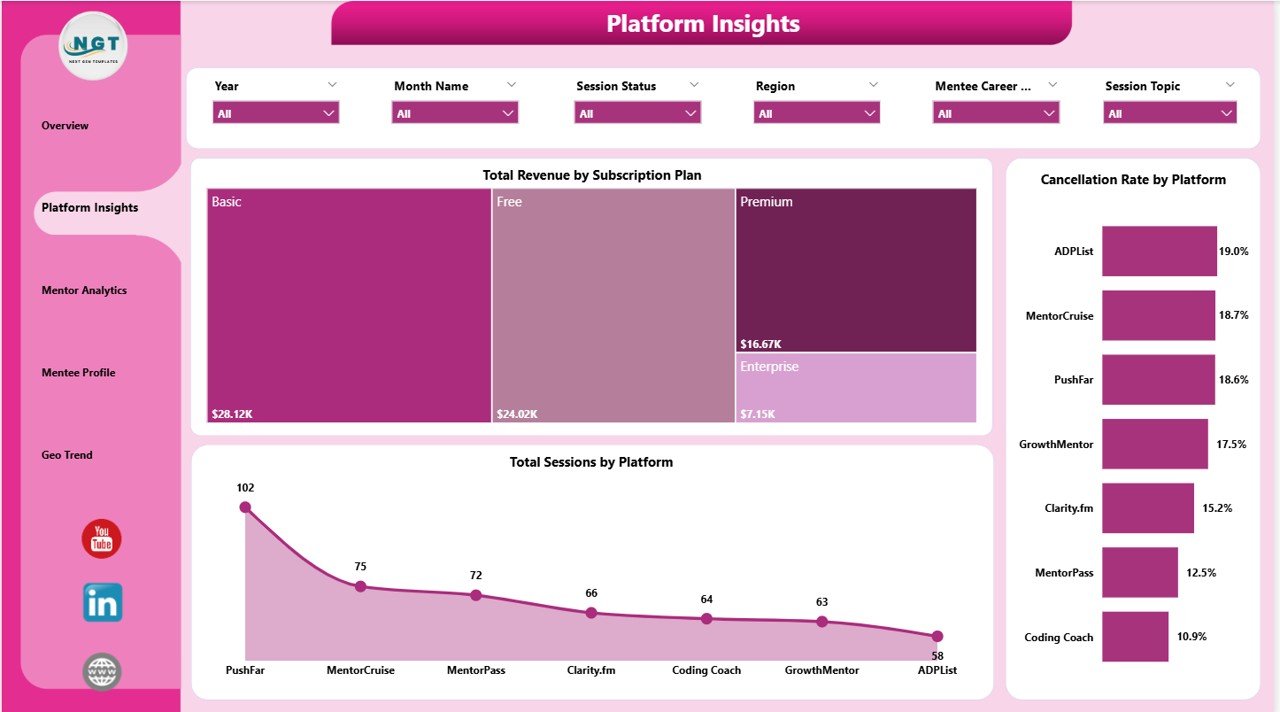
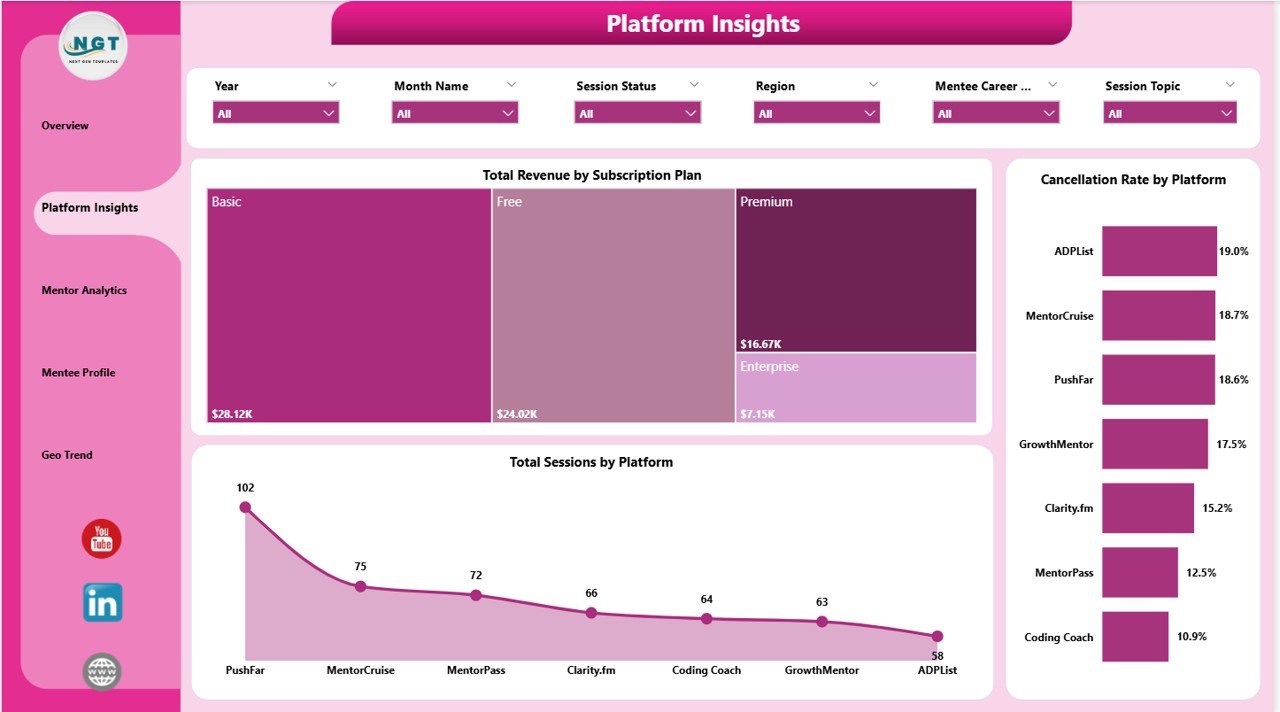
The Platform Insights page drills into platform-level performance across subscription and service dimensions. Total Revenue by Subscription Plan reveals which pricing tiers generate the most income. Cancellation Rate by Platform identifies which platforms have the highest churn risk in booked sessions. Total Sessions by Platform shows absolute session volume by platform so operators can compare activity levels across different marketplaces or service channels.
3. Mentor Analytics
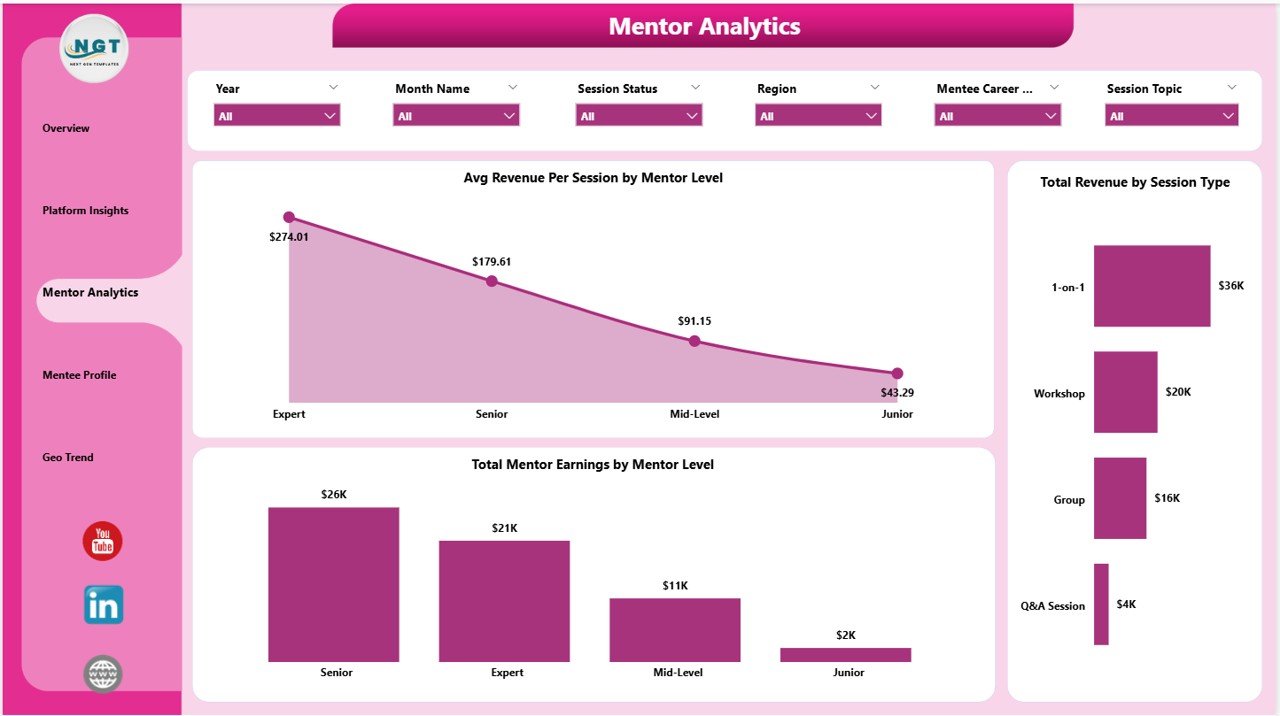
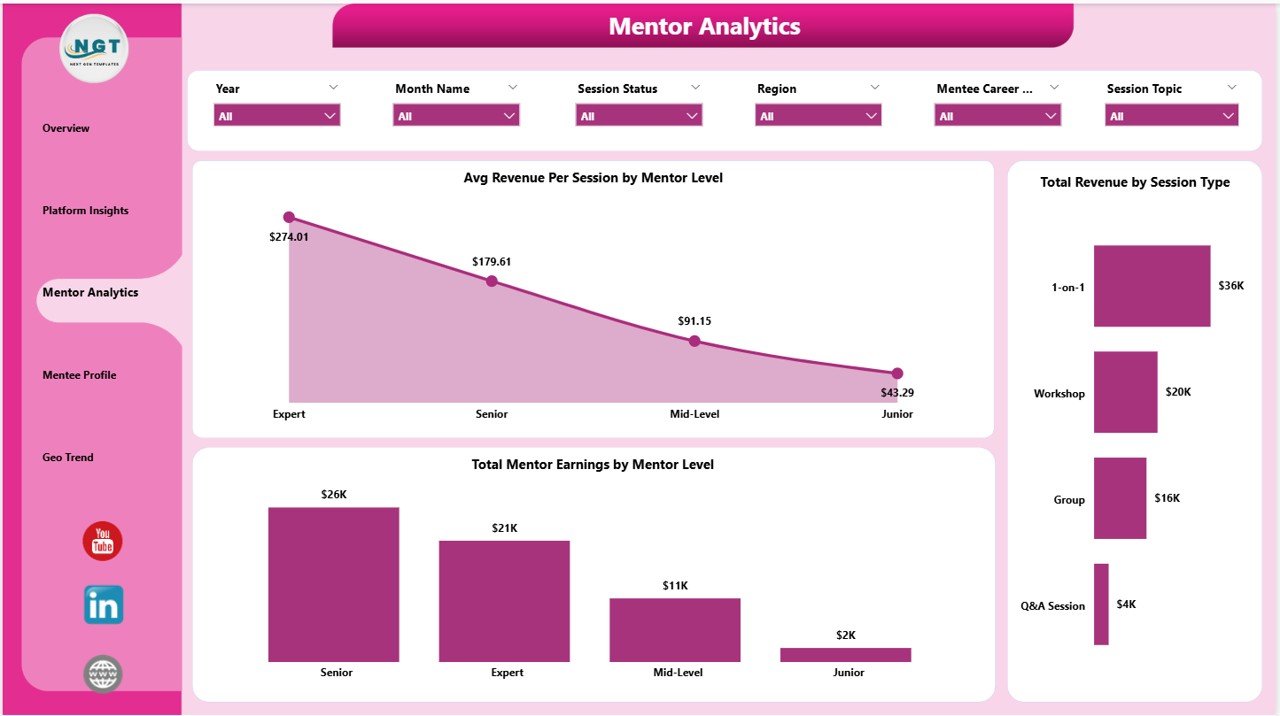
The Mentor Analytics page evaluates mentor performance and earnings stratified by experience level and session type. Avg Revenue Per Session by Mentor Level shows how per-session yield differs between junior, mid-level, and senior mentors — useful for pricing decisions. Total Mentor Earnings by Mentor Level compares total payout obligations by tier. Total Revenue by Session Type breaks revenue down across session formats such as one-on-one, group, and workshop sessions.
4. Mentee Profile
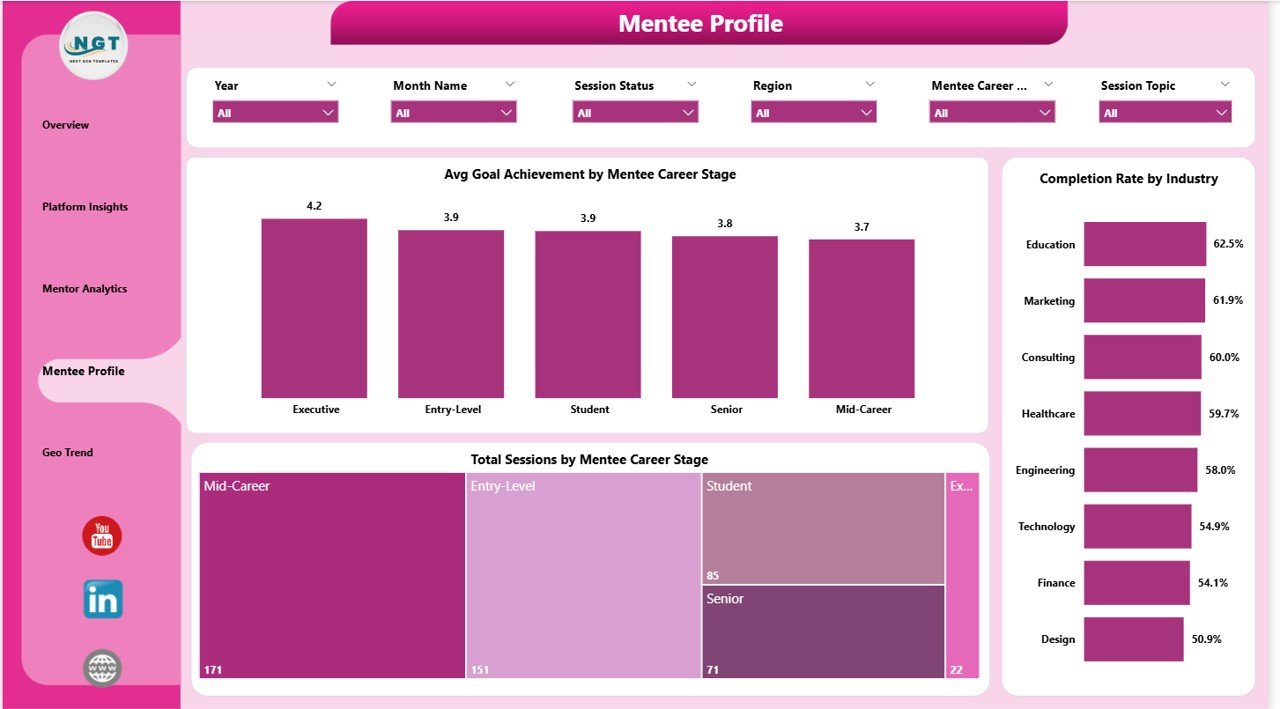
The Mentee Profile page focuses on the demand side of the platform — who is booking sessions and how well their goals are being met. Avg Goal Achievement by Mentee Career Stage shows whether early-career, mid-career, or senior mentees are reaching their stated development goals. Total Sessions by Mentee Career Stage reveals where session volume concentrates. Completion Rate by Industry shows which sectors have the highest and lowest session completion rates.
5. Geo Trend
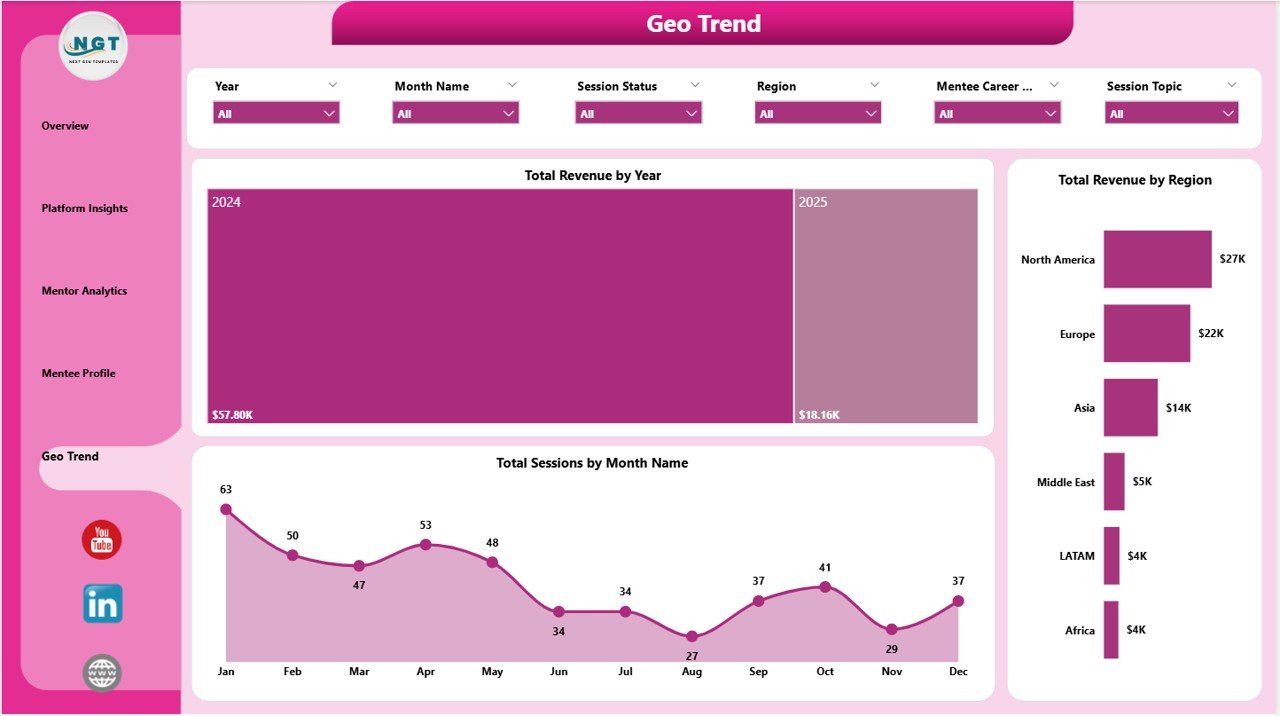
The Geo Trend page maps revenue and session activity across time and geography. Total Revenue by Year shows multi-year revenue growth curves for investor and leadership reporting. Total Revenue by Region identifies geographic markets where the platform generates the most income. Total Sessions by Month Name surfaces seasonality patterns that can inform staffing and marketing calendar decisions.
Career Mentorship Platforms Dashboard in Power BI vs. Excel Dashboard vs. Mentalis / Together Platform — Where This Fits
| Feature | Power BI Dashboard (This) | Excel Dashboard | MentorcliQ / Together |
|---|---|---|---|
| Cost | $17.99 one-time | $17.99 one-time | $10–25 / user / month |
| Platform | Power BI Desktop (free) | Microsoft Excel | SaaS web app |
| Visual interactivity | Cross-filter, drill-through | Slicer-based filtering | Fixed SaaS dashboards |
| Setup time | Under 10 minutes | Under 10 minutes | Days (onboarding) |
| Works offline | Yes (Desktop app) | Yes | No — requires internet |
| Customizable KPIs | Fully editable DAX + visuals | Pivot-driven, fully editable | Fixed vendor metrics |
| Year-1 cost (5 users) | $17.99 total | $17.99 total | $600–1,500+ |
| Share via Power BI Service | Yes (Pro license required) | Via SharePoint / OneDrive | Native |
For mentorship platform analysts and HR teams who want Power BI’s cross-filtering and drill-through capabilities without a SaaS subscription, the Career Mentorship Platforms Dashboard in Power BI delivers professional-grade reporting at a one-time cost.
Who This Template Is For — and Who It’s Not For
This template is built for:
- Career coaching platform operators who need session, revenue, and goal analytics in Power BI
- HR and L&D teams running internal corporate mentorship programs with 50–5,000 participants
- EdTech startups and coaching businesses reporting across multiple platforms or subscription tiers
- Power BI analysts and data professionals building reporting layers for education or coaching clients
- Operations managers who want to present mentorship ROI to leadership using Power BI visuals
This template is NOT for:
- Teams needing real-time live API connectors to mentorship CRM platforms (data must be loaded manually or via Power Query)
- Organizations requiring SOC 2-compliant SaaS with role-based access and SSO
- Users without access to Power BI Desktop (free from Microsoft at powerbi.microsoft.com)
How to Use the Career Mentorship Platforms Dashboard in Power BI
- Download and open — Unzip the file and open the .pbix file in Power BI Desktop (free download from Microsoft).
- Review the data model — The dashboard includes a structured sample dataset with session records, mentor profiles, platform metadata, and geographic fields.
- Replace the sample data — Use Power Query Editor to connect your own data source (Excel, CSV, SQL, SharePoint) or paste records into the provided tables.
- Apply slicers — Use the interactive filters on each page to drill into specific platforms, mentor levels, career stages, regions, or time periods.
- Share or export — Export pages as PDF reports, publish to Power BI Service for team sharing, or embed in PowerPoint for presentations.
Real-World Use Cases
Priya runs operations for a career coaching startup across 3 platforms. She uses the Platform Insights page to compare cancellation rates and subscription plan revenue across platforms, and presents the Geo Trend page to investors to show regional growth momentum.
Marcus leads L&D at a 500-person tech company. He uses the Mentee Profile page to identify which career stages have the lowest goal achievement scores and uses the data to justify expanding senior mentor availability for early-career employees.
Ananya is a Power BI consultant who builds reporting dashboards for coaching clients. She uses this template as a starting point, customizes the DAX measures, and delivers branded dashboards in under a day instead of building from scratch.
Frequently Asked Questions
What KPIs does the Career Mentorship Platforms Dashboard in Power BI track?
The dashboard tracks Total Sessions, Total Revenue, Total Mentor Earnings, Completed Sessions, and Avg Goal Achievement at the top level. It also includes 12+ chart-level metrics across platform, mentor, mentee, and geographic dimensions.
Do I need a paid Power BI license to use this template?
No. Power BI Desktop is free to download from Microsoft and is sufficient to open, edit, and use this .pbix file. A Power BI Pro or Premium license is only needed if you want to publish and share the report via Power BI Service.
How do I update the data in the dashboard?
Open Power Query Editor (Home > Transform Data), update your data source connection or paste new records, then click Close & Apply. All visuals refresh automatically.
Can I customize the charts and DAX measures?
Yes. All visuals, measures, and calculated columns are fully editable. You can add new pages, modify existing measures, or connect additional data tables through the data model.
Is this template compatible with Power BI Service?
Yes. Once you open the .pbix file in Power BI Desktop, you can publish it to Power BI Service for team sharing. A Power BI Pro license (or Premium capacity) is required for sharing published reports.
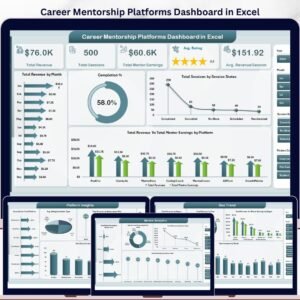
How does this compare to the Excel version of the Career Mentorship Dashboard?
Both cover the same 5 pages and analytical themes. The Power BI version offers cross-filtering between visuals, drill-through capabilities, and native DAX measures. The Excel version uses pivot tables and slicers and works entirely offline without any additional software.
What Excel or Power BI version is required?
Power BI Desktop (any version from 2022 onward is recommended). The file is a standard .pbix and does not use premium-only connectors or features.
About the Author
Built by PK — Microsoft Certified Professional with 15+ years of Excel, Google Sheets, and Power BI experience. Founder of NextGenTemplates, reaching 300K+ subscribers across YouTube channels (@PK-AnExcelExpert, @NextGenTemplates, @NeoTechNavigators). Every template is hand-built and tested before release.
Explore Related Templates
- Career Mentorship Platforms Dashboard in Excel — Same analytical pages in pivot-driven Excel format.
- Alumni Engagement KPI Dashboard in Excel — Education and coaching program performance tracking.
- Browse all Power BI Dashboard Templates
Click here to read the Detailed Blog Post
Ready to turn mentorship session data into clear Power BI reports? Download the Career Mentorship Platforms Dashboard in Power BI and start tracking revenue, earnings, goal achievement, and platform performance today.
Visit our YouTube channel for step-by-step video tutorials
👉 YouTube.com/@PKAnExcelExpert
Watch the step-by-step video tutorial:
YouTube
Compatibility and Requirements
- Works in Power BI Desktop, which is free to download from Microsoft.
- The file is a .pbix report. Open it in Power BI Desktop and replace the sample data through Power Query. Microsoft explains the download in Get Power BI Desktop.






























Reviews
There are no reviews yet.