


Organizing corporate events requires precision, accountability, and real-time insights. From conferences and trade shows to training sessions and team-building activities, every event involves multiple moving parts — costs, attendance, logistics, and feedback. Tracking all of this manually can be overwhelming and prone to errors.
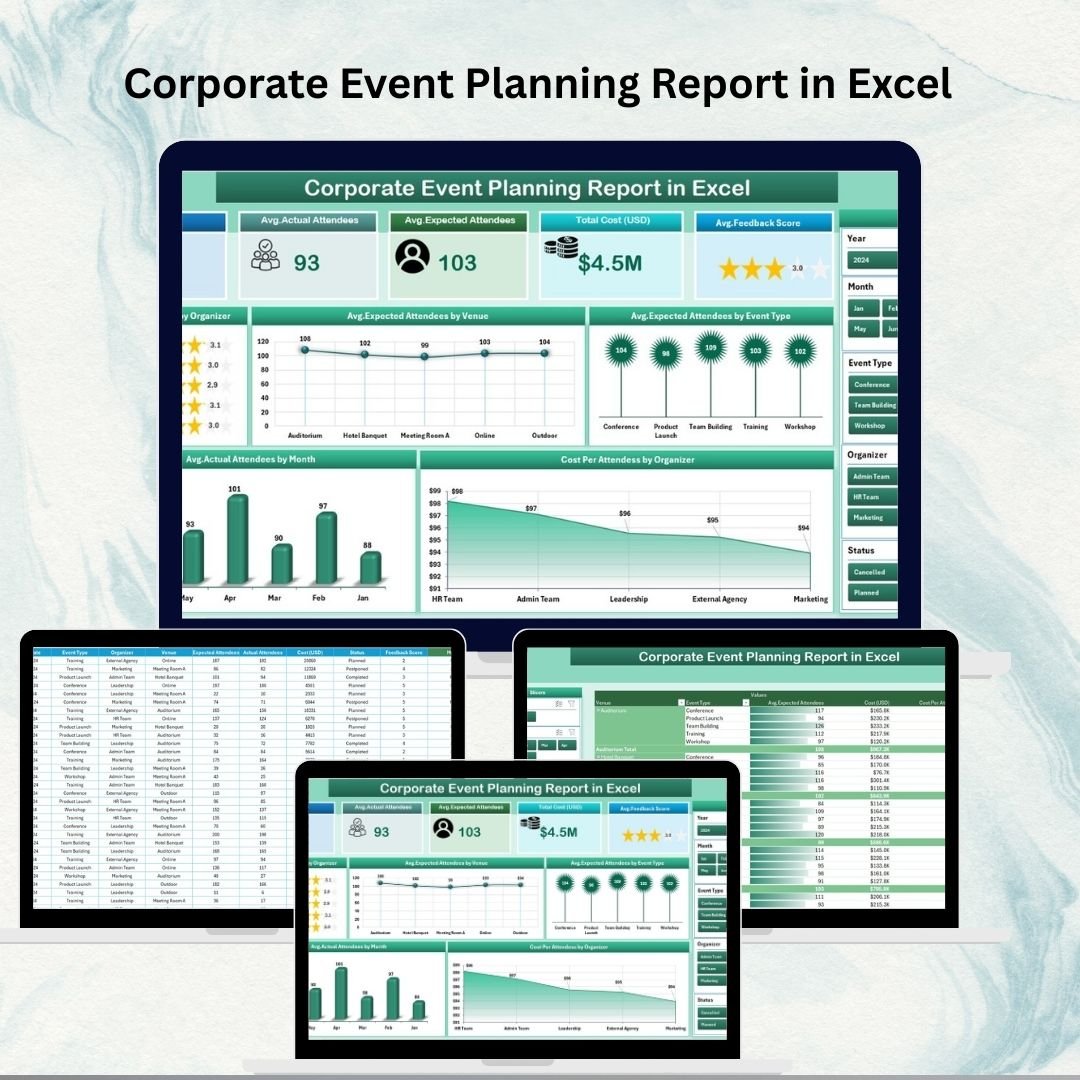
That’s why we designed the Corporate Event Planning Report in Excel — a ready-to-use reporting system that centralizes event data, automates calculations, and delivers powerful visual insights. With built-in dashboards, slicers, and KPIs, this Excel-based tool helps businesses plan smarter, measure performance, and optimize resources for every event.
🔑 Key Features of the Corporate Event Planning Report

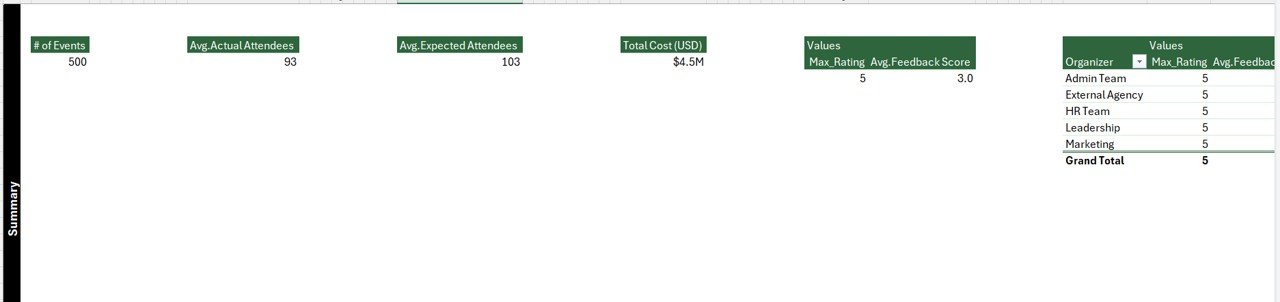
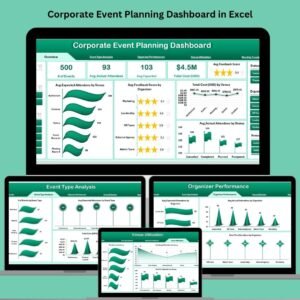
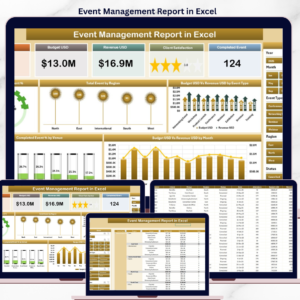
✨ Interactive Dashboard (Summary Page) – Get at-a-glance KPIs such as total events, costs, attendance, feedback score, and organizer count.
✨ Smart Slicers – Filter results by organizer, venue, event type, or month.
✨ Visual Performance Tracking – Charts for feedback scores, expected vs. actual attendance, and cost per attendee.
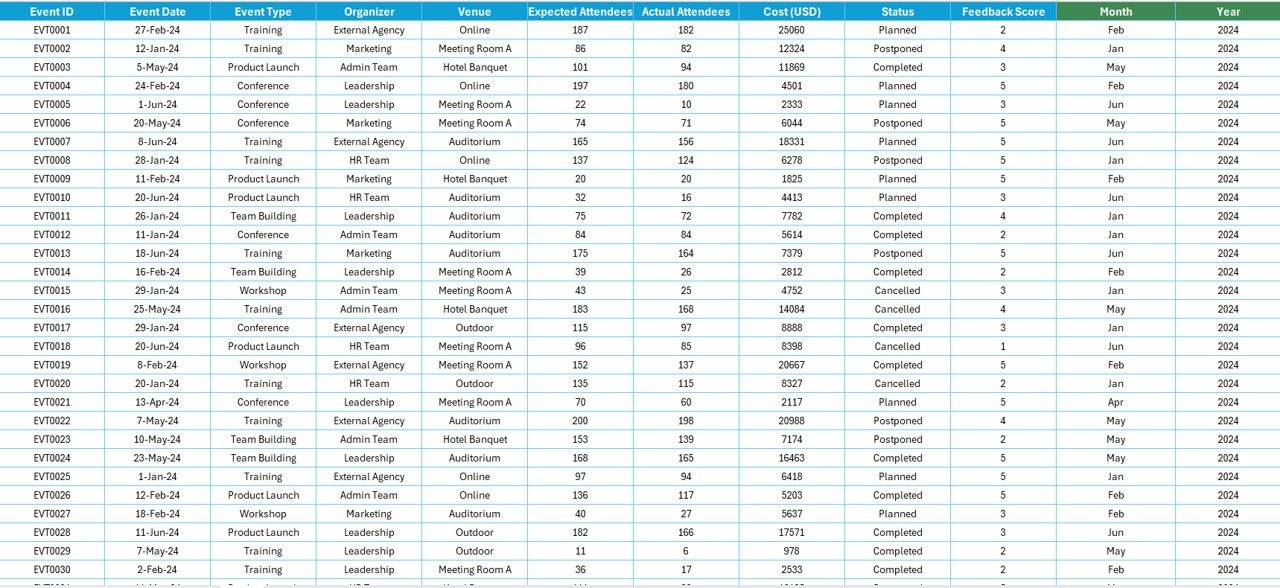
✨ Detailed Report Page – Tabular view of event details including dates, costs, attendance, and feedback.
✨ Centralized Data Sheet – Manage all records (event type, organizer, costs, attendees, and more) in one structured table.
✨ Support Sheet – Dropdown lists for organizers, venues, and event types ensure clean and consistent inputs.
✨ Beginner-Friendly – No advanced Excel skills required. Works out of the box with simple updates.
✨ Scalable – Suitable for small meetings as well as large-scale conferences.
📦 What’s Inside the Corporate Event Planning Report
When you download this Excel template, you’ll get:
1️⃣ Summary Dashboard – KPI cards + slicers + charts for instant insights.
2️⃣ Report Page – Event-by-event data in a structured, filterable table.
3️⃣ Data Sheet – Backbone of the report where all raw event data is stored.
4️⃣ Support Sheet – Reference values for organizers, venues, and categories.
This combination ensures accuracy, time savings, and actionable insights for any corporate event.
🛠️ How to Use the Report
✔️ Step 1 – Input Data: Enter event details (date, type, venue, organizer, costs, expected vs. actual attendees, feedback) in the Data Sheet.
✔️ Step 2 – Analyze Summary: Review key KPIs, charts, and slicers on the Summary Page.
✔️ Step 3 – Drill Down: Use the Report Page for detailed event-by-event data.
✔️ Step 4 – Track Costs & Attendance: Compare costs per attendee, feedback scores, and monthly attendance trends.
✔️ Step 5 – Share Insights: Export visuals into presentations or share the Excel file directly with stakeholders.
It’s a plug-and-play solution — no coding or advanced Excel needed.
👥 Who Can Benefit from This Tool
📊 Event Planners – Manage logistics and measure outcomes efficiently.
👩💼 HR Teams – Track internal employee events, workshops, and trainings.
📈 Marketing Departments – Evaluate promotional events, seminars, and client meetings.
💰 Finance Teams – Monitor event-related costs and calculate ROI.
👔 Senior Management – Gain high-level insights for decision-making.
Whether you’re running a small internal workshop or a large corporate conference, this report ensures you stay on top of performance.
With the Corporate Event Planning Report in Excel, you can:
✅ Centralize all event data in one file.
✅ Automate reporting with pre-built KPIs and charts.
✅ Save time compared to manual tracking.
✅ Optimize budgets with cost-per-attendee analysis.
✅ Improve event quality using attendee feedback insights.
Click here to read the Detailed blog post
Visit our YouTube channel to learn step-by-step video tutorials 👉 Youtube.com/@PKAnExcelExpert
Watch the step-by-step video tutorial:
Compatibility and Requirements
- Works in Microsoft Excel desktop (Excel 2016 or later, or Microsoft 365).
- The report uses slicers to filter results. Microsoft explains them in Use slicers to filter data.
Frequently Asked Questions
What sheets are in the report?
You get a Summary Dashboard, a Report Page, a Data Sheet that holds the raw event records and a Support Sheet with reference values.
How can I filter the results?
Slicers let you filter by organizer, venue, event type or month.
Does it show cost per attendee?
Yes. The charts cover cost per attendee, feedback scores and expected versus actual attendance.
How do dropdowns work for organizers and venues?
The Support Sheet holds the lists of organizers, venues and event types, which feed the dropdowns and keep entries consistent.
Related Event Planning Templates
- Corporate Event Planning Dashboard in Excel: a full dashboard version of this topic
- Event Planning KPI Dashboard in Excel: tracks event KPIs against targets
- Event Planning Calendar in Excel: plan event dates in a calendar
- Corporate Event Planning Dashboard in Power BI: the same topic built for Power BI
- Corporate Event Planning Dashboard in Google Sheets: the same topic for Google Sheets
Browse all Excel reports or the Excel dashboards.



Reviews
There are no reviews yet.